Journal for Person-Oriented Research
2018; 4(2): 49-62Published by the Scandinavian Society for Person-Oriented Research Freely available at https://www.person-research.org
DOI: 10.17505/jpor.2018.06
49
Process-symptom-bridges in psychotherapy:
An idiographic network approach
Tim Kaiser and Anton-Rupert Laireiter
University of Salzburg, Psychotherapy Research Group,Hellbrunnerstrasse 34, 5020 Salzburg, Austria
Email address:
Tim.Kaiser@sbg.ac.at
To cite this article:
Kaiser, T., & Laireiter, A.-R. (2018). Process-symptom-bridges in psychotherapy: an idiographic network approach. Journal for Person-Oriented Research, 4(2), 49-62. DOI: 10.17505/jpor.2018.06
Abstract
Aim: real-time monitoring of psychotherapeutic processes was recently described as a promising, new way of tracking
pe-riods of change in ongoing treatments. This approach generates complex, multivariate datasets that have to be presented in an intuitive way for clinicians to aid their clinical decision-making. Using network modeling and new approaches in cen-trality analyses, we examine “bridge nodes” between symptom stress and aspects of the psychotherapeutic process between therapy session (intersession processes, ISP).
Method: we recorded intersession processes as well as depressive and anxiety symptoms using daily questionnaires in ten
cases. Regularized, thresholded intraindividual dynamic networks were estimated. We applied bridge centrality analysis to identify individual bridges between psychotherapeutic processes and symptoms in the resulting models. Case-wise inter-pretations of bridge centrality values are offered.
Results: bridge centrality analysis revealed individual bridge nodes between intersession processes and symptom severity.
Strength and direction of bridges varied substantially across individuals.
Conclusion: given current methodological challenges, idiographic network studies are feasible and offer important insights
for psychotherapy process research. In this case, we demonstrated how patients deal with periods of increased symptom stress. In this case we have described how patients deal with their therapy under increased symptom load. Bridges between psy-chotherapeutic processes and symptom stress are a promising target for monitoring systems based on ISP. Future studies should examine the clinical utility of network-based monitoring and feedback in ongoing therapies. In the near future, process feedback systems based on idiographic models could serve clinicians to improve treatments.
Keywords: depression, anxiety, intersession processes, ecological momentary assessment, network analysis
Introduction
Intersession Processes in Psychotherapy
The effect of a session of psychotherapy should extend beyond the duration of the session. This basic statement is independent of the theoretical orientation of the therapist, the treatment goal or the individual problems of the patient. If one compares the time a patient spends in the sessions with the remaining waking time, it quickly becomes clear
how important the processes indicating therapeutic change between the sessions should be. Thus, the terms "Interses-sion process" (ISP) or "Interses"Interses-sion experience" (IE) were proposed for the description of these phenomena (Orlinsky, Geller, Tarragona, & Farber, 1993; Schröder, Wiseman, & Orlinsky, 2009).
The psychometric structure of ISP was studied in two independent samples (Hartmann, Orlinsky, & Zeeck, 2011) using the “Intersession Experience Questionnaire” (IEQ, Orlinsky & Tarragona, 1986). The IEQ makes it possible to
50 describe and measure ISP in a comprehensive form. ISP covers a wide range of cognitive, behavioral and emotional processes related to current psychotherapy. For example, patients can recall the contents of their last session or re-flect on possible contents of the next session. At the behav-ioral level, ISPs include attempts to implement therapy content in practice. On the relationship level, a desire for contact with the therapist can develop between sessions. These dimensions of content can in turn be of different emotional valence and occur in different situations.
ISP has been shown to predict treatment outcome in studies using weekly pre-session IEQ measures (Hartmann, Orlinsky, Weber, Sandholz, & Zeeck, 2010; Zeeck et al., 2016; Zeeck & Hartmann, 2005). Because at least some aspects of ISP are reported by more than 90% of patients (Orlinsky et al., 1993), they may be well suited to monitor-ing the course of therapy not only in terms of expectations of success. In ongoing therapies, they could also be an ap-propriate goal to adapt interventions without relying on symptom-focused techniques. Currently, there are no em-pirical studies on the complete absence of ISP. Although it is rare, there may be patients who do not report any form of ISP. The reasons for this may vary depending on the stage of therapy and the method but are probably related to the patient's detachment from their therapy.
New approaches in modeling individual data
Proponents of psychology as an idiographic science ar-gue that a large proportion of phenomena – processes - studied in psychology cannot be examined on the group level (Molenaar, 2013). These processes have been shown to be not homogenous, meaning that their correlational structure is not uniform across individuals. Processes also show changes in mean and variance over time, further complicating group-level study designs (Molenaar, 2004). These properties violate the assumptions of group-level study designs. Instead, small-N designs or case studies were proposed (Fisher, Medaglia, & Jeronimus, 2018; Mo-lenaar, 2013; Smith & Little, 2018) including statistical methods that adequately model intraindividual variation.The treatment of mental disorders, including psycho-therapy, psychiatry or clinical psychology, can profit from this person-based approach as well. Statistical methods can be applied to individual psychometric data, like question-naires administered via mobile devices (ecological momen- tary assessment, EMA) daily, or even several times a day (Fisher, 2017; Molenaar, 1985). This way, insights with high ecological validity about an individual’s psychopatho- logy can be gained and used for treatment. Time-series models can reveal which symptoms influence other symp-toms, so that the “root cause” of a disorder can be targeted directly using personalized interventions. Although the util-ity of various parameters of network models for targeting interventions has been disputed from a methodological point of view (Fried, 2017), a small number of studies
in-vestigated the use of individual time-series models, includ-ing network models, in interventions (Epskamp, van Bor- kulo, et al., 2017; Kroeze et al., 2017). One possible appli-cation would be the assessment of symptoms before treat-ment onset, so that information from individual time-series models can be used for tailoring treatments, as proposed under the name “dynamic assessment treatment algorithm” (DATA; Fernandez, Fisher, & Chi, 2017; Fisher & Boswell, 2016). This approach works by grouping symptoms by us-ing factor analysis and then modelus-ing their temporal dy-namics with multivariate time-series analysis. Using coeffi-cients from these models, information about how symptoms influence one another can be derived, offering possible information on which symptom to target first.
Another method of analyzing complex data is network analysis. It has been used to study mental disorders as net-work structures of interacting symptoms. First proposed and later refined and extended by Borsboom (2008, 2017), the “network theory of mental disorders” proposes that mental disorders are best understood as networks of inter-action between different components (i.e. symptoms) that are linked through direct causal connections. The theory also states that certain symptoms have stronger connections in the network and that some symptoms can be grouped together into communities. Various applications in psycho-pathology were reported, like a network analysis of depres-sive symptoms measured by the Beck Depression Inventory (Bringmann, Lemmens, Huibers, Borsboom, & Tuerlinckx, 2015), social anxiety disorder (Heeren & McNally, 2017) or post-traumatic stress disorder (McNally, 2017). When applied to large, cross-sectional datasets, network models of DSM-IV symptoms provide insights into comorbidity between psychiatric disorders on the population level (Boschloo et al., 2015).
However, as other methods that have been introduced here, network analysis is not limited to cross-sectional data. If applied to individual time series, network analysis can offer insights into the dynamic structure of psychopatholo-gy. In ongoing treatments, personal network models have been studied as a means of psychoeducation and as a feed-back tool for clinicians. One case study by Kroeze et al. (2017) reported that a personalized network motivated a treatment-resistant patient suffering from anxiety and de-pression to undergo an exposure intervention. A graphical representation of the model was used to educate the person about body discomfort being the probable root cause of her problems. David, Marshall, Evanovich and Mumma (2017) derived a network structure for a patient suffering from major depressive disorder and social anxiety disorder, which revealed the underlying functional relations of the client’s disorder. The authors showed that tension, worry and trouble in concentrating were important in this network, leading them to suggest muscle relaxation and mindfulness exercises.
Recently, a new interpretation method called “bridge ex-pected influence” (BEI, Jones, Ma, & McNally, 2017) has
51 been proposed for network models. It was developed to identify “bridges” linking communities of nodes in net-works. For example, a study on complicated grief symp-toms and posttraumatic growth identified the item indicat-ing a “change of worldview due to loss” as a bridge node between both communities (Bellet, Jones, Neimeyer, & McNally, 2018). In this study, BEI will be used to identify aspects of ISP that are linked to symptom stress.
This offers a convenient method to interpret patients’ in-tersession engagement with session content. A positive process-symptom BEI indicates that increased symptom stress and ISP co-occur. For example, a positive BEI for remembering events from last session would indicate that higher scores for this item positively influence symptom stress. Conversely, a negative BEI for imagining a dialogue with the therapist means that this item scores lower on days with higher symptom stress.
Current issues in process monitoring
Human change processes are non-ergodic. This means that intraindividual variation of these processes over time is different from interindividual variation across persons (Molenaar & Campbell, 2009). In non-ergodic psychologi-cal processes, the underlying models are not homogeneous: they vary greatly from person to person. Moreover, they are not stationary, so their statistical characteristics change over time. In non-ergodic psychological phenomena, traditional statistical research methods working at the group level of-ten reach their limits.
It has also been argued that human change processes are characterized by non-linearity (Schiepek et al., 2017). Input and output in a non-linear system are not proportional to each other. The future behavior of a non-linear system cannot be predicted with high accuracy. New idiographic methods and modeling approaches therefore continue to face the challenge of sudden changes in system dynamics (Schiepek, Heinzel, Karch, Plöderl, & Strunk, 2016). In EMA-based monitoring, one main advance has been made by Schiepek and colleagues by offering clinicians a com-prehensive software solution called “Synergetic Navigation System” (SNS) (Maurer, Aichhorn, Leeb, Matschi, & Schiepek, 2010). In inpatient settings, this method reached good compliance values for patients (Schiepek et al., 2016). The SNS enables researchers to administer web-based questionnaires on a regular basis. The questionnaires are automatically scored and the results displayed graphically so that the clinician can evaluate them conveniently.
Regular feedback discussions with the patient are an in-tegral part of SNS-based monitoring. The data from the daily surveys are interpreted by the patient himself, while the therapist is mainly involved in assisting the patient in structuring their interpretation. SNS-based feedback and the accompanying treatment procedure proposed by the authors (Schiepek, Eckert, Kravanja, Wallot, & Haussmann, 2014) is greatly based on the theory of synergetics. Thus, it offers various ways to analyze the recorded time-series
using non-linear methods. However, it is unclear whether therapists who work with SNS use the synergy-based func-tions (recurrence plots, dynamic complexity) of SNS in their daily clinical practice, or use the daily records rather "atheoretically", like a therapy diary.
One methodological challenge in the application of these methods in everyday clinical methods is how to enable cli-nicians to utilize these feedback tools. A recent assessment of attitudes towards process monitoring (Kaiser, Schmutzhart, & Laireiter, 2018) showed that only roughly one third of psychotherapists are willing to use process monitoring in their clinical practice. Therapists were par-ticularly concerned about the workload for patients, as dai-ly questionnaires could burden them. Most often, however, it was stated that the interpretation of process data was too complex to be introduced into everyday clinical practice. This objection is not unjustified: therapy process data are multivariate, non-linear time series. Their analysis requires complex statistical procedures. The use of process moni-toring could probably be facilitated if monimoni-toring systems process the complex data in such a way that clinicians can understand it independently of their theoretical orientation. This should be done without the system making too strong specifications, which render the clinical experience of the practitioner a secondary matter.
Network models could be a promising candidate, as they are relatively easy to interpret visually, interpretation aids like centrality are readily available and they can be used independent of a clinician’s theoretical approach to psy-chotherapy. The theory of intersession processes was di-rectly derived from ambulatory clinical practice and is well-established through decades of theoretical and empir-ical work (Stewart & Schroder, 2015).
In this study, we combine new methods of intraindividual dynamic network analysis and a theoretical framework that can be used to describe the degree to which patients are engaging in therapy between their sessions. According to the theory behind ISP, patients form mental representations of their therapy over time. Recurrent activation of these representations between sessions can occur due to a variety of reasons, but were reported to occur most frequently dur-ing periods of painful affect and conflict (Geller & Farber, 1993). Thus, it can be expected that ISP and symptom stress covary to some degree. However, this finding was reported based on cross-sectional data that is unfit to repre-sent individual cases.
Goals and Aims
In this paper, we try to validate the classic, cross-sectio- nal finding that ISP and increased psychological distress covary. For this purpose, we will conduct idiographic as-sessments of short symptom scales and intersession process scales with high (i.e. daily) temporal frequency. Second, we examine the utility of combining high-frequency assess-ment of ISP and symptom stress with current methods of network modeling as a means of intraindividual data
analy-52 sis that is fruitful for psychotherapy process research. In this study we will explore the dynamics between interses-sion processes and symptom load in order to take the first step for future monitoring applications. To achieve this, we demonstrate a method of moving-window network analysis that focuses on the withperson correlations between in-tersession process and symptom stress. Monitoring of net-works that change over the course of therapies has already been suggested by David, Marshall, Evanovich and Mum-ma (2017). As a first demonstration of possible monitoring applications, we will demonstrate a moving-window tech-nique of idiographic network analysis to show the change of process- symptom- connections over time.
Design and Methods
Recruitment and participants
All patients were treated in the outpatient clinic of the University of Salzburg. During admission, they received information about the planned study. Treatment was deliv-ered in a manualized form of transdiagnostic cognitive- behavioral therapy of emotional disorders (“Unified Proto-col for Transdiagnostic Treatment of Emtional Disorders”, Barlow, 2011).
The diagnostic instruments at admission and termination included the structured clinical interview MINI-DIPS (Margraf, 2013) and the Hamilton rating scales for anxiety and depression (HAM-A, HAM-D, Hamilton, 1959, 1960). All participants fulfilled diagnostic criteria for either major depression, social anxiety disorder, generalized anxiety disorder, or combinations of those. The exclusion criteria were current substance dependency, bipolar disorder, acute suicidality or psychosis. Treatment length was between eleven and 35 weeks with variations due to number of treatment sessions, vacations or rescheduled sessions. Raw scores for HAM-A and HAM-D at intake and after treatment are reported.
We calculated reliable change index (RCI) scores using coefficient alpha and standard deviations reported for Ger-man samples (Maier, Buller, Philipp, & Heuser, 1988; Maier, Philipp, & Gerken, 1985). For HAM-D, a coefficient alpha of .73 and a standard deviation of 6.95 was used, resulting in a change of 9 points or more to be considered reliable. For HAM-A, an ICC of .74 and a standard deviation of 16.08 was reported, so that a change of 17 points or more will be considered reliable.
Daily assessments
Network models were fit to item-level time series. De-pending on the diagnosis of the patient (depression, gener-alized anxiety disorder and/or social anxiety disorder), pa-tients received one or more brief symptom scales. Addi-tionally, a short intersession process scale was used to measure therapeutic processes.
PHQ-9. For daily measurement of symptom stress, we
decided to use a well-validated measure of major depres-sion (Kroenke, Spitzer, & Williams, 2001). This nine-item questionnaire was used successfully in previous studies with similar settings (Burns et al., 2011; Torous et al., 2015). The PHQ-9 was scored according to the two-factor structure reported by Guo et al. (2017), who found an af-fective and a somatic component to be of ideal fit.
GAD-7. For daily assessment of anxiety symptoms, we
used another short measure, the GAD-7 (Spitzer, Kroenke, Williams, & Löwe, 2006). Just like the PHQ-9, the GAD-7 was shown to be of good psychometric quality regarding its reliability and validity. It consists of seven items that follow the DSM-IV criteria for Generalized Anxiety Disorder, even though it has successfully been used with other anxi-ety disorders as well (Kroenke, Spitzer, Williams, Monahan, & Löwe, 2007).
SAD-D. For social anxiety symptoms, we used a ten-
item severity measure based on DSM-5 criteria (Knappe et al., 2014). This scale assesses cognitive, behavioral and affective symptoms of social anxiety disorder.
Short Intersession Process Scale (SIPS). The SIPS is a
short scale with ten items for assessing various aspects of intersession processes in psychotherapy (Kaiser & Laireiter, 2018). The SIPS was developed specifically for ambulatory assessment studies on intersession processes. The items of the SIPS were selected so that they convey enough mean-ing in smean-ingle-item interpretation.
Procedure
All daily assessments were conducted using the assess-ment module of the DynAMo software package (Kaiser & Laireiter, 2017). Data was transmitted over a secure con-nection and saved to an online storage only accessible to the authors. All items in daily measures were assessed on a 0 to 100 visual analog scale. Patients received text messag-es including a personalized URL every 24 hours. Mmessag-essagmessag-es were sent out between 5 and 10 pm. The exact time was the patients’ choice.
Network modeling
Data preparation. All time series were tested for linear
trend components using the KPSS test (Kwiatkowski, Phil-lips, Schmidt, & Shin, 1992). The KPSS test is used for testing the null hypothesis that a time series has a linear trend component. Time series that have trend components violate the assumptions of the statistical approaches used in this study. Thus, linear detrending was applied in the case of a significant test result before calculating the correlation ma- trix. If a patient missed their daily assessment or the delay was so large that they filled out the questionnaire after mid- night, this resulted in unequally spaced time series. To cor-rect for this, we applied cubic spline interpolation. If the de- lay was larger than 24 hours, this day was treated as missing.
Network estimation. We used the R-package qgraph
53 structures of intersession process and symptom scores. We estimated regularized partial correlation networks using the EBICglasso procedure (Epskamp, Borsboom, & Fried, 2017). Partial correlation networks indicate how strong the relationship between two variables is after the influence of all other variables has been controlled for. The least absolute shrinkage and selection operator (LASSO) was applied to reduce the false-positive rate. This procedure reduces small edge weights to zero. Shrinkage parameters are chosen so that the extended Bayesian Information Criterion (EBIC) is minimized. In simulation studies this method was shown to reduce the false-positive rate of connections in networks (Epskamp, Waldorp, Mõttus, & Borsboom, 2016). Thus, EBICglasso can be seen as a conservative approach to model estimation when data are sparse. To further minimize the false-positive rate, we employed a thresholding rule recommended by Jankova and van de Geer (2018). Under this rule, weak edges in the network are set to zero, enforc-ing high specificity. We computed a network density coef-ficient for every patient’s network. Network density is the fraction of the number of edges in a patient’s network di-vided by the total number of edges that would theoretically be possible in the network.
Graphical representation. Networks contain nodes
(symptom and intersession process items) and edges (con-temporaneous correlations between scores). In the network graphs, nodes are connected by edges of varying thickness. The thicker an edge, the higher the partial correlation coef-ficient between two items. Blue edges indicate positive correlations while red egdes indicate negative correlations. Nodes are placed using the Fruchterman-Reingold algorithm (Fruchterman & Reingold, 1991). This algorithm places more strongly connected nodes closer to each other and nodes with stronger connections more to the center of the graph. This allows easy visual interpretation.
Centrality. Interpretation of network models is facilitated
by various measures of centrality. These measures are good indicators for determining the relative importance or influ-ence of specific nodes (Epskamp, Borsboom, et al., 2017; Epskamp & Fried, 2016). This is helpful for interpretation, as they summarize multiple connections of a node into one measure. In non-directed networks, three main indicators of centrality are generally used: betweenness, closeness, and strength. Betweenness indicates the number of times a node lies on the shortest path between two other nodes, thus “re-laying information” between those nodes. Strength is the sum of absolute edge weights of a node, which shows how strong the influence of this node in its network is. Closeness is the reciprocal of the sum of shortest path lengths between a node and all other nodes. Bridge expected influence will be estimated to get quantitative indicators for the strength of connection between intersession processes and symptom stress.
Moving window centrality analysis. Since a large
amount of data was available for one patient, we chose this for the illustration of the moving-window technique. Using the methods described above, a series of network models for windows of analysis with the size of 100 time points will be calculated for this patient’s data set. This means that we estimate network models for time point 1 to 100, point 2 to 101, 3 to 102, and so on. Average BEI values will be cal-culated for each of the models, resulting in a series of BEI values. This way we can demonstrate how the strength of the bridges between process and symptoms changes over time.
Results
Table 1 summarizes demographic data and diagnoses for all patients, including the individual sample size and symptom ratings before and after treatment.
Table 1. Description of subjects, individual sample sizes and Hamilton scores for anxiety and depression before and after
treatment.
No. Age Gender Diagnosis N Missing HAM-A
pre
HAM-A post
HAM-D pre HAM-D post P01 23 F DEP, GAD 113 15 24 11 15 3* P02 48 M DEP, GAD 83 7 23 3* 15 2* P03 21 F SAD 106 15 25 8* 18 5* P04 19 F DEP 122 17 13 19 17 11 P05 18 F SAD, DEP 185 0 29 9* 14 5* P06 29 F DEP 248 5 9 8 18 17 P07 21 F DEP, GAD 120 18 19 13 18 7* P08 25 M DEP, GAD 103 7 24 7* 16 6* P09 33 F SAD 177 22 21 8 10 7 P10 53 M GAD 116 15 16 7 10 10
Note. DEP = depression, GAD = generalized anxiety disorder, SAD = social anxiety disorder. HAM-A = Hamilton rating scale for anxiety score. HAM-D = Hamilton rating scale for depression score. *: reliable pre-post change; the value is equal to or below the reliable change threshold. N = number of time points sampled. Missing = number of missing time points.
54 Table 2. Node names and content descriptions of all
items used in individual network models. Node
name
Symptom/Aspect
Phq1 Little interest, pleasure in doing things Phq2 Feeling down, depressed, hopeless Phq3 Sleep problems
Phq4 Tired, little energy
Phq5 Poor appetite or overeating Phq6 Feeling bad about yourself Phq7 Trouble concentrating Phq8 Slowing down or restlessness Phq9 Suicidal thoughts
Gad1 Nervous, anxious, on edge Gad2 Unable to stop worrying Gad3 Worrying too much Gad4 Trouble relaxing Gad5 Being restless Gad6 Annoyed, irritable
Gad7 Afraid as if something awful might happen
Sad1 Terror, fear, fright in social situations Sad2 Anxious, worried, nervous
Sad3 Thoughts of being rejected, humiliated Sad4 Racing heart, sweat, trouble breathing Sad5 Muscle tension, restlessness in social
situations
Sad6 Avoidance of social situations Sad7 Left social situations early
Sad8 Excess time preparing for social situa-tions
Sad9 Distraction
Sad10 Help coping with social situations Isp1 Thought about things that you could not
express freely last session
Isp2 Thought about basic conditions (costs, appointments)
Isp3 Thought about topics for next session Isp4 Thought about therapist
Isp5 Imagined dialogue with therapist Isp6 Remembered events from last session Isp7 Solving problems as discussed in
ses-sions
Isp8 New ideas on topics discussed Isp9 Positive treatment-related emotions Isp10 Negative treatment-related emotions Note. Content descriptions represent item content, not the complete item text. For full item text, refer to the scales’ respective publications.
Individual network model results
Contemporaneous partial correlation networks were successfully estimated for all patients. Network models will be presented as graphs using the following color scheme: symptom stress item nodes are colored blue, ISP items are
colored yellow. Positive associations between nodes are blue, negative associations are red. Table 2 provides a key of node names for all network models.
Intercommunity analysis. Bridge expected influence
scores for ISP items are listed in table 3. Additionally, within-patient average BEI scores were calculated. Brief summaries of the most prominent process-symptom bridge nodes for all ten patients will be provided here. Bridge nodes are considered “prominent” if their absolute values surpass the within-person average BEI value (|BEIp|). Complete centrality measures for all models are provided in the sup-plementary material.
P01. The patient reported more frequent thoughts about
topics (isp3) for her next session. When inspecting the network graph, thoughts about the next session’s content (isp3) were strongly linked to being “annoyed and irritable” (gad6), suggesting that this is currently a core problem the patient would like to discuss. Conversely, thoughts about “things that she could not express freely” in the last session (isp1) was negatively connected to this item. The relatively high bridge centrality of these items (BEIisp3 = 0.34; BEIisp1 = -0.25) could also indicate that the patient expresses her intention to use her therapy sessions for addressing her problems with irritability.
55
Table 3. Individual raw bridge expected influence scores for ten ISP items and their patient and item-wise averages.
P01 P02 P03 P04 P05 P06 P07 P08 P09 P10 Isp1 -0.25 0.30 -0.19 0.02 0.32 0.19 0.16 -0.34 0.61 0.06 Isp2 -0.30 -0.16 0.48 -0.13 0.15 0.04 0.41 Isp3 0.34 0.09 0.26 0.11 0.20 -0.41 0.26 -0.47 Isp4 0.16 -0.11 0.16 -0.33 -0.18 0.33 0.24 Isp5 0.21 -0.17 0.23 -0.17 -0.06 0.54 0.3 Isp6 * -0.32 0.30 0.31 0.63 -0.36 -0.19 Isp7 0.04 0.25 -0.23 0.19 -0.01 0.35 -0.66 -0.35 Isp8 0.04 0.14 -0.33 0.08 -0.01 Isp9 -0.25 0.30 -0.13 0.19 Isp10 0.24 0.16 0.16 0.20 -0.25 0.76 0.07 |BEIp| 0.12 0.11 0.20 0.10 0.16 0.04 0.24 0.21 0.30 0.19 Density 0.14 0.14 0.19 0.23 0.24 0.13 0.26 0.14 0.14 0.29
Note. *: item had to be excluded from the analysis due to all-zero scores. BEI values of zero are omitted. Higher BEI scores indicate that the item scored higher on days with increased symptom stress, while negative scores show the opposite. |BEIp|, mean of absolute BEI values for patients. Density: fraction of the number of non-zero edges in a patient’s network divided by the maximum possible number of edges.
Thoughts about her therapist (isp4) were also positively linked to symptom stress via the “trouble relaxing” item (gad4), while positive treatment-related emotions (isp9) were negatively connected. This indicates that the patient evaluates her treatment more positively on days with low symptom stress.
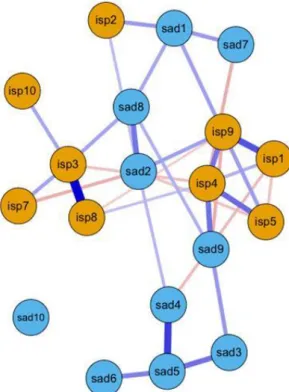
Figure 2. Network model of patient P02.
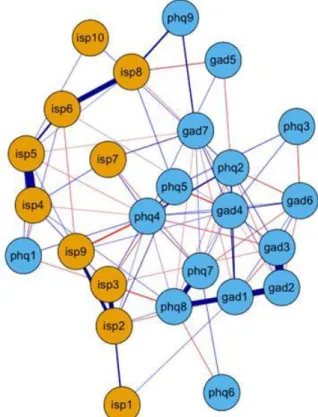
P02. This patient showed increased levels of problem
solving (isp7) under increased symptom stress (BEIisp7 = .25), which suggests that he uses skills he learned in therapy sessions outside of the therapy room. The strong connection of this item to “being restless” (gad5) could indicate that this patient successfully implements relaxation techniques learned in treatment. Solving problems was less likely on days with higher depressive affect (phq2) or sleep problems (phq3). Additionally, he is more likely to recreate the therapeutic dialogue (isp5) under this condition.
P03. Under increased symptom stress, this patient
re-ported more positive, treatment-related emotions (isp9) and more reflection on the next session’s content (isp3). This could mean that the patient starts to represent her treatment as something positive and is actively involved in the treat-ment process. Solving problems as discussed in sessions (isp7) was less likely under increased symptom load, espe-cially when feeling “anxious, worried or nervous about social situations”. This indicates that the patient still shows some avoidance when attempting to deal with aversive sit-uations.
P04. This patient reported more problem solving under
increased symptom stress (BEIisp7 = 0.19) and also seemed to reflect on session content more frequently (BEIisp3 = 0.11). She also reported more imagined dialogues on days with increased symptom stress (BEIisp5 = 0.23). Still, the patient did not achieve reliable change after termination.
P05. In this case, both items referring to the past therapy
session were positively linked to increased symptom stress (BEIisp1 = 0.32, BEIisp6 = 0.30), while both items involving the therapist were less likely to be reported on days with increased symptom stress (BEIisp4 = -0.33; BEIisp5 = -0.17).
56 Figure 3. Network model of patient P03.
Figure 4. Network model of patient P04.
Figure 5. Network model of patient P05.
57
P06. For this patient, only three bridge nodes were
ob-served, all of which are positively linked to symptom stress: thinking about things that she could not express freely last session (BEIisp1 = 0.19), and negative treatment-related emotions (BEIisp10 = 0.16) and thoughts about basic condi-tions (BEIisp2 = 0.04). These links indicate a mainly negative treatment evaluation with little to no helpful representations the patient has access to. Interestingly, this patient also did not achieve reliable change in her treatment.
P07. The network model of this patient is densely
inter-connected, and all ISP items have connections to her symptoms. The ISP items isp2 (thoughts about basic condi-tions, BEIisp2 = 0.41), isp6 (remembered events from last session, BEIisp6 = 0.31) and isp7 (solving problems as dis-cussed in therapy, BEIisp7 = 0.35) were especially high when symptom stress increased, while item isp3 (thinking about possible contents of the next session) was low under in-creased symptom stress (BEIisp3 = -0.41).
Figure 7. Network model of patient P07.
P08. This patient’s network is less densely connected but
contains a number of links between symptoms and ISP. Items 3 (thought about topics for next session, BEIisp3 = 0.26), 4 (thought about therapist, BEIisp4 = 0.33) and 6 (re-membered events from last session, BEIisp6 = 0.63) are most strongly linked to symptom stress. This indicates that the patient at least began to form a representation of his therapy that he can use to engage with symptom stress. Items 1 (thought about things that the patient could not express freely last session, BEIisp1 = -0.34), 8 (new ideas for topics discussed in sessions, BEIisp8 = -0.33) and 10 (negative treatment-related emotions, BEIisp10 = -0.25) were less
likely under increased symptom stress.
Figure 8. Network model of patient P08.
P09. In this graph, the relationships between ISP and SAD
symptom items become apparent. The item isp1 (Thought about things that you could not express freely last session) has a strong bridge connectivity (BEI = .61), which is likely to result from the strong connection to sad6 (Avoidance of social situations). The item isp7 (Solving problems as dis-cussed in sessions) is a strong negative bridge, which is negatively linked to two SAD items (sad5: Muscle tension, restlessness in social situations; sad8: Excess time preparing for social situations).
P10. For this patient, items isp4 (thought about therapist,
BEIisp4 = 0.24), isp5 (imagined dialogue with therapist, BEIisp5 = 0.30) and isp9 (positive treatment-related emo-tions, BEIisp9 = 0.19) were positively connected to symp-tom stress. This means that the recall of his representation of the therapist including positive emotions was more likely under this condition. This patient seems to activate his rep-resentation of her relationship with the therapist, which is accompanied by a positive evaluation of his therapy. Items isp3 (thought about topics for next session, BEIisp3 = -0.47), isp6 (remembered events from last session, BEIisp6 = -0.19) and isp7 (solving problems as discussed in sessions, BEIisp7 = -0.35) were negatively connected. This patient had more thoughts involving the therapist or dialogues with him under higher symptom stress, while he reflected more on the con-tent of past and future sessions and engaged in more problem solving under lower symptom stress.
58 Figure 9. Network model of patient P09.
Figure 10. Network model of patient P10.
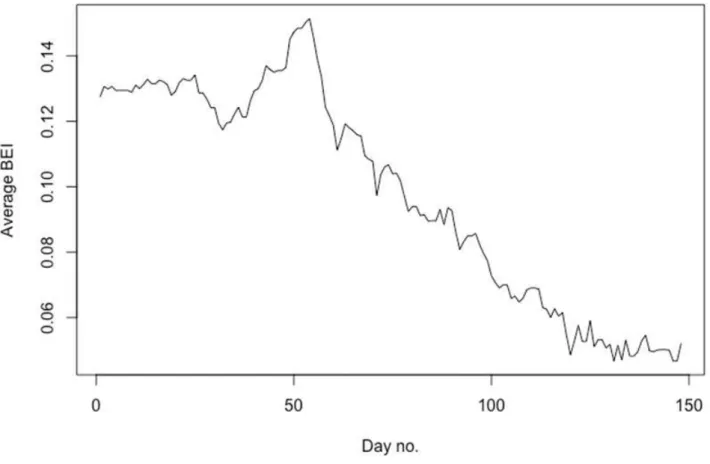
Moving-window network analysis. Due to the large
amount of data available for patient P06, she was selected for demonstrating the concept of moving-window network analysis. We obtained a series of 148 network models. For each of these models, we calculated the average bridge ex-pected influence. As illustrated in figure 11, the strength of connections between ISP and symptom stress peak after day 50 and substantially dropped over time. We provided a video animation showing the change in network models over time in the supplementary material.
Discussion
Using data courses from ten psychotherapies, we ex-plored and demonstrated an approach to modeling psycho-therapeutic processes and symptom stress in ongoing psy-chotherapies. To the authors’ knowledge, this is the first study that explores how intersession processes and symp-toms interact on a daily basis on an idiographic level. Alt-hough the available data come from a relatively homoge-neous sample, it was shown that the intraindividual rela-tionships of relevant variables vary greatly. Network mod-els are a valuable method in providing detailed insights into idiographic dynamics in psychotherapy. We discovered individual bridges between ISP and symptom stress for every patient, but also discovered a high interindividual variability. These bridges can provide important insights for psychotherapy process research, as they can describe pa-tients' treatment and problems on a temporally high- resolution level.
Our study validates the finding by Geller and Farber (1993) that predicted a covariation of ISP and symptom stress. Additionally, our findings indicate that there is sub-stantial variation in how exactly symptom stress and ISP interact. This could show that the representation of the therapy has a different function for each patient. Patient P06, for example, showed little ISP activation under increased symptom stress and did not achieve reliable change in her treatment. The few process-symptom bridges were rather negatively colored. In the moving-window network analysis, we showed that the process-symptom bridge strength dropped over the course of treatment. It is possible that this patient could not establish a stable working relationship or found the therapy unsuitable for her own problem so that, over time, the patient increasingly detached herself from the therapeutic process. Earlier studies on ISP and treatment outcome (Hartmann et al., 2010; Zeeck et al., 2016) reported that a composite variable of negative treatment-related emotions and recreation of the therapeutic dialogue was predictive of treatment failure. With our approach, we pro-vide further insights into this finding. If the retrieval of the representation of psychotherapy is associated with negative emotions, this could be an aversive stimulus. The patient tries to avoid this aversive stimulus, which is likely to reduce the frequency and intensity of recall. However, if the rep-resentation is activated too infrequently, it also means that it
59
Figure 11. Bridge expected influence values for network models estimated in moving windows of 100 time points obtained from patient P06.
is not retrieved at decisive moments - for example, when the symptoms are more severe. Especially in such situations, representations could be useful either by leading to the ap-plication of therapeutic skills or by recalling a supportive, caring therapeutic relationship. This also aligns with the finding that negative treatment-related emotions suppress ISP activity on subsequent days reported by Kaiser and Laireiter (2018).
Limitations
Because we used daily sampling, we decided to esti-mate only contemporaneous (intra-day) networks. All items set “today” as the time frame, so patients were instructed to judge a whole day retrospectively. Intraday fluctuations of symptoms are common, as many EMA studies have demonstrated (Ebner-Priemer & Trull, 2009). The same is likely to be true for intersession pro-cesses. For example, an early survey study on ISP has shown that individual ISP events generally last for about one minute to a few seconds (Farber & Geller, 1994). Thus, temporal dynamics of process and symptom vari-ables are probably much more fine-grained than daily assessment could capture. Modeling temporal associa-tions would have been likely to result in mostly auto-regressive associations under these conditions. For this
reason, the exact causal direction of associations in net-works remains unclear. This is partly compensated by the fact that we can use bridge expected influence to estimate the influence of individual items on node communities.
The statistical power of the network models is limited by a low number of observations. Because we used reg-ularized, thresholded partial correlation networks to es-timate sparse, conservative models, it is likely that some of the weaker connections were set to zero and thus do not occur in our models. This can be resolved by in-creasing the sample size in future studies, possibly by including patients from long-term interventions in the measurement process. Due to the low sample size, the estimation of spurious edges cannot be ruled out com-pletely. In order not to put too much strain on patients, we selected very short scales for daily assessments. Thus, certain aspects of both the patients’ disorders and in-tersession processes might not occur in our models.
Generally, dense networks lead to higher values of bridge centrality for all items. Thus, bridge centrality values should be interpreted relative to the overall net-work density or the average value of bridge centrality for one patient.
60
Outlook
Future work should study the utility for high- frequency monitoring of these processes more thor-oughly. Especially for providing feedback to therapists, network models can be promising, but much more work is needed before possible implementations are ready for clinical practice. The approach demonstrated here is promising because even with a relatively low number of variables, network models convey additional meaning by putting the focus on associations. For example, a cogni-tive-behavioral therapist might be interested if their pa-tient applies new behaviors on days with increased symptom stress. In more relationship-focused approach-es like psychodynamic or interpersonal therapy, associa-tions between positive, treatment-related emoassocia-tions and relationship processes could indicate the development of a positive therapeutic alliance.
On the client side, daily questionnaires over the whole course of psychotherapy can be straining. Unlike inpatient settings, ambulatory psychotherapy does not provide a fully controlled environment, so everyday tasks could reduce compliance when completing ques-tionnaires. The clinical utility of network-based moni-toring and feedback applications have to justify the addi-tional strain put on patients.
Methodologically, the approach proposed in this arti-cle could be extended to dynamic networks that model both time-lagged associations and contemporaneous correlations after partialling out time-lagged influences. One way to perform such analyses is graphical VAR (Epskamp, 2018).
Conclusion. Taken together, the results provided in
this study present a fine-grained examination of in-tersession processes in psychotherapy. As predicted, ISPs and symptom severity showed covariation in most patients. The application of bridge expected influence provided further details on how this covariance looks like when studied with greater detail. This represents another step in psychotherapy process research, as we have shown that these processes interact with symptom stress on an intraindividual level and that this interaction varies over time. While causality cannot be established in such networks, the idiographic approach we proposed can be seen as a new direction in this field. Future stud-ies should test the clinical utility of these findings with larger samples, possibly examining the predictive utility of network model data for treatment outcome or dropout.
Author contributions
TK designed the study, organized data collection, per-formed statistical analysis and drafted the first version of the manuscript and revised the manuscript after the first round of peer review. AL participated in the data collection and was actively involved in revising the manuscript. Both
authors read and approved the final manuscript.
Declaration of Interests
The authors declare no conflicting interests.
Ethical statement
The ethics committee of the University of Salzburg has reviewed and approved of the study (EK-GZ 23/2017). Written informed consent was obtained from all partici-pants.
Supplemental materials
The video of time-window network analysis is available online: https://osf.io/wqcrk
A file containing data from centrality analysis for every patient is available online: https://osf.io/j3y7x/
References
Barlow, D. H. (Ed.). (2011). Unified protocol for transdi-agnostic treatment of emotional disorders: therapist guide. New York: Oxford University Press.
Bellet, B. W., Jones, P. J., Neimeyer, R. A., & McNally, R. J. (2018). Bereavement Outcomes as Causal Systems: A Network Analysis of the Co-Occurrence of Complicated Grief and Posttraumatic Growth. Clinical Psychological Science, 216770261877745.
https://doi.org/10.1177/2167702618777454
David, S. J., Marshall, A. J., Evanovich, E. K., & Mumma, G. H. (2017). Intraindividual Dynamic Network Analysis – Implications for Clinical Assessment. Journal of Psy-chopathology and Behavioral Assessment, 1–14. https://doi.org/10.1007/s10862-017-9632-8
Ebner-Priemer, U. W., & Trull, T. J. (2009). Ecological momentary assessment of mood disorders and mood dysregulation. Psychological Assessment, 21(4), 463–475. https://doi.org/10.1037/a0017075
Epskamp, S. (2018). graphicalVAR: Graphical VAR for Experience Sampling Data (Version 0.2.2). Retrieved from
https://CRAN.R-project.org/package=graphicalVAR Epskamp, S., Borsboom, D., & Fried, E. I. (2017).
Esti-mating psychological networks and their accuracy: A tu-torial paper. Behavior Research Methods.
https://doi.org/10.3758/s13428-017-0862-1
Epskamp, S., & Fried, E. I. (2016). A Tutorial on Regular-ized Partial Correlation Networks. ArXiv:1607.01367 [Stat]. Retrieved from http://arxiv.org/abs/1607.01367 Epskamp, S., van Borkulo, C. D., van der Veen, D. C.,
Servaas, M. N., Isvoranu, A.-M., Riese, H., & Cramer, A. O. (2017). Personalized network modeling in psycho-pathology: The importance of contemporaneous and temporal connections. Clinical Psychological Science, 6(3), 416–427.
61 Epskamp, S., Waldorp, L. J., Mõttus, R., & Borsboom, D.
(2016). The Gaussian Graphical Model in
Cross-sectional and Time-series Data. ArXiv:1609.04156 [Stat]. Retrieved from http://arxiv.org/abs/1609.04156 Farber, B. A., & Geller, J. D. (1994). Gender and
represen-tation in psychotherapy. Psychotherapy: Theory, Re-search, Practice, Training, 31(2), 318–326.
https://doi.org/10.1037/h0090216
Fernandez, K. C., Fisher, A. J., & Chi, C. (2017). Devel-opment and initial implementation of the Dynamic As-sessment Treatment Algorithm (DATA). PLOS ONE, 12(6), e0178806.
https://doi.org/10.1371/journal.pone.0178806
Fisher, A. J. (2017, March 23). A Network Model for Inte-grating Contemporaneous and Temporal Effects: Map-ping the Idiographic Dynamics of Mood and Anxiety. Retrieved April 9, 2017, from https://osf.io/zefbc/ Fisher, A. J., & Boswell, J. F. (2016). Enhancing the
Per-sonalization of Psychotherapy With Dynamic Assess-ment and Modeling. AssessAssess-ment, 23(4), 496–506. https://doi.org/10.1177/1073191116638735
Fisher, A. J., Medaglia, J. D., & Jeronimus, B. F. (2018). Lack of group-to-individual generalizability is a threat to human subjects research. Proceedings of the National Academy of Sciences, E6106–E6115.
https://doi.org/10.1073/pnas.1711978115
Fruchterman, T. M., & Reingold, E. M. (1991). Graph drawing by force-directed placement. Software: Practice and Experience, 21(11), 1129–1164.
Geller, J., & Farber, B. (1993). Factors Influencing the Process of Internalization in Psychotherapy. Psycho-therapy Research, 3(3), 166–180.
https://doi.org/10.1080/10503309312331333769 Hamilton, M. (1959). The assessment of anxiety states by
rating. British Journal of Medical Psychology, 32(1), 50–55.
Hamilton, M. (1960). A rating scale for depression. Journal of Neurology, Neurosurgery, and Psychiatry, 23, 56–62. Hartmann, A., Orlinsky, D., Weber, S., Sandholz, A., &
Zeeck, A. (2010). Session and intersession experience related to treatment outcome in bulimia nervosa. Psy-chotherapy: Theory, Research, Practice, Training, 47(3), 355–370. https://doi.org/10.1037/a0021166
Hartmann, A., Orlinsky, D., & Zeeck, A. (2011). The struc-ture of intersession experience in psychotherapy and its relation to the therapeutic alliance. Journal of Clinical Psychology, 67(10), 1044–1063.
https://doi.org/10.1002/jclp.20826
Jankova, J., & van de Geer, S. (2018). Inference in high-dimensional graphical models. ArXiv:1801.08512 [Math, Stat]. Retrieved from
http://arxiv.org/abs/1801.08512
Jones, P. J., Ma, R., & McNally, R. J. (2017). Bridge cen-trality: A network approach to understanding comorbid-ity. Manuscript submitted for publication. Retrieved from https://osf.io/c5dkj/
Kaiser, T., & Laireiter, A. R. (2017). DynAMo: A Modular
Platform for Monitoring Process, Outcome, and Algo-rithm-Based Treatment Planning in Psychotherapy. JMIR
Medical Informatics, 5(3), e20.
https://doi.org/10.2196/medinform.6808
Kaiser, T., & Laireiter, A.-R. (2018). Daily dynamic as-sessment and modelling of intersession processes in am-bulatory psychotherapy: A proof of concept study. Psy-chotherapy Research, 1–12.
https://doi.org/10.1080/10503307.2018.1497213 Kaiser, T., Schmutzhart, L., & Laireiter, A.-R. (2018).
Atti-tudes of Austrian Psychotherapists Towards Process and Outcome Monitoring. Administration and Policy in Mental Health and Mental Health Services Research, 1–15. https://doi.org/10.1007/s10488-018-0862-1 Knappe, S., Klotsche, J., Heyde, F., Hiob, S., Siegert, J.,
Hoyer, J., … Beesdo-Baum, K. (2014). Test–retest relia-bility and sensitivity to change of the dimensional anxi-ety scales for DSM-5. CNS Spectrums, 19(03), 256–267. https://doi.org/10.1017/S1092852913000710
Kroenke, K., Spitzer, R. L., Williams, J. B. W., Monahan, P. O., & Löwe, B. (2007). Anxiety Disorders in Primary Care: Prevalence, Impairment, Comorbidity, and Detec-tion. Annals of Internal Medicine, 146(5), 317.
https://doi.org/10.7326/0003-4819-146-5-200703060-00 004
Kroeze, R., van der Veen, D. C., Servaas, M. N., Bastiaan-sen, J. A., Voshaar, R. C. O., Borsboom, D., … Riese, H. (2017). Personalized Feedback on Symptom Dynamics of Psychopathology: A Proof-of-Principle Study. Journal for Person-Oriented Research, 3(1), 1–10.
https://doi.org/10.17505/jpor.2017.01
Kwiatkowski, D., Phillips, P. C., Schmidt, P., & Shin, Y. (1992). Testing the null hypothesis of stationarity against the alternative of a unit root: How sure are we that eco-nomic time series have a unit root? Journal of Econo-metrics, 54(1–3), 159–178.
Maier, W., Buller, R., Philipp, M., & Heuser, I. (1988). The Hamilton Anxiety Scale: reliability, validity and sensitiv-ity to change in anxiety and depressive disorders. Jour-nal of Affective Disorders, 14(1), 61–68.
https://doi.org/10.1016/0165-0327(88)90072-9
Maier, W., Philipp, M., & Gerken, A. (1985). Dimensionen der Hamilton-Depressionsskala (HAMD): Faktorenana-lytische Untersuchungen. European Archives of Psychia-try and Neurological Sciences, 234(6), 417–422. https://doi.org/10.1007/BF00386061
Margraf, J. (2013). Mini-DIPS: Diagnostisches
Kurz-Interview bei psychischen Störungen. Berlin, Hei-delberg: Springer-Verlag.
Maurer, G., Aichhorn, M., Leeb, W., Matschi, B., & Schiepek, G. (2010). Real-time monitoring in psychothe-rapy - methodology and casuistics. Neuropsychiatrie : Klinik, Diagnostik, Therapie und Rehabilitation : Organ der Gesellschaft Osterreichischer Nervenarzte und Psy-chiater, 25(3), 135–141.
Molenaar, P. C. (1985). A dynamic factor model for the analysis of multivariate time series. Psychometrika,
62 50(2), 181–202. https://doi.org/10.1007/BF02294246 Molenaar, P. C., & Campbell, C. G. (2009). The New
Per-son-Specific Paradigm. Retrieved from http://www.jstor.org/stable/pdf/20696008.pdf
Molenaar, P. C. M. (2004). A Manifesto on Psychology as Idiographic Science: Bringing the Person Back Into Sci-entific Psychology, This Time Forever. Measurement: Interdisciplinary Research and Perspectives, 2(4), 201–218. https://doi.org/10.1207/s15366359mea0204_1 Molenaar, P. C. M. (2013). On the necessity to use
per-son-specific data analysis approaches in psychology. European Journal of Developmental Psychology, 10(1), 29–39. https://doi.org/10.1080/17405629.2012.747435 Orlinsky, D. E., Geller, J. D., Tarragona, M., & Farber, B. (1993). Patients’ representations of psychotherapy: A new focus for psychodynamic research. Journal of Con-sulting and Clinical Psychology, 61(4), 596–610. https://doi.org/10.1037/0022-006X.61.4.596
Orlinsky, D. E., & Tarragona, M. (1986). Intersession Ex-perience Questionnaire (Patient Form). Chicago: Uni-versity of Chicago Committee on Human Development. Schiepek, G., Aichhorn, W., Gruber, M., Strunk, G., Bachler,
E., & Aas, B. (2016). Real-Time Monitoring of Psycho-therapeutic Processes: Concept and Compliance. Fron-tiers in Psychology, 7.
https://doi.org/10.3389/fpsyg.2016.00604 Schiepek, G., Eckert, H., Kravanja, B., Wallot, S., &
Haussmann, A. (2014). Integrative Psychotherapy-A Feedback-Driven Dynamic Systems Approach. Göttingen: Hogrefe.
Schiepek, G. K., Viol, K., Aichhorn, W., Hütt, M.-T., Sun-gler, K., Pincus, D., & Schöller, H. J. (2017).
Psycho-therapy Is Chaotic—(Not Only) in a Computational World. Frontiers in Psychology, 8.
https://doi.org/10.3389/fpsyg.2017.00379
Schröder, T., Wiseman, H., & Orlinsky, D. (2009). “You were always on my mind”: Therapists’ intersession expe-riences in relation to their therapeutic practice, profes-sional characteristics, and quality of life. Psychotherapy Research, 19(1), 42–53.
https://doi.org/10.1080/10503300802326053
Smith, P. L., & Little, D. R. (2018). Small is beautiful: In defense of the small design. Psychonomic Bulletin & Re-view, 1–19. https://doi.org/10.3758/s13423-018-1451-8 Spitzer, R. L., Kroenke, K., Williams, J. B., & Löwe, B.
(2006). A brief measure for assessing generalized anxiety disorder: the GAD-7. Archives of Internal Medicine, 166(10), 1092–1097. doi:10.1001/archinte.166.10.1092
Stewart, S., & Schroder, T. (2015). Emotional homework: A systematic literature review of patients’ intersession ex-periences. Journal of Psychotherapy Integration, 25(3), 236–252. https://doi.org/10.1037/a0039639
Zeeck, A., Hartmann, A., Wild, B., De Zwaan, M., Herpertz, S., Burgmer, M., … The Antop Study Group. (2016). How do patients with anorexia nervosa “process” psy-chotherapy between sessions? A comparison of cogni-tive–behavioral and psychodynamic interventions. Psy-chotherapy Research, 1–14.
https://doi.org/10.1080/10503307.2016.1252866
Zeeck, Almut, & Hartmann, A. (2005). Relating therapeutic process to outcome: are there predictors for the
short-term course in anorexic patients? European Eating Disorders Review, 13(4), 245–254.