Campaigns and seasonality’s effect on
the batch size
Authors Linda Rundqwist
Karolina Skog
University supervisors Peter Berling, Lund University –Faculty of Engineering
Fredrik Ödegaard, Lund University –Faculty of Engineering
II
Abstract
Title Campaigns and seasonality´s effect on batch size
Authors Linda Rundqwist and Karolina Skog
Supervisors Peter Berling, Henrik Rosdahl and Fredrik Ödegaard
Background The Nordic headquarter at Campbell Soup has been commissioned by the management to
review their inventories and to asses’ optimal inventory levels under the prerequisite to still achieve agreed customer service levels and not get higher total costs. The capital tied is believed to be too high, therefore Campbell Soup wants to lower their inventory levels.
Purpose The purpose of this study is to do an extensive research resulting in long term suggestions on feasible batch sizes which are affected by campaigns and seasonality. The outcome of the study will be suggestions on how to lower the capital tied, while adhering to agreed customer service levels and looking at the total costs.
Method Ten bouillons within the group Bong Dry Bouillon produced at the production line 102 were investigated. The data for the study was collected by interviews, direct observations and by collecting quantitative and qualitative data. The methodical view used was the analytical view.
Analysis The theories presented in the thesis were used to construct two models of the production and inventory of finished products of one year. The first one, called Current Situation Model, was based on real data and was used as a validation tool for the second model called Cost Analysis Model. In the Cost Analysis Model a distribution function was used to simulate a random stochastic demand and the Current Situation Model was used to validate if the chosen distribution function was good enough. Different scenarios were analyzed with the Cost Analysis Model to investigate the batch sizes sensitivity to different changes. With the Cost Analysis Model a batch size for each investigated product could be determined, which fulfills the case fill rate and has the lowest total varying cost.
Conclusion Campbell Soup Nordic has very low inventory costs in comparison to the setup costs and manufacturing costs. It means it is more profitable for Campbell Soup Nordic, with regards to the summation of the varying costs depending on volume, to produce in larger batches for the products with high turn-over. The products with low turn-over should on the other hand be produced in smaller batches. If Campbell Soup Nordic wants to fulfill the gold standard of the service level in case fill rate they should continue with a safety time of two weeks. They should do this since a shorter safety time gives more lost sales which leads to not being able to fulfill the gold standard of a case fill rate of 99%.
III
Product Current batch size (SU) Current Varying costs (SEK) Recommended batch size (SU) Recommended batch Varying costs (SEK) Savings (SEK/year) Nbr of pallets
4900 194 37101 385 30963 6137 5,35 4901 239 18444 338 17288 1155 4,69 4902 195 6862 195 6862 0 2,71 4903 266 18966 479 16959 2007 6,65 4904 219 39340 448 33311 6029 6,22 4906 736 48458 1507 44777 3681 9,42 4907 657 35700 1223 33099 2601 7,64 4908 873 41822 1582 39420 2402 9,89 4909 969 33124 1745 31374 1750 10,91 4910 911 14258 813 14199 59 5,08
Keywords Batch size, campaign, case fill rate, gamma-distribution, holding cost, manufacturing cost, seasonality, setup cost and simulation model.
IV
Preface
This master thesis is written at the Department of Production Management at the Faculty of Engineering of Lund University in Sweden. This master thesis is the concluding part of the authors´ Master of Science in Mechanical Engineering with a focus on Production Management and Engineering Logistics. The study was performed in cooperation with Campbell Soup Nordic, recently acquired and in the future known as Continental Foods. Working with the master thesis has given us an opportunity to implement our theoretical knowledge at a traditional manufacturing company and has been a great learning experience. We are particularly grateful for the assistance given by our supervisors Fredrik Ödegaard and Peter Berling at the department of Production Management. They have supported us during the master thesis and have given us constructive feedback that helped us to improve the outcome of this thesis. Further, we would like to take the opportunity to thank the employees at Campbell Soup Nordic, for their time and good attitude. Especially thanks to Henrik Rosdahl, Agneta Frisk, Josefine Johansson, Torgny Holmström, Johan Nilsson, Mona Ljungberg, Stefan Lundh and Pontus Sturk, who made the extra effort to provide us with data and information about the company.
Finally we would like to thank the people around us, especially family and friends that have supported us during our education.
Lund, January 16 2014
V
Table of Contents
Abstract ... II Preface ... IV 1 Introduction ... 1 1.1 Background ... 1 1.2 Problem definition ... 1 1.3 Purpose ... 21.4 Delimitations and focus area ... 2
1.5 Targets and objectives ... 2
1.6 Roles ... 3
1.7 Interested parties ... 3
1.8 Disposition of the study ... 3
1.8.1 Chapter 1: Introduction ... 3 1.8.2 Chapter 2: Methodology ... 3 1.8.3 Chapter 3: Theory ... 3 1.8.4 Chapter 4: Empery ... 3 1.8.5 Chapter 5: Analysis ... 3 1.8.6 Chapter 6: Result ... 3 1.8.7 Chapter 7: Conclusion ... 3 2 Methodology ... 4 2.1 Research process ... 4 2.2 Problem Identification ... 4 2.3 Methodological Views ... 4
2.3.1 The analytical view ... 4
2.3.2 The system view ... 5
2.3.3 The actors view ... 5
2.3.4 The view of the research ... 5
2.4 Data collection and literature ... 6
2.4.1 Data collection ... 6
2.4.2 Quantitative and qualitative ... 6
2.4.3 Interviews ... 7
2.4.4 Direct observations ... 8
VI
2.6 The study process ... 8
3 Theory ... 10
3.1 Total Cost Concept ... 10
3.2 Inventory ... 11
3.2.1 Cycle stock ... 11
3.2.2 In-transit Inventories ... 11
3.2.3 Speculative stock ... 11
3.2.4 Safety stock or Buffer Stock ... 11
3.2.5 Seasonal stock ... 11
3.2.6 Dead stock ... 12
3.2.6 The purpose of having inventory ... 12
3.3 Inventory costs ... 13
3.3.1 Holding costs ... 13
3.3.2 Insurance ... 14
3.3.3 Obsolescence ... 14
3.3.4 Reasons for lowering the inventory ... 15
3.4 Service level ... 15
3.5 Order Costs ... 15
3.6 Setup costs ... 16
3.7 Lot quantity Costs ... 16
3.7.1 MTS ... 16
3.8 SMED ... 16
3.8.1 Reduce the support activities from the critical flow ... 17
3.9 Trade-offs ... 17
3.10 Lost sales and stock out costs ... 19
3.10.1 Constraints... 19
3.11 The Bullwhip Effect ... 20
3.11.1 Sources for the Bullwhip Effect ... 20
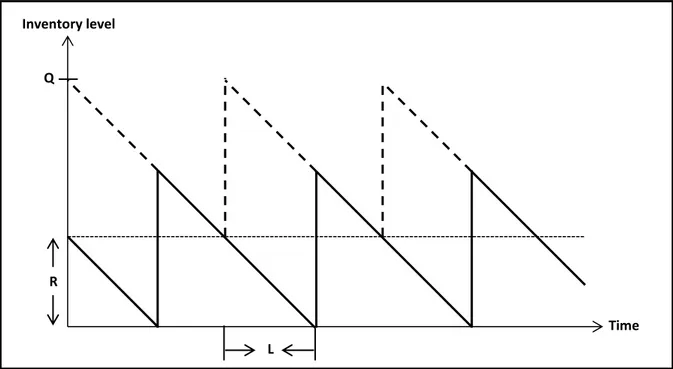
3.12 (R, Q)- Policy with continuous review ... 21
3.13 Probability Density Function ... 22
3.14 Cumulative Distribution Function ... 23
VII
3.16 The right supply chain for different products ... 23
3.16.1 Gamma ... 24
3.16.2 Usability of the gamma distribution in inventory control ... 24
3.17 Software ... 25
SAP ... 25
Easy Fit Professional 5.5 ... 25
4 Empiri... 26
4.1 Campbell Soup Nordic ... 26
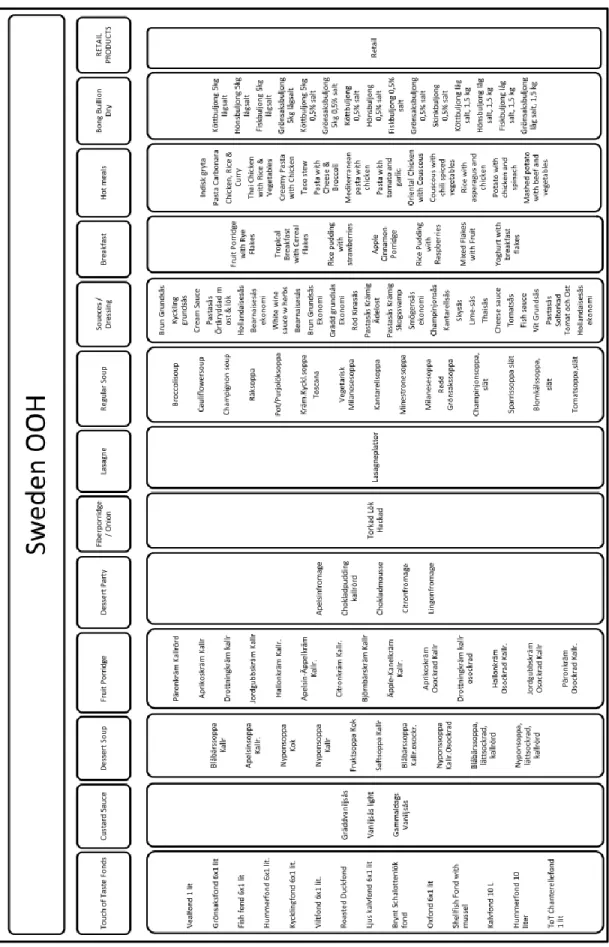
4.2 The complexity of the OOH-products manufactured at Karpalund ... 27
4.2.1 Campaigns of OOH-products ... 29
4.2.2 Seasonality of OOH-products ... 31
4.2.3 Different OOH-products in Sweden verses Finland ... 31
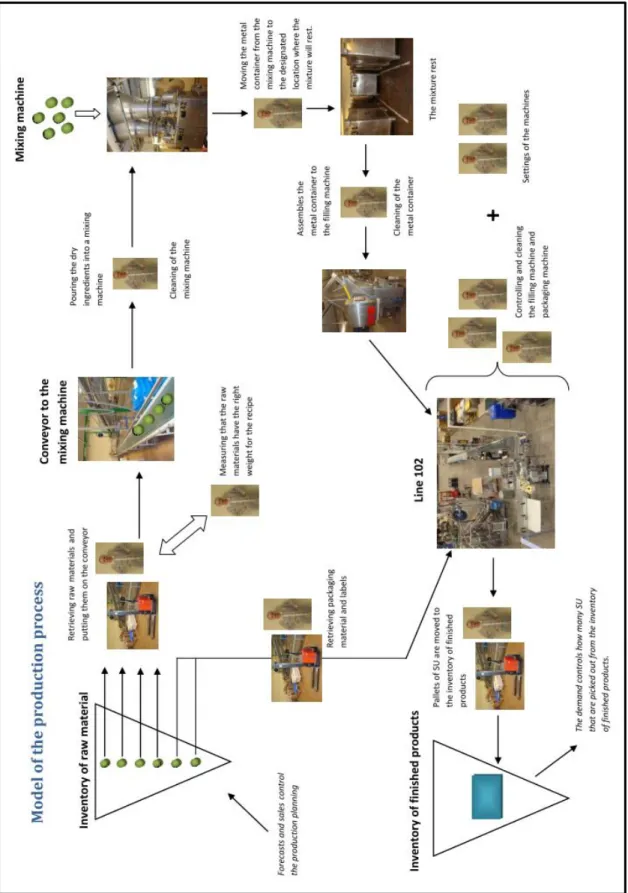
4.3 The production process ... 32
4.4 The inventory control ... 35
4.4.1 Safety time... 35 4.4.2 Order quantity ... 35 4.4.3 Forecast model ... 35 4.5 Service level ... 36 4.6 Sales ... 36 4.7 Lost Sales ... 37 4.8 Holding costs ... 38 4.9 Order Costs ... 39 4.10 Scrapped products ... 39 5 Analysis ... 40
5.1 Construction of the analytical models... 40
5.1.1 Conceptual Models ... 40
5.1.2 Implementation in Excel ... 45
5.2 Analysis method ... 56
5.2.1 Sensitivity Analysis ... 56
5.2.2 Products that were used in the sensitivity analysis ... 59
6 Results ... 60
VIII
6.2 Result of Sensitivity Analysis ... 63
6.3 Recommended batch size ... 65
7 Conclusions ... 67
7.1 The purpose and objective of the master thesis ... 67
7.2 Conclusion of the result... 67
7.2.1 Conclusion of the result of the validation ... 67
7.2.2 Conclusion of the result of the sensitivity analysis ... 68
7.2.3 Recommended batch sizes ... 69
7.2.4 Profitability for smaller batch sizes ... 69
7.3 The correlation of the result and the purpose and objective of the master thesis ... 71
7.4 Final recommendations for further studies at Campbell Soup Nordic ... 71
7.4.1 Upgrade Microsoft Excel ... 71
7.4.2 Use a simulation program ... 71
7.4.3 Analyze bought sales data ... 72
7.4.4 Determine order costs ... 72
7.4.5 Determine insurance cost per sales unit ... 72
7.4.6 Investigate the purchasing of Raw Material... 72
7.5 Recommendation for the Daily operations at Campbell Soup Nordic ... 72
7.5.1 Take responsibility for learning SAP ... 72
7.5.2 Work with ABC-analysis ... 73
7.5.3 Collaborate with the distributors ... 73
7.5.4 Reduce workload for the Plant & Logistics Controller ... 73
7.5.5 Structured meetings ... 74
7.6 Final conclusion of the study ... 74
References ... 75 Literature ... 75 Articles ... 76 Reports ... 76 Interviews ... 76 Homepages ... 77 Other ... 77 Appendix 1 ... 78
IX
Campaigns for product 4900 ... 78
Campaigns for product 4901 ... 78
Campaigns for product 4902 ... 79
Campaigns for product 4903 ... 80
Campaigns for product 4904 ... 80
Campaigns for product 4906 ... 81
Campaigns for product 4907 ... 82
Campaigns for product 4908 ... 82
Campaigns for product 4909 ... 83
Campaigns for product 4909 ... 84
Appendix 2 ... 85
Appendix 3 ... 86
Appendix 4 ... 87
Appendix 5 ... 91
Unexpected increasing of sales during campaigns ... 91
Increasing of the Cost of Capital ... 92
One less machine operator at line 102 ... 94
Decreasing of the machine costs ... 95
Increasing of the material costs ... 96
Different safety times for the inventory of finished products ... 98
X
List of figures
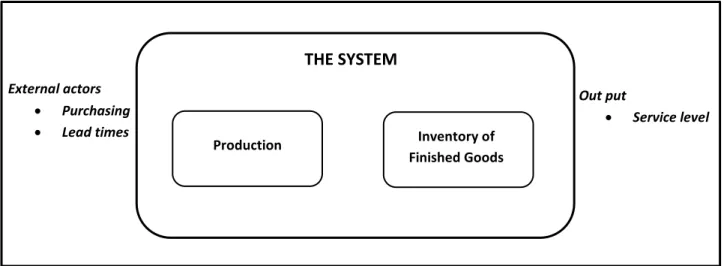
Figure 1: The system of the study and its external factors and out puts ... 5
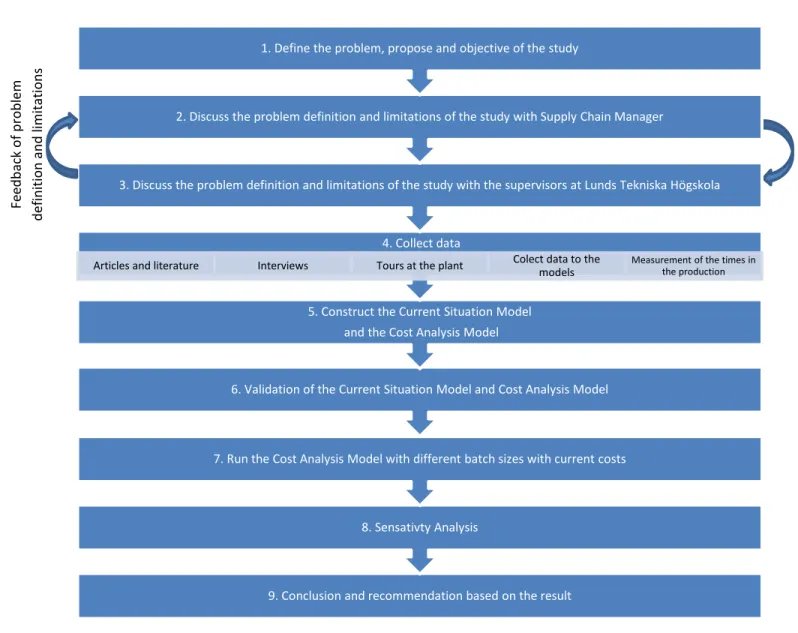
Figure 2: The study process of the master thesis ... 9
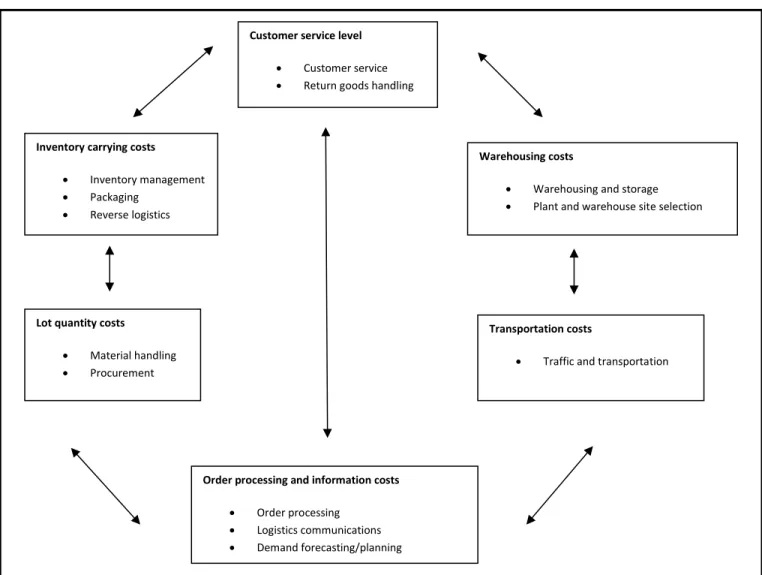
Figure 3: How logistics activities drive total costs ... 10
Figure 4: The relationship between delivery precision, throughput and resource utilization ... 12
Figure 5: The change of inventory level over time in a continuous review system ... 22
Figure 6: The sites of Campbell Soup in Europe ... 26
Figure 7: The product range of Swedish out-of-home products ... 28
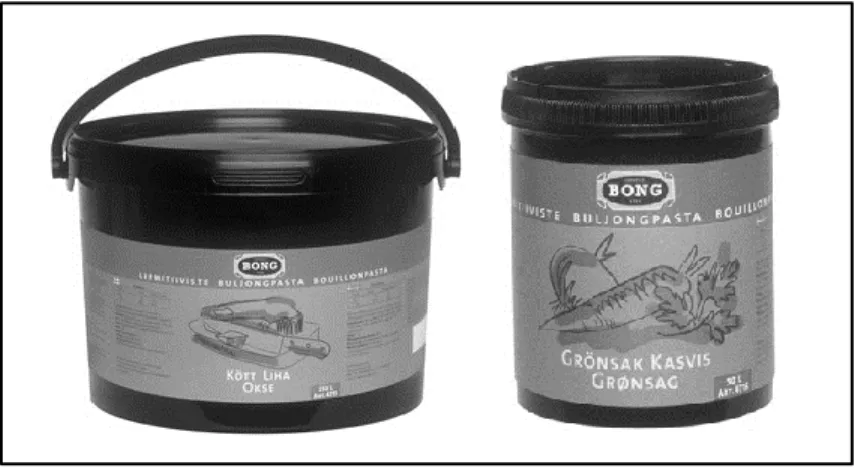
Figure 8: OOH-products in buckets for the Swedish market... 32
Figure 9: The production process ... 34
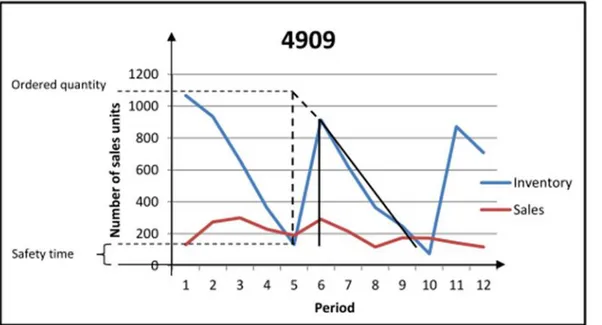
Figure 10: The inventory control of 4909 in the fiscal year 2013 ... 35
Figure 11: When the production occurs for an out-of-home product ... 44
Figure 12: The Current Situation Model for product 4903, fiscal year 2013 ... 46
Figure 13: Campbell Soup Nordic’s period classifications ... 47
Figure 14: Matrix of the products ... 59
List of tables
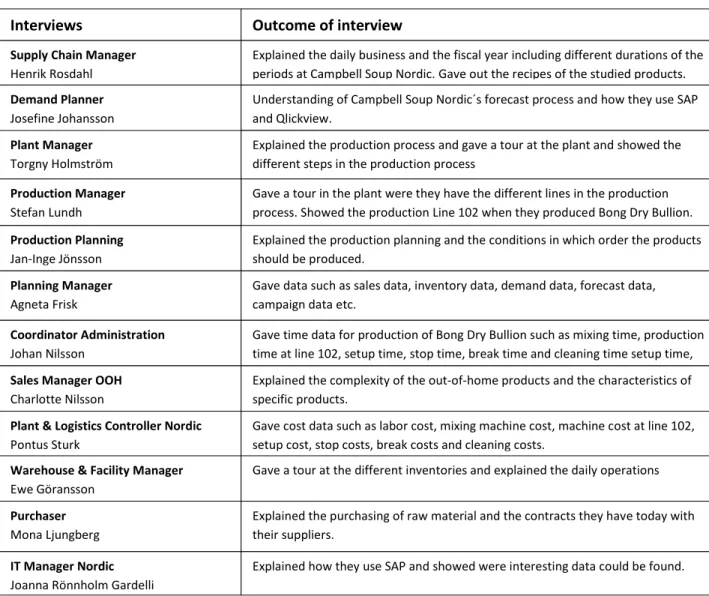
Table 1: Optimal batch sizes for setup time of 30min and two mechanics ... III Table 2: The interviewed employees at Campbell Soup Nordic and the outcomes of the interviews. ... 7Table 3: The lost sales of the fiscal year 2013 ... 38
Table 4: Scrapped products of the fiscal years F12 and F13 ... 39
Table 5: The maximum and minimum allowed batch sizes ... 41
Table 6: The result of which gamma distribution that has best ranking ... 42
Table 7: The parameters that is recommended for each distribution ... 42
Table 8: Different scenarios that were investigated in the sensitivity analysis ... 59
Table 9: The validation result for product 4900 ... 60
Table 10: The validation result for product 4901 ... 60
Table 11: The validation result for product 4902 ... 61
Table 12: The validation result for product 4903 ... 61
Table 13: The validation result for product 4904 ... 61
Table 14: The validation result for product 4906 ... 61
Table 15: The validation result for product 4907 ... 62
Table 16: The validation result for product 4908 ... 62
Table 17: The validation result for product 4909 ... 62
Table 18: The validation result for product 4910 ... 62
Table 19: Symbol for each product in the sensitivity analysis ... 63
Table 20: The range of investigated batch sizes in sales units (SU) ... 63
Table 21: Recommendation of batch size if the varying cost is as low as possible ... 63
Table 22: The scenarios that affect the Case Fill Rate ... 64
Table 23: Recommendation of batch size with a Case Fill Rate of 99% and lowest varying cost ... 64
XI
Table 25: Recommended batch size with a setup time of 18 min and fulfilled Case Fill Rate of 99 % ... 65
Table 26: Optimal batch size for optimal production conditions ... 65
Table 27: Optimal batch sizes for optimal production conditions and full pallets ... 66
Table 28: Optimal batch sizes for a setup time of 30min and two mechanics ... 66
Table 29: Optimal batch sizes for full pallets with a setup time of 30min and two mechanics ... 66
Table 30: The lost sales for the fiscal year 2011 ... 85
Table 31: The lost sales for the fiscal year 2012 ... 85
1
1 Introduction
This chapter describes and introduces the background of Campbell Soup. It also presents the problem definition, purpose, targets and objectives of the study.
1.1 Background
Campbell Soup Company was founded 1869 in the United States. Today Campbell Soup is an inter-national company with 22,000 employees and a turnover of SEK 53 billion. Campbell Soup’s products are bouillons, soups, sauces which are sold in more than 100 countries worldwide. Some of the brands that are included in Campbell Soup Company are Campbell’s, Bong, Blå Band, Varma Koppen and Touch of Taste. In Europe, Campbell Soup has businesses in Belgium, Finland, France, Germany and Sweden. The Nordic headquarter is located in Kristianstad, Sweden, and it is responsible for the supply of Campbell Soup’s products in the Nordic countries.
The Nordic headquarter has been commissioned by the management to review their inventory levels for packaging material, raw material and finished products and to assess optimal inventory levels under the prerequisite to still achieve agreed customer service levels. Today, they use two different safety time parameters: one for retail products and one for out-of-home products. Campbell Soup Nordic is in need of a tool to calculate unique safety time levels for each product, without negatively affecting the service level. Furthermore they are currently producing all products against forecast and they have permanent safety time levels for all their products.
1.2 Problem definition
Nowadays many companies are interested in how they should handle their inventories. Inventory is seen as something driving up costs and therefore should be avoided. The capital tied is believed to be too high, therefore Campbell Soup wants to lower their inventory levels. Consequently Campbell Soup wants to lower their costs by finding a tool to calculate more appropriate inventory levels. They also want to investigate production planning principle such as batch sizes and how many times the product should be produced per year. Campbell Soup also wants to divide the different products in different groups and adapt different safety time policies for them. Currently they have the same safety time for all of their out-of-home products.
The tool should be able to take the changing demand during different seasons and campaigns into consideration. The main challenge is to find the tradeoff between low inventory levels and still keep a high service level without increasing the total cost.
A simulation model of Campbell´s production, line 102, which produces out-of-home products that are sold to restaurants and the public sector, will be constructed in Excel 2010. A model of the current situation with data from previous years will be used as a validation tool for the simulation model of the production process of line 102. The cost of the finished goods inventory will also be investigated.
2
A sensitivity analysis is an analysis on how different factors affect the total cost of the production and inventory. With the simulation model a sensitivity analysis will be executed with different scenarios. The different scenarios are:
Unexpected sales during campaigns
Decreasing one machine operator at line 102
Decreasing machine costs for the mixing machine and machines at production line 102
Increasing the safety time
Decreasing the safety time
Increasing setup times and taking the mechanics into consideration
The results of the sensitivity analysis will lead to suggestions on new batch sizes and safety times with the production process’s limitation taken into consideration.
1.3 Purpose
The purpose of this study is to do an extensive research resulting in long term suggestions on feasible batch sizes. The outcome of the study will be suggestions on how to lower the capital tied, while adhering to agreed customer service levels and looking at the total costs.
1.4 Delimitations and focus area
The following delimitations and focus areas are determined keeping in mind the limited time frame and the broad scope of the study.
The study will only consider the Nordic part of Campbell Soup. The tool for calculating the inventory levels will evaluate the variable costs of some carefully chosen products which are sold and produced in Sweden. The products are picked from the production line 102 that produces out-of-home products within the group Bong Dry Bouillon1. In this product group fast-, medium- and slow mover products will be examined. The products examined are selected from established products that have been on the mar-ket at minimum of five years and products that are/or will be delisted will not be investigated.
It is assumed that the purchasing of raw materials is working very well and that raw materials always are available for the production. The process for forecasts and campaigns are assumed to be correct and will not be analyzed. The study will only consider the production and finished goods inventory. The interest rates and machine costs given by the finance department are considered to be correct. There are no customer data available for an analysis of lost sales therefore the authors decided to perceive the products that could not be delivered as lost sales.
1.5 Targets and objectives
The target and objective of this study is to find suggestions on how to lower the inventory levels and capital tied for Campbell Soup products without lowering the customer service level measured in case fill rate or increasing the total cost.
1The products studied are bullions and have the following part numbers: 4900,
3
1.6 Roles
The authors will assist the supply chain team at Campbell Soup Nordic to try to find a solution to lower their inventory and capital tied. The role of the authors is to contribute their knowledge in inventory management, production economics and logistic and produce suggestions on improvements for the Supply Chain department at Campbell Soup Nordic.
1.7 Interested parties
The concerned parties of this study are employees at Campbell Soup were the Supply Chain department is the key audience. This study also targets engineering students with knowledge within the field of production economics, logistics and with a profound interest of inventory control.
1.8 Disposition of the study
The disposition and objective of each chapter is presented below to guide the reader through the study.
1.8.1 Chapter 1: Introduction
The first chapter will introduce the reader to the background, purpose, target, objective, delimitations, roles and stakeholders of the study.
1.8.2 Chapter 2: Methodology
The second chapter presents the methods used in the study.
1.8.3 Chapter 3: Theory
The third chapter presents theories that are relevant to the study and the background of the construction of the models in the study.
1.8.4 Chapter 4: Empery
The fourth chapter presents the company Campbell Soup Nordic´s out-of-home products and business. The aim is to introduce the reader to the company and provide an understanding of the company’s condition and limitations.
1.8.5 Chapter 5: Analysis
The fifth chapter presents the analysis tools. Two models have been constructed to investigate the batch sizes impact on the different costs varying with the volume. The models are called Current Situation Model and Cost Analysis Model. The Current Situation Model will be a validation tool for the Cost Analysis Model. In this chapter a sensitivity analysis is presented to investigate the different batches sensitivity in different scenarios.
1.8.6 Chapter 6: Result
The sixth chapter presents the result of the validation and sensitivity analysis. The chapter will also pre-sent final recommendations of batch sizes for the different products.
1.8.7 Chapter 7: Conclusion
The seventh chapter discusses the result and findings of the validation and sensitivity analyses. It will also discuss how well the purpose of the master thesis was fulfilled. Final recommendations will be given to Campbell Soup Nordic describing how they should continue with the investigation and suggestions on how to further improve their business.
4
2 Methodology
The chapter will present the theoretical foundation of the methodology approach. This includes the research methods and data collection techniques used in the study. The methods were selected by analyzing which methods were best suited for the given data and would give credible results. This chapter aims at giving a better understanding on how the results were analyzed and executed.
2.1 Research process
The research process of the study started with investigating and mapping the current situation and its difficulties, ending with trying to pinpoint the most important difficulty. Then a model was built to simulate the current situation and finds ways to improve it.
2.2 Problem Identification
The problem identification was determined by discussions and interviews with the Supply Chain Manager at Campbell Soup Nordic. Interviews were also held with other employees familiar with the difficulties in the supply chain and more importantly the inventory control. The most important problem identified, was then broken down and delimited to a feasible problem. Discussing with different key employees in the supply chain gave an overview of the different opinions of the problem, and what people thought could be the root cause for it. It also gave a hint as to who had the information that could be useful when trying to analyze it. The problem was then mapped to get a better idea of how to address it and subsequently help identify the focus areas and the theory and literature needed to solve it.
2.3 Methodological Views
There are different methodological views that will be described and they are based on different assumptions and concepts.
2.3.1 The analytical view
The analytical view is based on the notion that the reality is known and that the observations are inde-pendent of the observer. There are objective and subjective facts which both are considered to be true. The objective facts are circumstances which are not influenced by opinions and are therefore considered indisputable. When using an analytic approach, elements like things, events and opinions have to be consistent in spite of changes in the environment and variations in perceptions among different individuals. Logic and mathematics are naturally the most common tools when using an analytical approach.
The objective in an analytical approach is to create a model of the problem which shares the characteristics of the total system. These models should be valid for more than one case in real life. An assumption in the analytical view is that the reality is seen as a sum of different parts that are known and can be summated to solve the problem. The analytical view tends to contain quantitative elements2.
2Arbnor, Ingeman & Bjerke, Björn, Företagsekonomisk metodlära, 2., [omarb. och utök.] uppl.,
5
2.3.2 The system view
The system view sees all phenomena as a web of relationships among its components which can be described as a system. The approach assumes systems have common patterns, properties and behaviors which can be better understood when analyzing the whole system. This system approach is different from the analytical approach which considers the observations as individual instead of interacting and dependent on each other as described in the system approach. The basic idea is that the whole not always can be known from an analysis of its components in isolation3.
2.3.3 The actors view
In the actors view the reality is presumed to be a social construction which is affected and influenced by the actors in a specific situation. The reality is constantly changing with the actors in it. The knowledge is dependent on the actors and how they experience and interpret the reality. Studies that use this view are more dependent on the involved people in the process than studies that use the analytical and system approaches4.
2.3.4 The view of the research
During this study a combination of an analytical and system view was used. Both approaches were needed to fully understand the process of the supply chain. An analytical view was used when analyzing the data. Measurements on costs and the production process were made and analyzed to find patterns and a way to estimate a good way to simulate the demand and how it varies during campaigns. The different costs were measured to find the most optimal batch sizes for Campbell Soup Nordic. At the same time it was important to have interviews with the people working with the processes and data to understand how they were measured. There were also unavailable data were estimations had to be
3Arbnor, Ingeman & Bjerke, Björn, Företagsekonomisk metodlära, 2., [omarb. och utök.] uppl.,
Studentlitteratur, Lund, 1994, p.102
4Arbnor, Ingeman & Bjerke, Björn, Företagsekonomisk metodlära, 2., [omarb. och utök.] uppl.,
Studentlitteratur, Lund, 1994, p.131 External actors Purchasing Lead times Production Inventory of Finished Goods Out put Service level
THE SYSTEM
6
made. These estimations were discussed with the people involved to come up with valid estimations. The system analyzed included the production and the finished goods warehouse.
2.4 Data collection and literature
Different data collections should be used in different studies. The way the data is collected, emerge and what data that is available strongly influence how the study will be executed. With Campbell Soup Nordic´s situation clearer it was necessary to deepen the understanding to find ways to improve it. To get a comprehensive view of the problem the use of literature applicable to the subject were examined. This was done by researching different literature, dissertations, academic research papers, articles and textbooks to find theories, ideas and models. Research on closely related problems was also studied to find suggestions on appropriate approaches for this study.
2.4.1 Data collection
Data can be primary or secondary depending on how it is gathered. Primary data is data that has been assembled for the purpose of a specific study. Secondary data is data that has been gathered for another purpose. While handling secondary data it is important to considerer that it might be biased and that the data has been intended for another purpose5. Primary data can be collected by questionnaires, inter-views and observations. Ways to collect secondary data are by collecting data through literature such as books and articles. Literature is advantageous since it is available at libraries and on the internet. However, finding the right literature can be time consuming depending on what is researched and how much has been explored in the specific area.
In this study primary data was gathered from interviews with different employees and observations in the production but also by collecting statistics from SAP. Secondary data was collected by using different literature and studies on closely related studies. Secondary data was also used from other investigations that Campbell Soup Nordic has made in the past.
2.4.2 Quantitative and qualitative
There are two kinds of studies. There is the quantitative and the qualitative study. Quantitative studies are in general aligned with the analytical approach. The qualitative studies are mostly used using the system and actors approach with in-depth interviews as to understand a person’s inner thoughts and feelings about an entity. If the data and information can be measured and evaluated numerically it is quantitative. Although not everything can be measured then qualitative data can be used. Qualitative studies are used when a deeper understanding for a specific problem is needed. However the possibility to generalize from qualitative studies is lower and sometimes impossible. A research which is built upon quantifiable data and measurable data can be generalized and are often presented as statistics6.
5Björklund, Maria & Paulsson, Ulf, Seminarieboken: att skriva, presentera och opponera, 2. uppl.,
Studentlitteratur, Lund, 2012, p.69.
6Björklund, Maria & Paulsson, Ulf, Seminarieboken: att skriva, presentera och opponera, 2. uppl.,
7
2.4.3 Interviews
Interview is a good way to acquire primary data and is commonly used in the system and actor approach. The interviews can be executed in four different ways and they are personal interviews, telephone interviews, surveys and group surveys. During the study the preferred technique was personal interviews. The personal interview has a face to face setup with personal interaction with the researcher and the person being interviewed. Depending on how much preparation an interview needs it is structured, semi-structured or none structured. During the study semi-structured interviews were used which gave those interviewed a possibility to answer the questions asked as how they found fit7. The interviews were held with different key personnel involved in the production and the supply chain. The interviews took between 40 minutes to an hour to conduct. The interviews helped the authors understand who had the data and know how to help with gathering the needed data for the analysis and also understand the whole process of the supply chain and its limitations8.
7Trost, Jan. (2010), Kvalitativa intervjuer. (4:e uppl.). Lund: Studentlitteratur.
8Björklund, Maria & Paulsson, Ulf, Seminarieboken: att skriva, presentera och opponera, 2. uppl., Studentlitteratur, Lund, 2012, p.70.
Interviews
Supply Chain Manager
Henrik Rosdahl Demand Planner Josefine Johansson Plant Manager Torgny Holmström Production Planning Jan-Inge Jönsson Planning Manager Agneta Frisk Coordinator Administration Johan Nilsson
Sales Manager OOH
Charlotte Nilsson
Plant & Logistics Controller Nordic
Pontus Sturk
Warehouse & Facility Manager
Ewe Göransson
Purchaser
Mona Ljungberg
IT Manager Nordic
Joanna Rönnholm Gardelli
Outcome of interview
Explained the daily business and the fiscal year including different durations of the periods at Campbell Soup Nordic. Gave out the recipes of the studied products. Understanding of Campbell Soup Nordic´s forecast process and how they use SAP and Qlickview.
Explained the production process and gave a tour at the plant and showed the different steps in the production process
Gave a tour in the plant were they have the different lines in the production process. Showed the production Line 102 when they produced Bong Dry Bullion. Explained the production planning and the conditions in which order the products should be produced.
Gave data such as sales data, inventory data, demand data, forecast data, campaign data etc.
Gave time data for production of Bong Dry Bullion such as mixing time, production time at line 102, setup time, stop time, break time and cleaning time setup time, Explained the complexity of the out-of-home products and the characteristics of specific products.
Gave cost data such as labor cost, mixing machine cost, machine cost at line 102, setup cost, stop costs, break costs and cleaning costs.
Gave a tour at the different inventories and explained the daily operations
Explained the purchasing of raw material and the contracts they have today with their suppliers.
Production Manager
Stefan Lundh
Explained how they use SAP and showed were interesting data could be found.
8
2.4.4 Direct observations
Direct observations are separated into four categories: participant observation, complete participant servation, slight participant observation and full observation. The categories are dependent on the ob-server’s interactions in the observation and that the people being observed knew that they were being observed.9 During the study the authors used full observation. The production process was observed to better understand what makes the production costs rise and to compare it with the description that had been given by the Production Manager and the Coordinator Administrator.
2.5 Credibility
A study is only credible if the findings and how the study was executed are fully explained. The reader should easily comprehend how the study was done and how the results were obtained. The study should be explained in a way that the readers could replicate the study or/and judge the credibility of the study. The credibility of a study can be measured in validity, reliability and objectivity10. The validity measures if the study has studied what it was intended to measure. A way to guarantee the validity of the study is to use more than one method to examine what is being studied. In this way several different perspectives is displayed.
This approach is called triangulation, and can also have several other people examine and determine if the material is valid11. Reliability is the degree of trustworthiness of the way the data has been measured. In other words if the study is repeated it should give the same results. The reliability also has to do with the trustworthiness of how the data has been collected and preventing and overseeing of random variation. Objectivity is to what extent the involved researcher’s values are affecting the study and the results. Therefore it is important to always motivate decisions and assumptions during the study. Ways to ensure the reader how the conclusions were reached and which sources the study draws on must be quoted so that the reader knows were the information came from. The credibility during this study was made by constructing and using a validation model to show that the constructed model lead to credible results. The authors also interview a lot of different people to get an objective opinion on the production process and its costs.
2.6 The study process
The figure below explains the process of the study. The first step was to define the problem, purpose and objective of the study. After the first step the decisions of how to do the limitations and how to define the problem in the study were made. The second and third steps of the study process were done simultaneously. It was important that both parties, Campbell Soup Nordic and Lunds Tekniska Högskola, were satisfied with the study’s objective and how the study was executed. During this process the introduction chapter was written. It was then approved by both parties.
First in the data collection articles and literature were read to give an understanding of the theories needed in the study. Thereafter the interviews with the employees at Campbell Soup Nordic and tours at
9Höst, Martin, Regnell, Björn & Runeson, Per, Att genomföra examensarbete, Studentlitteratur, Lund, 2006,
p.93.
10Höst, Martin, Regnell, Björn & Runeson, Per, Att genomföra examensarbete, Studentlitteratur, Lund, 2006,
p.109.
11Höst, Martin, Regnell, Björn & Runeson, Per, Att genomföra examensarbete, Studentlitteratur, Lund, 2006,
9
the plant were made. Data were collected for the models. Some data was gathered from SAP and some data were measured in production. The measurements in production were made to validate the given data. Some adjustments of the measurements were made during a consultation with the Coordinator Administrator12. When the data was collected the models, Current Situation Model and Cost Analysis Model, were constructed based on the theories and collected data.
In the sixth step of the study process the model was validated. Thereafter the Cost Analysis Model was used for a sensitivity analysis. The analysis was used to investigate the costs sensitivity of different batch sizes in different scenarios. Finally the results from the different simulations were discussed and recommendations based on the results were given to Campbell Soup Nordic.
12Nilsson, Johan 2013-12-17 Fe ed b ack o f p ro b le m d ef in itio n a n d lim ita tio n s
9. Conclusion and recommendation based on the result 8. Sensativty Analysis
7. Run the Cost Analysis Model with different batch sizes with current costs 6. Validation of the Current Situation Model and Cost Analysis Model
5. Construct the Current Situation Model and the Cost Analysis Model
4. Collect data
Articles and literature Interviews Tours at the plant Colect data to the models
Measurement of the times in the production
3. Discuss the problem definition and limitations of the study with the supervisors at Lunds Tekniska Högskola 2. Discuss the problem definition and limitations of the study with Supply Chain Manager
1. Define the problem, propose and objective of the study
10
3 Theory
This chapter contains the theory used in the study. The theories are used for calculating the optimal batch sizes and taking the right costs into consideration. The theories mentioned are mostly associated with inventory and production costs. The theories give a good description of the area investigated. The collection of theories will ensure the quality of the study and validate the results found in the analysis.
3.1 Total Cost Concept
The total cost concept is the best way for managing logistics. The goal is to look at the organization and try to reduce total cost rather than focusing on each activity in isolation. Reducing costs at one activity may drive up costs in other areas. Management should consider all the costs shown in Figure 313. The six cost categories are the key logistics activities that drive the major logistics costs14.
13Figure based on Grant, David B., Fundamentals of logistics management, European ed., McGraw-Hill
Education, Maidenhead, Berkshire, 2006, p.149.
14Grant, David B., Fundamentals of logistics management, European ed., McGraw-Hill Education,
Maidenhead, Berkshire, 2006, p.149.
Customer service level Customer service Return goods handling
Inventory carrying costs Inventory management Packaging
Reverse logistics
Lot quantity costs
Material handling Procurement
Warehousing costs
Warehousing and storage Plant and warehouse site selection
Order processing and information costs Order processing
Logistics communications Demand forecasting/planning
Transportation costs
Traffic and transportation
11
3.2 Inventory
Nowadays a lot of people are talking about inventory as something that should be avoided and something that is driving costs up but the opinions differ especially depending on who is being asked. The Finance Manager wants the inventory to be small to keep down costs however the Marketing Manager wants it to be larger to be able to satisfy the customers. In production it is important to utilize the machines as much as possible which often lead to large production series but at the same time large inventory. The Supply Chain Manager wants the products to be available for the customers but at the same time want to avoid large capital binding inventories with a risk of obsolescence. Inventories can be classified based on the purpose for which they are held. The different inventories are cycle stock, in-transit inventories, safety or buffer stock, speculative stock, seasonal stock and dead stock.
3.2.1 Cycle stock
Cycle stock is a stock for replenishment of inventory sold or used in production. This stock is required to meet a known demand and predictable lead times. This means there are no fluctuations in demand nor lead time hence no need for additional stock15.
3.2.2 In-transit Inventories
In-transit inventories are inventory that is on its way from one location to another. The inventory is not available for sale or shipment until after they arrive at their destination. This inventory can be included in inventory carrying costs.16
3.2.3 Speculative stock
Speculative stock is inventory detained for reasons other than satisfying current demand. A forecast might say that the prices of material or packaging are expected to increase and can make it desirable to order bigger volumes17. During different economies companies can prepare with higher stocks this is also the case before campaigns periods when higher sales are expected.
3.2.4 Safety stock or Buffer Stock
It is increasingly important to be able to handle customer’s different demands and wishes. It is vital to be able to deliver on time with the right quality and quantity. An accurate forecast can help bring the inventory level down but if there are uncertainties it can be important to keep lager safety stocks. Uncertainties can be problems with production, deliver accuracy from suppliers and unpredictable demand.18
3.2.5 Seasonal stock
For seasonal products there often are higher demands during a shorter period. Seasonal stock is kept to be able to have a high and even capacity utilization19. To be able to deliver products at the right service level products are manufactured gradually. Examples of products that are seasonal are ice-cream,
15Grant, David B., Fundamentals of logistics management, European ed., McGraw-Hill Education,
Maidenhead, Berkshire, 2006, p. 131.
16Ibid
17Grant, David B., Fundamentals of logistics management, European ed., McGraw-Hill Education,
Maidenhead, Berkshire, 2006, p. 133.
18Ibid
12
gingerbread and agricultural products. When change over costs and setup costs are high it is favorable to keep a buffer between production and sales.
3.2.6 Dead stock
Dead stock is for products that do not have a demand during a specified period of time. Dead stock can also be products which are obsolete and these products are sometimes transported to another location to avoid the obsolescence penalty at the current location20.
3.2.6 The purpose of having inventory
Inventory is costly as described before but can also lower other costs. Often purchase, transport and production get economical with larger volumes. If the machines have to be altered for one product the setup will have to be done more times than if bigger batches were produced which result in higher production costs. This also leads to additional manual work and less utilization of the machines compared to production of lager volumes. It is important to compare the costs to find the most economical batch sizes.21
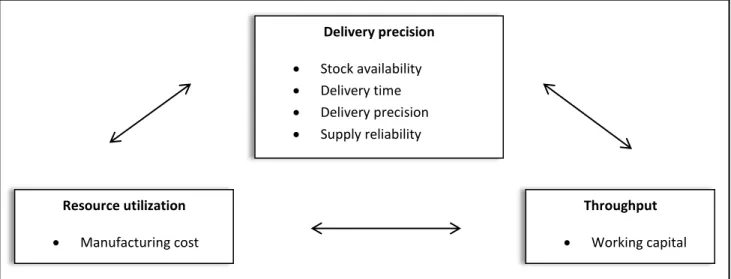
Conclusively inventory is kept to be able to offer good delivery service and in an effective way satisfy customer’s whishes by having good stock availability, delivery time, delivery precision and supply reliability. Stock availability is the ability to deliver directly from the inventory. The delivery time is the time from the customer makes the order until it is delivered on the time agreed. The delivery precision is how well the order corresponds to what was ordered. Supply reliability is how well the products are delivered on the right time to the right place with the right quality and quantity22.It is important to take all the costs included in the different activities and compare them to motivate how well the different factors can be satisfied. The different activities can be seen in the Figure 423.
20Grant, David B., Fundamentals of logistics management, European ed., McGraw-Hill Education,
Maidenhead, Berkshire, 2006, p. 135.
21Lumsden, Kenth, Logistikens grunder, 2., [utök. och uppdaterade] uppl., Studentlitteratur, Lund, 2006
22 Ibid
23Figure based on Lumsden, Kenth, Logistikens grunder, 2., [utök. och uppdaterade] uppl., Studentlitteratur,
Lund, 2006 Delivery precision Stock availability Delivery time Delivery precision Supply reliability Throughput Working capital Resource utilization Manufacturing cost
13
3.3 Inventory costs
Products need to be stored for a long or short period and employees are needed for deposition, registration and picking. The inventory also needs to be stored in a warehouse. Equipment for handling the inventory is also needed and a system to keep track on everything being stored. All these activities run higher costs and are independent of the volume of the inventory on a short term basis. These costs are called warehouse costs. Warehouse costs can get higher in the long run if the inventory volume grows past a certain point. For example if a company stores large volumes of products it may need additional storage space and warehouse workers.24
3.3.1 Holding costs
Products stored are tied resources. Resources have been used for the raw materials and packaging of the products. The products will hopefully be sold but as long as the products stay at the warehouse they bind capital. Holding cost is an opportunity cost for capital tied up in inventory that could be available for other investments for example interest rates or increased marketing resulting in better sales25. The holding cost can be estimated on the return on an alternative investment. It cannot exactly be compared to the expected return of an alternative investment since financial risks associated with the investment has to be taken into consideration. A lot of companies use the cost of capital rate which corresponds to the best or expected return on the investment26. This assumption is best for products with low risks27. The holding costs are mostly the capital cost but can also include storage space cost, inventory service cost, and inventory risk costs28.All the costs that vary with the inventory level should be included in the holding cost. Often the holding cost is calculated with a carrying charge κ times the variable replenishment cost per unit C. The reason for this is that the capital cost captures the main part of the holding cost.
(1)
Some companies’ uses inventory carrying costs that are based on benchmarking with industry averages but this assumption is problematic29. Although two companies are similar in terms of manufacturing and distribution the availability of capital can differ and will lead to two different inventory strategies. Shortages of money may make it expensive to invest in inventory and a higher interest hence higher cost of money. The cost of money pre-tax is the interest rate the company is earning on its cash. Companies with plenty capital will get a low cost of money. If these companies are managed properly the company whose cost of money is low will have more inventories30.
Having a large inventory also means different risks. The products can get damaged in conjunction with handling. Shrinkage can occur if products disappear or get stolen. There is also a risk for fires or other
24Oskarsson, Björn, Ekdahl, Bengt & Aronsson, Håkan, Modern logistik: för ökad lönsamhet, 4., [omarb. och
utök.] uppl., Liber, Stockholm, 2013
25Ibid 26Ibid
27Berling, Peter, On determination of inventory cost parameters, Univ., Diss. Lund : Univ., 2005,Lund, 2005
28Ibid
29Grant, David B., Fundamentals of logistics management, European ed., McGraw-Hill Education,
Maidenhead, Berkshire, 2006, p. 142.
14
disasters, and a risk that the products get outdated if the design of the labels and packages changes. How big the risks are depends on the product. It is obvious that the capital cost increases with the volume but not as clear for the risk costs. Often costs for obsolescence and scrapping get higher with the volume31. To be able to calculate the inventory rate the capital cost and the risk costs have to be estimated. Normally the costs are evaluated yearly and since the inventory level differs during the year an average inventory level has to be estimated. The inventory level calculation can be seen in formulas (2) and (3) ( ) ∑ ·100 (2) ( ) ·100 (3)
The yearly cost of risk is estimated by adding the cost for obsolescence, theft, scrapping and other revenue losses and decreased value of the products during a year. These facts are often difficult to get a hold of because most of the systems do not keep track of them in an easily accessible manner. It is usual that companies protect themselves by signing insurances that cover these risks. If the insurance is proportional to the inventory level it can be calculated depending on the size.32
( ) ( ) ( ) ∑
(4)
The stock rate is calculated with the total holding costs and is then used for calculating the holding costs for specific products.33
3.3.2 Insurance
Insurance cost is a cost for estimated risk. Hazardous products are products with high value which are easy to steal and can result in high insurance costs. Insurance cost is influenced by the facilities characteristics such as security cameras that help reduce risk. Products with low risk are cheap products which are difficult to steal.34
3.3.3 Obsolescence
Obsolescence cost is a cost that occurs when products get damaged in storage, have passed their sell-by date or when the package design has gotten out dated. This cost is mostly estimated from previous years and experience, concerning markdowns and quantity scrapped. The costs are then used for calculating a yearly average obsolete inventory cost35
31Oskarsson, Björn, Ekdahl, Bengt & Aronsson, Håkan (2013). Modern logistik: för ökad lönsamhet. 4.,
[omarb.och utök.] uppl. Stockholm: Liber
32 Ibid 33 Ibid 34
Ibid
35Bowersox, Donald J., Closs, David J. & Cooper, M. Bixby, Supply chain logistics management, 3. ed.,
15
3.3.4 Reasons for lowering the inventory
An additional reason for lowering the inventory except reducing the capital cost is to find problems that are hidden because of the high inventory. By lowering the inventory the problems can be found and corrected. The concept is called the Japanese Sea. On the other hand a low inventory level will not always mean lower costs. If there are problems that cannot be solved and the inventory levels get lowered it can mean increased inventory costs. The whole process should be evaluated to find the optimal inventory level. A high carrying charge will lead to smaller batch sizes. The smaller batches can help even the workload however setup costs will increase36.
3.4 Service level
Service level is a performance target that defines performance objectives. It can be measured by case fill rate, line fill rate and order fill rate37. The case fill rate is the percentage of cases ordered that is delivered as agreed. The line fill rate is the percentage of order lines filled entirely and order fill rate is the percentage of customer orders filled entirely. It is not always the case that a high service level is better. In some cases it costs more than it gives. There is a connection between delivery service and demand, and it is known to be s-shaped. On the most markets there is a minimum level of service required to be able to compete on the market. When this level has been reached a small increase in delivery service will lead to a great increase in demand. This continues until another level where an increased delivery service only gives a slight increase in demand. A reason for this is that costs for the customers often increases to be able to fulfill the high service level. The level for which the demand for service stops depends on what is the standard for the specific product. A strategy could be to place ones level slightly over competitors (in the Graph 1) but not over the breaking point level38.
3.5 Order Costs
Normally there are costs associated with a replenishment of a product and its batch size. Different ordering costs can be setup and learning costs which are common in production. Setup costs occur when an expensive machine has to be stopped during the setup. Order costs can also be costs that occur in connection to transportation and material handling. For example it takes the same time for a purchaser to make an order for a thousand units as it takes for ordering a hundred units resulting in higher labor
36Berling, Peter (2005). On determination of inventory cost parameters.Diss. Lund : Univ., 2005
37Bowersox, Donald J., Closs, David J. & Cooper, M. Bixby, Supply chain logistics management, 3. ed.,
McGraw-Hill Higher Education, New York, 2010, p. 159.
38Mattsson, Stig-Arne, Effektivisering av materialflöden i supply chains, Institutet för transportekonomi och
logistik, Univ., Växjö, 1999, p. 149.
Demand
Delivery service
16
costs per sales unit. This cost has to be compared with the increased holding and scrapping cost of having the additional units stored. In some cases most of the setup can be done during the time the machine is running which reduces costs.
When ordering from outside suppliers there are various costs for an order depending on how the supplier handles their orders. Some suppliers may be more time consuming than order suppliers which can result in higher order handling costs. Typical cost can be the costs for handling authorization, receiving, inspection and handling invoices from the suppliers.39
3.6 Setup costs
Sometimes a production line produces more than one product. In this case it takes some time and work called setup time between the productions of the different products. These activities could be picking the needed raw material for the new order, preparing the order lists, setting the machine and the initial running of the machine. All these activities drive cost up. During the time all of these activities are done the machine cannot run which leads to production loss and costs. The setup costs are often treated as constant costs per production change. Since these costs are constant it is an encouragement to produce as much as possible to lower the setup cost per produced unit40. Setup cost varies depending on the time required to set up a line, the scrap due to setting up the production line and operating inefficiency as the line begins to run.
3.7 Lot quantity Costs
The logistics lot quantity costs are mostly due to procurement and production quantities which are costs that vary depending on size and frequency41 . The quantity costs include the cost for
capacity lost due to downtimes during the changeover of the production line
cost for materials handling, scheduling and expediting
price differentials due to buying in different quantities and order costs associated with order placement and handling
3.7.1 MTS
Make-to-stock is a strategy of economics of scale gained from long production runs. Large finished goods inventory is manufactured anticipating future customer demand. To support a make-to-stock strategy warehouse capacity is needed to store finished products in all the combinations a customer might want since the products usually are produced before the customer’s order them42.
3.8 SMED
One way to make smaller batch sizes more profitable is to simplify the production by eliminating unnecessary work which in the just-in-time philosophy is called “waste”. The wastes are all those
39Oskarsson, Björn, Ekdahl, Bengt & Aronsson, Håkan (2013). Modern logistik: för ökad lönsamhet. 4.,
[omarb.och utök.] uppl. Stockholm: Liber
40Mattsson, Stig-Arne, Effektivisering av materialflöden i supply chains, Institutet för transportekonomi och
logistik, Univ., Växjö, 1999, p. 147.
41Grant, David B., Fundamentals of logistics management, European ed., McGraw-Hill Education,
Maidenhead, Berkshire, 2006, p. 20.
42Bowersox, Donald J., Closs, David J. & Cooper, M. Bixby, Supply chain logistics management, 3. ed.,
17
activities that do not bring any worth to the customer. Ohno has identified seven different wastes, waste because of
Over production
Waiting
Unnecessary transportation
Processing
Putting products into stock
Unnecessary handling
Obsolescence
A common opinion in the industry is that there are no unnecessary activities in the supply chain and its as optimal as possible however this rarely is the case. The main two reasons for this are that processes not always are developed in a systematical or conscious way. The processes are mostly developed since they have to be done and the activities have been created ad hoc43 not thinking of what would be the most effective way. The second reason is that the demands from customers and technical opportunities always are improving. Often the way of working does not change at the same speed as technology does. The outcome of this is that there almost always are ways to improve processes.
3.8.1 Reduce the support activities from the critical flow
The process contains different activities and these activities are not always value adding nevertheless still necessary for the process. Examples of this are machine change over time and picking the materials for the order. Sometimes these activities can be done during the process and in this way save time and shorten lead times. This way of thinking is often call SMED. SMED focuses on changing external set-up times to internal set-up times.44
3.9 Trade-offs
Sometimes tradeoffs have to be made when planning for the whole supply chain to get the optimal total cost. Common tradeoffs in the supply chain are logistic cost connected to setups versus capital tied in inventory. Tradeoffs can also consider delivery service and capital tied in safety stocks, lead times versus utilization level in the production, the delivery time and delivery precision, delivery flexibility and lead times45. Some of the tradeoffs are illustrated bellow in Graph 3, Graph 2 and Graph 4.
43Mattsson, Stig-Arne, Effektivisering av materialflöden i supply chains, Institutet för transportekonomi och
logistik, Univ., Växjö, 1999, p.166.
44Ibid
45Mattsson, Stig-Arne, Effektivisering av materialflöden i supply chains, Institutet för transportekonomi och
18 Production lead times
Utilization level
The tradeoffs often concerns the capital tied. If the setup times are expensive and needs to be reduced and delivery service has to be improved a higher capital tied has to be accepted. Just like lower lead times means that lower utilization levels have to be accepted. Often an optimal order quantity is calculated to compare and weigh the costs against each other.
It is important to not only look at which tradeoffs that result in the best order quantity it is also important to look why some tradeoffs result in better costs. For example if it is more profitable to invest in higher inventory it is smart to find out why and if there is some way to lower the setup cost. In some situations the money spared on having larger inventory can be used to invest in equipment or methods to make the setups less costly. It is vital to look at the whole picture and not only sub improve. Not seeing the whole picture often result in hostility between different departments in the company.46
46Mattsson, Stig-Arne, Effektivisering av materialflöden i supply chains, Institutet för transportekonomi och
logistik, Univ., Växjö, 1999, p. 152-153
Capital tied
Change over cost
Capital tied
Service level
Graph 2: Capital tied versus service level Graph 3: Capital tied versus change over costs
19
3.10 Lost sales and stock out costs
Lost sales and stock out costs are costs that appear when the demand cannot be delivered because of lack of stock or delays in production. Studies have shown that a cost penalty occur for the manufacturers and retailers when a stock out occurs on the shelf47.The studies found that the customers when facing a stock out
do not purchase the item
substitute with different brands
substitute with the same brand
buy the item at another store
delay purchase
This can result in a revenue loss for the manufacturer and bad reputation that in the long run can make the customers choose another supplier. It can also result in penalty costs for special transportations or contribution for what losses the customers have made. A study claims that an unhappy customer on average will tell nine others about his or her dissatisfaction with the service48. Shortages and stock out
costs in the production occurs when machine break downs or shortages of the raw materials happen. These costs can be difficult to calculate and the size and impact varies a lot and therefore a lot of “estimations" do not take them into consideration.
Customers are continuously demanding shorter delivery times and delivery reliability which result in a demand for better performances from the manufacturers. The manufactures have to be able to deliver at the wanted service level to be competitive. A lot of companies have suffered from the increased competition. The traditional aspects of the market have been more directed to the end customer with activities like product development, promotional activities and price competition. These aspects are still important but good customer service has become an important order winner. Since a swing of power in many market channels has occurred were power is taken away from the manufacturer and towards the distributors, it is now important to develop strong relationships with the wholesalers. 49
3.10.1 Constraints
The processes today reflect a balance between economy of scale and economy of scope. Volume and variety drive logistical support requirements which drive costs. Capacity is a measure of how many units can be produced per time unit. The primary constraints which influence the manufacturing are capacity, equipment, and setup/changeovers. Tradeoffs between these activities have to be made to get an ideal manufacturing operation. These compromises should be made taking forecasted sales, planned promotions and seasons into consideration. 50
47Christopher, Martin (2011). Logistics & supply chain management. 4. ed. Harlow: Financial Times Prentice
Hall
48Grant, David B., Fundamentals of logistics management, European ed., McGraw-Hill Education,
Maidenhead, Berkshire, 2006, p. 19.
49Mattsson, Stig-Arne, Effektivisering av materialflöden i supply chains, Institutet för transportekonomi och
logistik, Univ., Växjö, 1999, p. 146.
50Bowersox, Donald J., Closs, David J. & Cooper, M. Bixby, Supply chain logistics management, 3. ed.,
20
3.11 The Bullwhip Effect
The demand of a certain product may not vary much at the retailer but the inventories and back-order-levels fluctuate considerably across the supply chain. When the retailers place their orders to the wholesalers, the fluctuations of the demand will increase in comparison to the retailer’s sales and when the wholesalers place their orders the distributers demand will fluctuate even more. This behavior continues across the supply chain. The variability increases throughout the supply chain. This phenomenon is called the Bullwhip Effect. 51
Graph 5 shows a four stage supply chain with customers, one retailer, one wholesaler and one manufacturer. When the retailer observes a demand they place an order to the wholesaler which in turn places an order to the manufacturer. This graph shows the bullwhip effect which is the increase of variability, across the four stage supply chain.52
Graph 5: The increasing variability of orders in the supply chain
3.11.1 Sources for the Bullwhip Effect
There are four sources for Bullwhip Effect and they are price fluctuations, order batching, demand signal processing and rationing game.
When the manufacturer gives promotion to the retailers it can lead to unpredictable order patterns and this is connected to the source called price fluctuation. Promotions can also lead to distorted “true demand data”. A way for the manufactures to avoid making wrong forecasts and get a better picture of the reality is to get sales information from the retailers.
51Simchi-Levi, David., Kaminsky, Philip. & Simchi-Levi, Edith. Managing the supply chain [Elektronisk resurs]
the definitive guide for the business professional. New York: McGraw-Hill, 2004.
52Figure based on Lee, Hau L. Padmanabhan, V. Whang, Sheunjin. The Bullwhip Effect In Supply Chains.
Stanford, 1997. 0 5 10 15 20 25 Or d e r q u an tity Time