SKI Report 01:30
System Studies in PA:
Development of Process Influence
Diagram (PID) for SFR-1 Repository
Near-Field + Far-Field
M.J. Stenhouse
W.M. Miller
N.A. Chapman
May 2001
ISSN 1104-1374 ISRN SKI-R-01/30-SEResearch
SKI perspective
Background
As part of the licence for SFR-1 a renewed safety assessment should be carried out at least each ten years for the continued operation of the SFR-1 repository. SKB is currently engaged in the SAFE project to evaluate the performance of the repository system. SKI is currently preparing for its review of this renew safety assessment.
Purpose of the project
SKI work has so far been focused on the construction of a new Process Influence Diagram (PID) for the SFR repository, including the far-field. Another task is the testing of the software program SPARTA (developed by QuantiSci for SKI) on real PIDs. The program will serve as a tool for development and updating of PIDs and for scenario analysis. Assigning influence levels to the SFR PID is also a part of this task.
Results and continued work
The PID that now has been set up for the SFR repository is based on a list of FEPs (Features, Events and Processes) describing the future evolution of the repository system. This FEP-list together with the PID, that has been prepared using the software program SPARTA and the SPARTA program itself, make a powerful tool for scrutinise the development of the SFR-1 system.
The PID for SFR is not final product but must be updated whenever new knowledge and understanding of the repository system is gained.
Effect on SKI’s work
This project forms an essential part of the SKI’s review of SKB’s project SAFE for SFR-1.
Project information
Responsible at SKI has been Benny Sundström.
SKI ref. 14.9-991358/99209 (and SKI ref. 14.9-980661/98144).
Relevant SKI report is: SKI Report 95:26, SITE-94, Systems Analysis, Scenario
Construction and Consequence Analysis Definition for SITE-94, Neil A.Chapman, Johan Andersson, Peter Robinson, Kristina Skagius, Clas-Otto Wene, Marie Wiborgh, Stig Wingefors, June 1995.
Final report within the project: System studies in PA: Development of process
influence diagram (PID) for SFR-1 repository. Near-field + far-field, MSCI-9916, M. Stenhouse, W. Miller, N. Chapman August 2000.
SKI Report 01:30
System Studies in PA:
Development of Process Influence
Diagram (PID) for SFR-1 Repository
Near-Field + Far-Field
M.J. Stenhouse¹
W.M. Miller²
N.A. Chapman²
¹Monitor Scientific, LLC
3900 S. Wadsworth Blvd., Suite 555
Denver, Colorado 80235
USA
²QuantiSci Ltd.
Melton Mowbray
47 Burton Street
Melton Mowbray
Leicestershire LE13 1AF
May 2001
This report concerns a study which has been conducted for the Swedish Nuclear Power Inspectorate (SKI). The conclusions and viewpoints presented in the report are those of the author/authors and do not necessarily coincide with those of the SKI.
SKI Project Number 99209
i
Summary
Scenario development is a key component of the performance assessment (PA) process for radioactive waste disposal, the primary objective being to ensure that all relevant factors associated with the future evolution of the repository system are properly considered in PA. As part of scenario development, a list of features, events and processes (FEPs) are identified and assembled, representing the Process System, with interactions/influences between FEPs incorporated in a Process Influence Diagram (PID).
This report documents the technical work conducted between 1997 and the end of 1999 under the Systems Studies Project. The overall objective of this project has been the construction of a PID for the SFR-1 repository (final repository for reactor waste), this PID being the first stage in the identification of scenarios to describe future evolution of this repository.
The PIDs discussed in this report have been created using two software applications: existing commercial software (Business Modeller, Infotool AB. Stockholm, Sweden) and, more recently, a newly developed software tool SPARTA (Enviros QuantiSci, Henley, U.K.). Although the focus of this report is on the application of SPARTA to PID development, it is important to document the work carried out prior to SPARTA being available, in order to provide a complete record of the entire SFR-1 PID development effort as well as preserving the context of the multi-year project.
Following a description of the different disposal sections of the SFR-1 and the various near-field barriers, the sequential development (i.e. near-field of Silo, BMA, BLA, BTF sections; far-field; integrated near-field + far-field) of the PID for SFR-1 repository system using Business Modeller is described. Owing to the complexity of the repository, in terms of number of both different disposal sections (Silo, BLA, BMA, BTF) and barriers associated with each section, the two-dimensional (2D) PID created for SFR-1 using Business Modeller is visually complex and potentially difficult to interpret. Primarily for this reason, the need for an alternative approach was recognised in 1996 and the decision was taken to develop new software for this purpose. Following a consensus on the specific requirements of the new software, a first version of SPARTA became available towards the end of 1998, with subsequent versions being released during 1999.
SPARTA is used to generate a three-dimensional (3D) PID consisting of a series of layers, each underlying layer providing additional (more detailed) information about the Process System. The uppermost layer or diagram may be regarded as a top-level view of the repository system (near-field, far-field and biosphere). In the PID developed for SKI, underlying layers or diagrams often have some physical meaning, e.g. sections of the repository (Silo, BLA, BMA, BTF sections, repository zone), or barriers of a section (e.g. for the Silo - backfill, reinforced shell, porous grout or mortar, waste package). Other layers contain groups of related FEPs, e.g. geochemical FEPs. A total of 95 drawings, typically consisting of 6-8 FEPs each, describe the SFR-1 repository system.
The two PIDs developed for the SFR-1 repository provide different representations of the near-field and far-field of the repository system; the first PID being two-dimensional
ii
and the later one three-dimensional. Despite the different approaches, the primary objective of constructing each PID has been the same: firstly, to ensure that all FEPs relevant to the future evolution of the repository system are considered, and secondly, that all "essential" Influences are identified so that they may be incorporated in the subsequent modelling of the system’s evolution.
iii
Table of contents
1 Introduction to Project ...1
1.1 Process System and Process Influence Diagram ...1
1.2 Phases of Project ...1
1.3 Layout of Report ...2
2 Waste Disposal Concepts for SFR-1 Repository ...3
2.1 Silo Near-Field: Engineered Barriers ...3
2.2 Near-Field Barriers of Other Sections of Repository ...4
3 Preparation of Near-Field FEP list for SFR-1...9
3.1 Identification of Near-Field FEPs...9
3.1.1 Methodology for Preparing PID FEP List...9
3.1.2 Categorisation of Near-field FEPs ...10
3.1.3 Rationalisation of Near-field FEPs...11
3.2 Preparation of Far-Field FEP List ...12
4 Development of PID for SFR-1 Repository Using Business Modeller...13
4.1 Construction of Near-Field PIDs ...13
4.1.1 Development of Near-field PID for Silo ...13
4.1.2 Near-Field PIDs for BTF, BMA and BLA Sections ...14
4.2 Construction of Far-Field PID...15
4.3 Integrated Near- and Far-Field PID...15
5 Development of PID for SFR-1 Using SPARTA...17
5.1 Description of Hierarchical Approach...17
5.2 Description of SPARTA Code and SPARTA PIDs...18
5.3 Construction of SPARTA PID for SFR-1 ...21
5.3.1 Stages in Development of Current PID ...21
5.3.2 Presentation of the Current PID ...21
5.4 Comments on Current SPARTA PID ...22
6 Summary of Project...23
6.1 Recommendations ...23
References ...25
Appendix A: Compilation of Near-Field FEPs from International FEP List...27
Appendix B: Reduced List of Near-Field Barrier FEPs: Sorted by Category...41
Appendix C: FEP List for Near-Field PID for L/ILW Disposal ...53
Appendix D: Compilation of Far-Field FEPs from International FEP List ...57
Appendix E: Reduced List of Far-Field FEPs: Sorted by Category ...71
iv
Appendix G: Influences in the Reference Case L/ILW Near- Field Section of PID ...75
Appendix H: Influences in the Far-Field Section of PID for SFR-1 ...89
Appendix I: FEPs From SPARTA PID for SFR-1 Repository: Near-Field...93
Appendix J: FEPs Included in SPARTA PID for SFR-1 Repository: Far-Field...99 Annexe I: Extracts of PID for Near-Field Section of Silo, SFR-1 Repository... ...Annexe I-1 Annexe II: Extracts of PID for Near-Field Rock Zone and Far-Field Sections of Silo, SFR-1
Repository ... Annexe II-1
Annexe III: Reference Case PID for SFR-1 Repository: Individual Drawings from SPARTA... ... Annexe III-1
1
1
Introduction to Project
1.1
Process System and Process Influence
Diagram
Scenario development is a key component of the performance assessment (PA) process for radioactive waste disposal (NEA, 1992), the primary objective being to ensure that all relevant factors associated with the future evolution of the repository system are properly considered in PA. As part of scenario development, a list of features, events and processes (FEPs) are identified and assembled in a Process System, with interactions/influences between FEPs incorporated in a Process Influence Diagram (PID) (Chapman et al., 1995). This organised assembly is required to describe the performance of the disposal system (near-field, far-field and biosphere), including radionuclide release and migration, so that its behaviour can be predicted from a given set of external conditions. A scenario is then defined by a specific set of external conditions which influences the FEPs in the Process System. For each scenario, FEPs and their interactions/influences can be used to identify what modelling or calculations are necessary to determine the consequences of that scenario.
This report documents the technical work conducted between 1997 and the end of 1999 under the Systems Studies Project. The overall objective of this project has been the construction of a PID for the SFR-1 repository (final repository for reactor waste), this PID being the first stage in the identification of scenarios. In order to facilitate construction of the PID, as well as enabling editing and manipulation of the various elements of these diagrams, a software tool, SPARTA, was developed independently. This development, concurrent with the Systems Studies Project, is reported elsewhere (Jack and Hiller, 1999). However, since it was appreciated that the software tool would only become available during 1999, it had been important to proceed with PID development prior to 1999, using existing software, in order to maintain the capability for scenario development work associated with the PA of SFR-1.
Ultimately, therefore, the PIDs discussed in this report have been created using two software applications: the existing commercial software and the newly developed code SPARTA. Although the focus of this report is on the application of SPARTA to PID development, it is important to document the work carried out prior to SPARTA being available, in order to provide a complete record of the entire SFR-1 PID development effort as well as preserving the context of the multi-year project. As discussed in this report, the fact that the resultant PIDs have been constructed in entirely different ways has offered the opportunity to compare the products of the different approaches.
1.2
Phases of Project
As stated above, this project has been underway since 1997 and has been conducted in various stages, as discussed below and reported in several internal SKI reports. In order
2
to document overall progress and achievements, these different stages are covered in this report.
The initial (1997) project work under this project focussed on the development of a near-field PID for the Silo section of the SFR-1 repository (Stenhouse and Chapman, 1998), via:
• identification, screening and categorisation of near-field FEPs; and
• construction of a general PID for the Silo section of the SFR-1 repository only, using existing software, available commercially (Business Modeller; Infotool Data AB, Stockholm, Sweden).
Subsequently, as reported in Stenhouse et al. (1998), the bulk of the 1998 input to the Systems Studies Project involved:
• extension of the existing PID for the Silo to accommodate all sections of the repository (the near-field of SFR-1 comprises five independent sections in total: one Silo, two BTF vaults, one BLA vault and one BMA vault, as discussed in Sections 2.1 and 2.2;
• similar treatment of the far-field, i.e.;
− identification, screening and categorisation of FEPs applicable to the far-field of the SFR-1 repository;
− construction of the far-field section of the PID;
• combination of near-field and far-field to produce the reference case PID for the SFR-1 repository.
The bulk of the 1999 work made use of SPARTA to construct a different type of PID, but for the same repository system. As newer versions of the code were released, the opportunity became available to make use of additional features in the software, incorporated to improve flexibility and speed of PID construction. Thus, to a large extent, the creation of this independent PID fulfilled the important requirement of providing in-depth testing and demonstration of the software capabilities.
1.3
Layout of Report
Discussion of the stages in the project described above are laid out in this report essentially in sequence. Section 2 of this report is devoted to a short summary of the key features of the disposal concepts for the SFR-1 repository system. Section 3 deals with the compilation and review of FEPs appropriate to the near- and far-fields. Section 4 provides a brief summary of the construction of the Reference Case PID comprising near-field and far-field of the SFR-1 repository using the existing software, Business Modeller. Section 5 covers the more recent PID construction using SKI’s code SPARTA, developed specifically for this purpose.
Finally, Section 6 discusses the achievements of the 3-year project as well as identifying ways in which the most recent version of the PID can be made more powerful.
3
2 Waste Disposal Concepts for SFR-1
Repository
As a basis for developing the PID, a brief description of the SFR-1 repository and its components is provided here.
The waste intended for SFR-1 arises mainly from the operation and maintenance of nuclear power plants and comprises low- and intermediate-level waste with a small inventory of long-lived radionuclides (Andersson et al., 1994). This waste , generated through the operation of nuclear reactors, consists of filters, ion-exchange resins, and general scrap for which recycling is not an option. The repository is also expected to take similar types of waste arising from the use of radioisotopes in medicine, industry and research.
There are 4 separate types of disposal section within the SFR-1 repository, viz.
• the Silo, containing metallic, organic and inorganic wastes immobilised in concrete and bitumen;
• BMA rock vault/tunnel section, also containing wastes immobilised in bitumen or cement;
• BLA rock vault/tunnel section, containing wastes in steel containers or containing wastes immobilised in bitumen or cement;
• two BTF rock vaults, for concrete tanks containing ion exchange resin wastes as well as the ashes from waste incineration.
About 70% of the radioactivity of the repository is housed in the Silo (Bo Strömberg, personal communication).
2.1
Silo Near-Field: Engineered Barriers
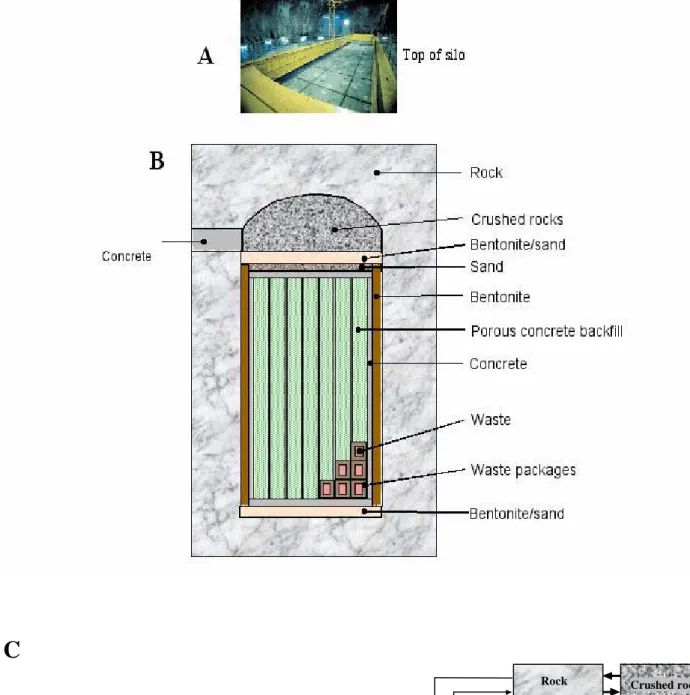
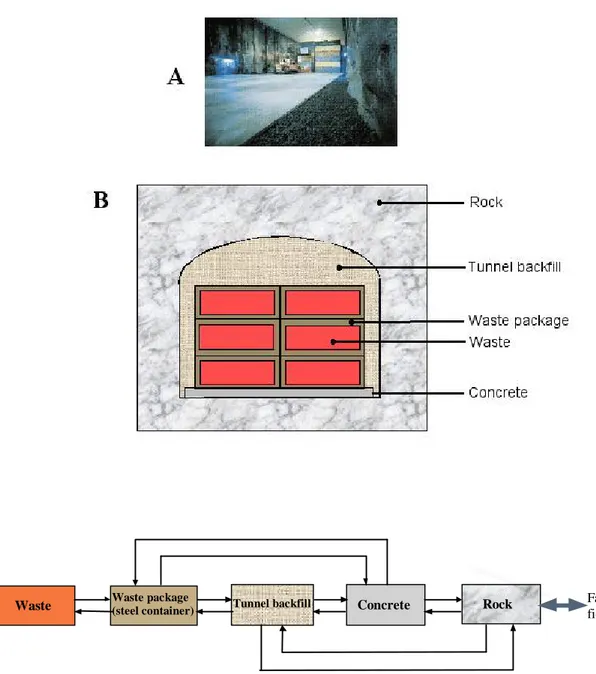
The near-field barriers of the Silo of SFR-1, discussed in detail in Stenhouse and Chapman (1998) and shown in Figure 1, comprise:
• the waste package: the waste itself immobilised in concrete or bitumen, within steel drums, and with a concrete overpack;
• an intimate mix of porous concrete or grout (mortar) surrounding the waste packages within the Silo structure (shell);
• the shell constructed using reinforced concrete; • a backfill layer, between Silo and rock, consisting of:
4 − sand plus bentonite-sand (top), − bentonite only (around the Silo shell);
• near-field rock surrounding the Silo, with an additional layer of crushed rock above the bentonite-sand on top of the Silo.
2.2 Near-Field Barriers of Other Sections of
Repository
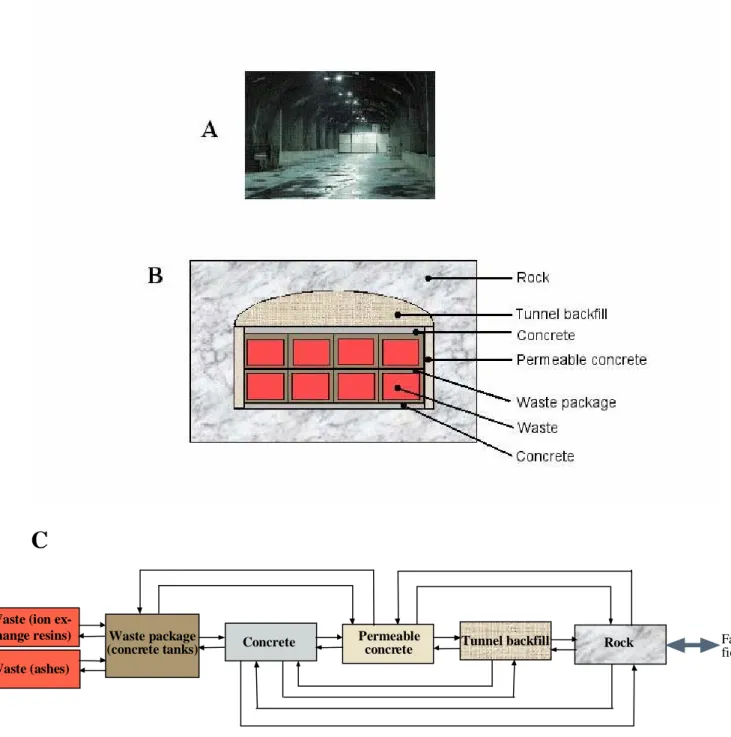
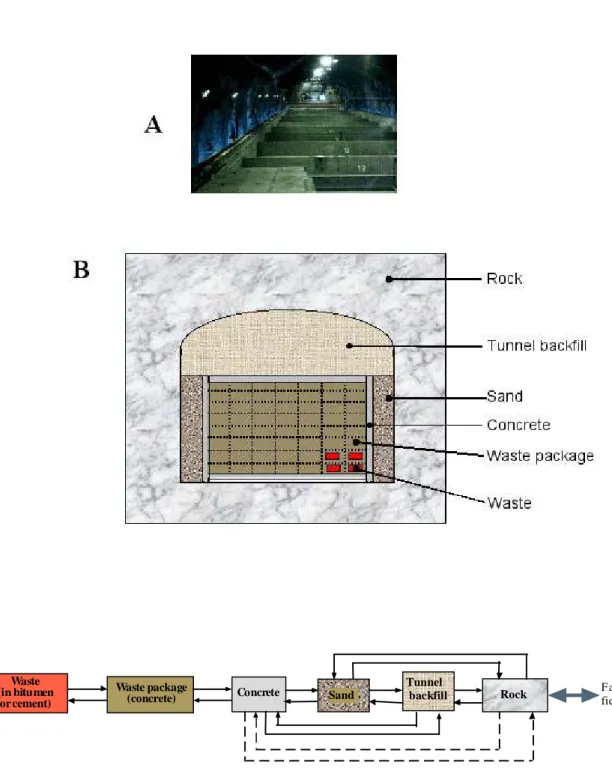
The equivalent near-field barriers for the disposal concepts for the BTF, BMA and BLA sections of the SFR-1 repository are shown in Figures 2A, 3A and 4A. In fact, the individual engineered barriers for each of these sections of the repository system are quite similar to those of the Silo, although there are distinct differences, the main one being that the tunnel/vault sections of SFR-1 do not contain bentonite or bentonite-sand as an engineered barrier. Figures 2B, 3B and 4B, identify the corresponding conceptual barriers to be incorporated in the respective near-fields of each section of the repository.
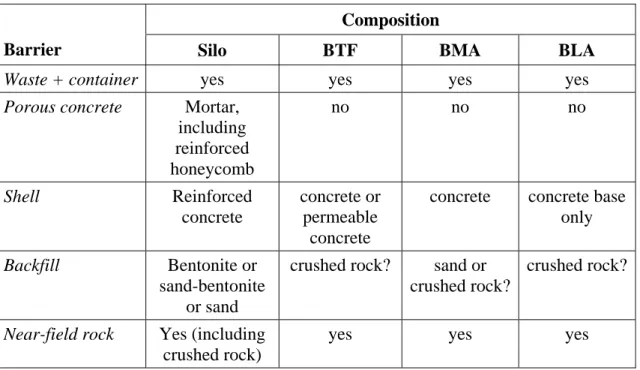
Table 1 summarises the near-field barriers for each area and is useful for comparison purposes when extending the Silo near-field to include the other near-field areas of the SFR-1 repository. For example, using Business Modeller, these other areas may be generated by duplicating the Silo near-field PID, followed by removal of those section(s) or specific FEPs which do not apply to the BTF, BMA or BLA sections. Thus, for example, FEPs relating to bentonite and the "mortar" component of the PID may be removed from the corresponding BTF, BMA and BLA sections. Similar to the Silo, Table 1 indicates that some of the backfill barriers have a composite nature.
Table 1 Near-field barriers included in near-field PID.
Composition
Barrier Silo BTF BMA BLA
Waste + container yes yes yes yes
Porous concrete Mortar, including reinforced honeycomb no no no Shell Reinforced concrete concrete or permeable concrete
concrete concrete base only
Backfill Bentonite or sand-bentonite
or sand
crushed rock? sand or crushed rock?
crushed rock?
Near-field rock Yes (including crushed rock)
5
C
Figure 1 The Silo concept for radioactive waste disposal (based on an original
drawing provided by B. Sundström, Swedish Nuclear Inspectorate. A: photograph, Swedish Nuclear Fuel and Waste Management Co.; B: disposal system; C: modular approach of Process System.
Porous concrete Bentonite Sand Bentonite-sand
Rock Crushed rock
Concrete Waste (steel
drums, bitumen)
Waste packages (concrete)
6
C
Figure 2 The BTF concept for radioactive waste disposal (based on an original
drawing provided by B. Sundström, Swedish Nuclear Inspectorate. A: photograph, Swedish Nuclear Fuel and Waste Management Co.; B: disposal system; C: modular approach of Process System.
Tunnel backfill Waste (ion
ex-change resins) Waste (ashes) Far-field Rock Waste package (concrete tanks) Permeable concrete Concrete
7
C
Figure 3 The BMA concept for radioactive waste disposal (based on an original
drawing provided by B. Sundström, Swedish Nuclear Inspectorate. A: photograph, Swedish Nuclear Fuel and Waste Management Co.; B: disposal system; C: modular approach of Process System.
Far-field Waste package (concrete) Waste (in bitumen or cement) Tunnel backfill
8
C
Figure 4 The BLA concept for radioactive waste disposal (based on an original
drawing provided by B. Sundström, Swedish Nuclear Inspectorate. A: photograph, Swedish Nuclear Fuel and Waste Management Co.; B: disposal system; C: modular approach of Process System.
Far-field
Concrete Waste package
(steel container)
9
3 Preparation of Near-Field FEP list for
SFR-1
3.1 Identification of Near-Field FEPs
Preparation of the initial near-field FEP list focussed on the Silo component of SFR-1, which, as well as containing about 70% total activity of the repository, can be considered as having the greatest number of barriers or near-field components. However, the compilation and review of FEPs was carried out in such a way that all barriers of the near-field systems for the suite of disposal concepts within SFR-1 and SFL 3-5 could be accommodated.
An initial objective was to ensure that all FEPs relevant to the radioactive waste disposal concept were identified and incorporated in the PID. Thus, an appropriate starting point was the international set of FEPs compiled from individual radioactive waste disposal management programmes. This 'raw' FEP List contains approximately 1580 entries of which the major portion (~ 1265 entries) was used as the basis for auditing the SKI FEP list as part of SITE-94 (Stenhouse et al. 1993). The FEP lists added to the original compilation are those for Kristallin I (Nagra, 1994) and the SFL 3-5 series developed by Eng et al. (1995). The latter, however, was used only for comparison purposes and is not included in Appendix A (see below).
As discussed in Andersson (1989), "the safety analysis of a radioactive waste repository involves the consideration of all possible relevant Features, Events and Processes, FEPs, that could, directly or indirectly, influence the release and transport of radionuclides from the repository". Furthermore, each FEP should be examined in terms of its cause, likelihood of occurrence, consequences and interaction with other FEPs (Andersson, 1989). Such an approach was also considered an appropriate basis for preparing the FEP list for PID development in this project.
Some obvious differences are expected in the series of FEPs associated with the disposal of long-lived L/ILW, compared with those for HLW disposal as described in SITE-94 (Chapman et al., 1995), especially since cement/concrete plays a significant role in a repository for long-lived L/ILW. Nevertheless, it became apparent that many of the FEPs for HLW and long-lived L/ILW, as discussed below, were quite similar.
3.1.1
Methodology for Preparing PID FEP List
The methodology adopted for producing a working FEP list for the PID relevant to low- and intermediate-level reactor waste disposal in the SFR-1 involved five stages, viz.
1. Using the compilation of national/international FEP lists as a starting point. 2. Identifying from this list those FEPs which are relevant to the near-field.
10
3. Identifying and eliminating duplicates etc. and screening out irrelevant FEPs (e.g. those exclusive to HLW).
4. Assigning FEPs from the reduced set to recognisable near-field categories. 5. Rationalising FEPs of different categories to obtain a working set of PID FEP
titles.
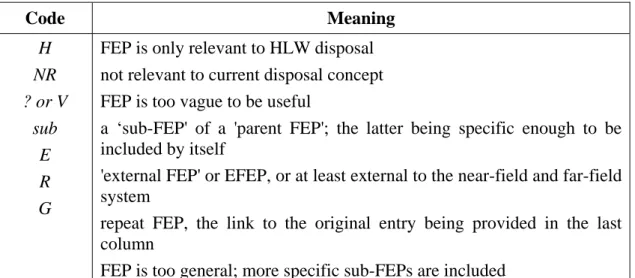
Appendix A contains, in spreadsheet form, the compilation of 'near-field' FEPs (512) obtained at the end of Stage 2 above. Additionally in this Appendix, the letters shown in the second column of the spreadsheet tables were used to allow (most of) the irrelevant FEPs to be screened out in Stage 3. The justifications for exclusion and the corresponding letter codes are shown in Table 2.
Table 2 Explanation of Screening Codes.
Code Meaning H NR ? or V sub E R G
FEP is only relevant to HLW disposal not relevant to current disposal concept FEP is too vague to be useful
a ‘sub-FEP' of a 'parent FEP'; the latter being specific enough to be included by itself
'external FEP' or EFEP, or at least external to the near-field and far-field system
repeat FEP, the link to the original entry being provided in the last column
FEP is too general; more specific sub-FEPs are included
Additional letters added as descriptors, but not used for screening purposes, were T to denote time dependency, and P to denote properties or a parameter.
3.1.2 Categorisation of Near-field FEPs
The resulting reduced series of FEPs from Stage 3 was still rather large and unwieldy. Consequently, to manage this list better, the FEPs were sorted according to the individual components of the near-field barrier system, viz.
• WC comprising
− W = WASTE: the waste form, which is inside an outer container or drum. The waste form comprises both the waste itself and its encapsulation/ immobilisation matrix, if any, and
− C = CANISTER: the steel container/drum in which the waste form is emplaced;
11
• M = MORTAR: the porous grout or concrete used to backfill compartments of the silo.
• S = SHELL: the reinforced concrete structure of the silo itself.
• B = BUFFER: the buffer (e.g. bentonite, bentonite-sand, or sand) around the silo or the backfill used to fill disposal vaults or tunnels.
• N = NEAR-FIELD ROCK: taken as the repository zone in which waste form, container, and buffer/backfill are emplaced; refers generically to the host rock from which the disposal caverns are constructed.1
The sorted FEPs are shown in Appendix B with additional information to identify the relevance of each FEP to the sections of the SFR-1 repository.
3.1.3 Rationalisation of Near-field FEPs
The final stage in the process was to 'rationalise' the sorted and reduced set of FEPs. Given that the FEP lists compiled in Stage 1 represent a range of waste disposal concepts, the categories identified should be considered as generic in the first instance. Thus, the FEPs sorted by category in Appendix B represent a heterogeneous mixture of FEPs which, having been abstracted from lists of individual countries, do not necessarily provide consistency in either the level of detail or interpretation. For example, some of the FEPs in the lists describe possible interactions between processes rather than the processes themselves.
Review of the reduced and categorised FEPs was able to generate a smaller set of FEPs for incorporation in the PID. It should be emphasised that FEP boxes within a PID are normally simplified to a certain extent, thereby keeping the number of boxes to a manageable level to allow ease of visual inspection. Hence, each FEP box may represent a combination of several FEPs which were individually identified in the original FEP list. It is important, however, that each FEP in Appendix B is incorporated in the PID and this requirement is the major reason for conducting the rationalisation. Specifically, the rationalisation process involved:
• treating some FEPs as influences. Several FEPs in Appendix B are relevant to the PID but more as influences (i.e. interactions between FEP boxes) rather than as individual features, events or processes. For example, thermal effects, would involve a link to temperature. It should be noted, however, that the distinction between what constitutes a FEP and what is an interaction is, to some extent, arbitrary and is not necessarily consistent.
• renaming some FEPs to more representative titles so that they can be used in different parts of the process system, in keeping with a modular approach.
1
The letter codes, W, C, M, S, B and N appear in the PID showing the individual FEPs and their interactions/influences.
12
• grouping FEPs under one title, e.g. Water chemistry (speciation, pH, etc.).
The end product, shown in Appendix C, is the list of FEPs to be incorporated in the PID.2 Although FEPs for long-lived L/ILW waste disposal are not directly applicable to the SITE-94 FEP list (specific to spent fuel disposal), comparisons are possible on the basis of 'equivalent' FEPs; for example, when FEPs relate to a barrier of the engineered barrier system but are not necessarily specific to the material used. Thus, subsequent comparison of the FEPs in Appendix C with those of SITE-94 indicated that many of the FEPs were essentially the same or certainly comparable in both lists.
3.2
Preparation of Far-Field FEP List
A process similar to that discussed above was carried out to generate the list of far-field FEPs. Appendix D contains, in spreadsheet form, the list of 'far-field' FEPs (547) abstracted from the original compilation. Additionally in this Appendix, the letters shown in the second column of the spreadsheet tables were used to allow duplicates and most of the irrelevant FEPs to be screened out (Stage 3). The basic reasons for exclusion and the corresponding letter codes are similar to those used for the near-field FEPs (see Table 2) and the resultant list of screened FEPs is shown in the second column of Appendix E.
Again, a rationalisation process similar to that discussed in Section 3.1.3 was carried out on the screened far-field FEPs, i.e.
• re-naming some FEPs to more representative titles to conform with those FEPs in the near-field rock component of the process system, in keeping with a modular approach (the original name and new FEP title are shown in Appendix D).
• grouping FEPs under one title, e.g. Properties of rock (fracture, hydrogeological and physical properties).
In addition, in order to maintain a degree of uniformity in the PID between the near-field (particularly the near-field rock barrier) and the far-field, some FEPs from the near-field rock category were added to the far-field FEP list, resulting in the more detailed working list of far-field FEPs shown in the fourth (right-hand) column of Appendix E and also, for completeness, in Appendix F3.
2
Some deletions (of FEPs), as a result of Workshop discussions (Stenhouse et al., 2000), are recorded in Appendix C.
3
Similar to the near-field FEPs, some FEP titles were either renamed or deleted following one of the SKI PID Workshops (Stenhouse et al., 2000); these are shown in Appendix F.
13
4
Development of PID for SFR-1 Repository
Using Business Modeller
As discussed in Section 1.2, the complete PID for both near-field and far-field of the SFR-1 repository was developed in stages. Although the focus of this report is the application of SPARTA to PID development, the earlier work involving the existing software is summarised below in order to establish the sequence and context of PIDs generated within the Systems Studies Project. The order in which the PIDs are discussed in this section reflects the different stages of development.
4.1 Construction of Near-Field PIDs
4.1.1 Development of Near-field PID for Silo
As stated in Section 1, a Process System is the organised assembly of all the FEPs required to describe the near-field disposal system performance, including radionuclide release/migration from the near-field, so that radionuclide release can be predicted with at least some degree of determinism from a given set of external conditions imposed on the Process System.
The Process System for the SFR-1 repository is represented by boxes which describe the features, events or processes (FEP boxes for, e.g. radioactive decay, degradation of barrier components, such as reinforced steel or waste matrix, etc.) which make up the waste disposal system, linked together by interactions between FEPs, or Influences. The end product is a Process Influence Diagram (PID).
The first step in constructing a PID is to identify the system to be defined. Briefly, as discussed in Section 2, the waste disposal concept for the SFR-1 Silo is shown in Figure 1A, and comprises:
• radioactive wastes; various wasteforms (cement and bitumen matrices) in steel canisters with concrete overpacks; backfilled with cementitious grout; all within a reinforced concrete silo; sand and bentonite-sand backfill; the disposal volume located in relatively deep, crystalline host rock.
The component barrier regions corresponding to the disposal system of the Silo, i.e. Figure 1A, are shown schematically in Figure 1B. Once the FEPs relevant to each barrier are specified, integrated and organised into regions of the PID, interactions between FEPs are identified and represented in the diagram by lines connecting the interacting FEPs, with an arrow showing the direction of the interaction/Influence. The software package Business Modeller developed by the Swedish Institute for Systems Development and released commercially by Infotool Data AB (Stockholm, Sweden), was used to draw the Influence Diagram. Generally, the main
14
properties/features of each barrier, along with processes which act upon these properties and the transport pathways in the barrier, feed towards the bottom right-hand corner where the FEP box "Transport and release of nuclides" for each region, or barrier, is situated. These "Transport and release..." FEPs are key links within the PID.
Extracts of the PID developed for the Silo of the disposal system are shown in Annexe I Approximately one page represents a single barrier of the multi-barrier disposal system. One main difference between this PID and one for vitrified HLW or spent fuel, is the need to accommodate different types of waste (L/ILW); in particular, separate FEP boxes for metal and organic wastes. This approach allows the relative importance of certain processes, for example, gas generation, to be reflected accurately in the level of significance, i.e. Importance Level, attached to corresponding Influences.
It can be seen from the different pages of Annexe I, that the FEPs and Influences for each near-field barrier are structured in a similar way, since many of the FEP titles were designed to be appropriate to more than one component of the disposal system as depicted in Figure 1B. The main links between the different barriers typically involve FEP boxes for Mechanical stress, Temperature, Water movement, Water chemistry and, of course, Transport and release of radionuclides.
Each Influence on the diagram has been assigned a unique code identifier, using a letter to identify each near-field barrier:
W waste; C matrix + container;
M mortar and the Silo honeycomb of internal cells (porous grout); S reinforced concrete shell (Silo only);
B backfill: bentonite or sand-bentonite; N near-field rock/disturbed rock zone.
Some Influence identifiers include the letter "T" (e.g. WT2 or ST2) to denote those Influences which are related to transport and release of radionuclides. These Influences are depicted in the PIDs via heavier, patterned lines. The numbers in parentheses following the Influence identifier, e.g. M33 (0), refer to Importance Levels (ILs) which were tentatively assigned initially, and subsequently audited/revised following a Workshop organised specifically for this purpose (Stenhouse et al., 2000). A full list of near-field Influences for the Business Modeller PID, together with Influence number, is provided in Appendix G.
4.1.2 Near-Field PIDs for BTF, BMA and BLA Sections
Separate near-field PIDs were created for the BTF, BMA and BLA sections of the SFR-1 repository. Although not included in this report, these PIDs are similar to the PID for the Silo section. Owing to memory constraints associated with Business Modeller and the desire to maintain clarity, these sections were created separately and remain separate diagrams. However, in an integrated near-field comprising all disposal sections, links/Influences between the different areas of the repository, including the Silo, will exist via the interconnecting tunnels/shafts in the integrated near-field and far-
15 field, as discussed in Section 4.3.
4.2 Construction of Far-Field PID
The PID for the far-field component of the Process System was constructed in a similar way to that of the near-field rock barrier of the near-field PID, though incorporating a slightly different set of FEPs. For the far-field PID, the external boundary conditions were provided by the following external FEPs, or EFEPs:
• Climate change; • Erosion of the surface; • Uplift/subsidence.
Note that the FEPs Seismic activity, and Saline or fresh groundwater intrusion were included in the far-field, although these FEPs could be considered external to the Process System (EFEPs).
The resultant PID, which for continuity includes the near-field rock zone as well as the far-field, are shown in Annexe II. The list of Influences which appear in this diagram is provided in Appendix H. Note that the corresponding letter code identifier for the far-field is G. Similarly, the letter code for Influences originating from external FEPs is E.
4.3 Integrated Near- and Far-Field PID
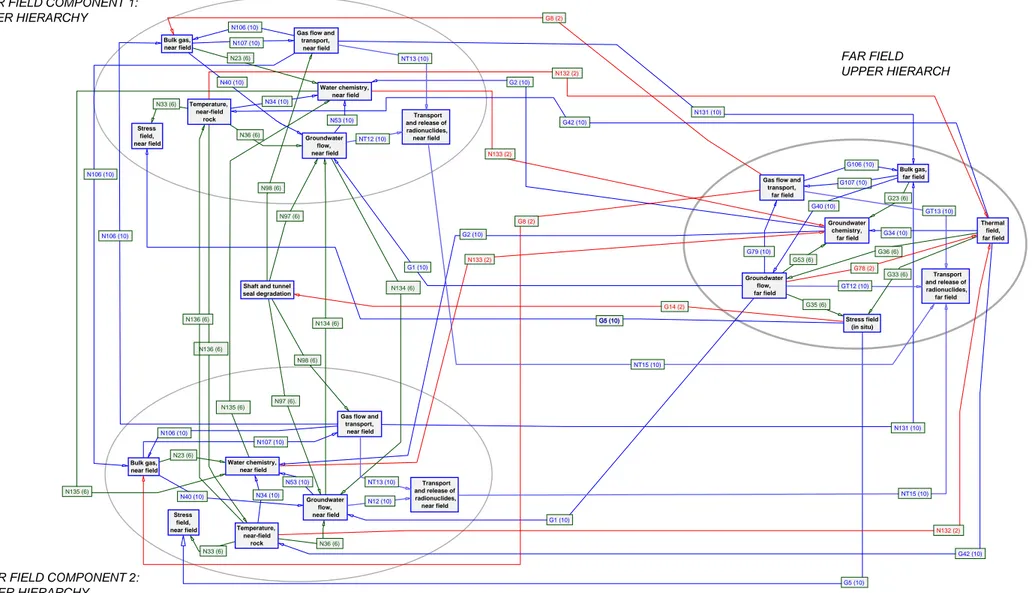
The final stage in the development of the full PID involved the development of an integrated near-field and far-field diagram. At this stage, owing to memory constraints of Business Modeller and the need for clarity, together with the fact that the new code, SPARTA, was now available for testing, a near-field + far-field PID was constructed only at an upper hierarchic level to show the inter-relationships between (only) two distinct near-field sections and the far-field. This diagram is shown in Figure 5. Note that in Figure 5, the FEP “Shaft and tunnel seal degradation” lies outside the two near-field components represented; this positioning is intended to reflect the repository layout in which interconnecting shafts/tunnels will exist between different parts of the repository.
In fact, as discussed in the next section, the approach used to generate the PID section shown in Figure 5 is similar to that adopted in the SPARTA code, where different hierarchic levels of the PID are presented separately. This approach is considered advisable when the level of detail in the PID is excessive.
Figure 5 Process Influence Diagram for two near-field and the far-field components of the SFR-1 repository: upper hierarchic level only.
Groundwater flow, near field
Gas flow and transport, near field Bulk gas, near field Water chemistry, near field Stress field, near field Bulk gas, near field Stress field, near field Water chemistry, near field Groundwater flow, near field Gas flow and transport, near field Bulk gas, far field Groundwater chemistry, far field Groundwater flow, far field
Gas flow and transport,
far field
Shaft and tunnel seal degradation SFR 1 REPOSITORY: NEAR FIELD + FAR FIELD UPPER HIERARCHIC LEVEL
(2 near-field components shown)
SKI/PID L/ILW/NF+FF/Version 1.2 (12/05/2000)
NEAR FIELD COMPONENT 1: UPPER HIERARCHY
FAR FIELD
UPPER HIERARCHY
NEAR FIELD COMPONENT 2: UPPER HIERARCHY Stress field (in situ) Thermal field, far field Temperature, near-field rock Temperature, near-field rock Transport and release of radionuclides, near field Transport and release of radionuclides, near field Transport and release of radionuclides, far field G5 (10) G107 (10) G106 (10) G34 (10) G42 (10) N133 (2) G2 (10) G2 (10) N133 (2) G8 (2) N131 (10) N131 (10) G5 (10) G5 (10) G1 (10) G1 (10) G8 (2) G42 (10) N107 (10) N132 (2) N132 (2) N135 (6) N135 (6) N136 (6) N136 (6) N106 (10) N106 (10) N134 (6) N134 (6) NT15 (10) NT15 (10) NT12 (10) NT13 (10) NT13 (10) N12 (10) GT13 (10) GT12 (10) N107 (10) N97 (6) N97 (6). N98 (6) N98 (6) N40 (10) N23 (6) G53 (6) G35 (6) G78 (2) G79 (10) G14 (2) G33 (6) G36 (6) G23 (6) G40 (10) N40 (10) N23 (6) N106 (10) N106 (10) N53 (10) N53 (10) N33 (6) N33 (6) N34 (10) N36 (6) N36 (6) N34 (10) 16
17
5 Development of PID for SFR-1 Using
SPARTA
Owing to the number of different sections (Silo, BLA, BMA, BTF) of the repository and the number of barriers associated with each section, the two-dimensional (2D) PID created for SFR-1 using Business Modeller is visually complex. Thus, information on FEPs and Influences is difficult to impart to those not intimately familiar with either the software or PIDs.
Primarily for this reason, the need for a different approach was recognised in 1996 and steps taken at that time to develop new software that would accommodate this different approach. Following a consensus on the specific requirements of the new software, a first version of SPARTA became available towards the end of 1998, with subsequent versions being released during 1999.
5.1 Description of Hierarchical Approach
The objective of the PID remains the same, i.e. to provide a systematic way of ensuring that all features, events and processes are considered for the repository system being studied. Similarly, FEPs are represented in the same way, via a box with a name signifying the FEP title.
The hierarchical or three-dimensional (3D) PID consists of a series of layers, where the uppermost layer or diagram can be regarded as an overview of the repository system; principally near-field, far-field and biosphere. Each layer constitutes a separate drawing and each drawing typically consists of 6-8 'boxes'.
Within the hierarchical structure, upper-level layers comprise groupings of FEPs designated as "super-FEPs". Note that the term “super-FEP” is purely an arbitrary one, being used generally to signify an underlying structure to that FEP. In the PID developed for SKI, some such layers or diagrams often have some physical meaning, e.g. in the case of the SFR-1 repository, individual
• components of the system (biosphere, far-field, near-field);
• sections of repository (Silo, BLA, BMA, BTF sections, repository zone);
• barriers of a section (e.g. for the Silo - backfill, reinforced shell, porous grout or mortar, waste package).
Other layers contain groups of related FEPs, e.g. the “super-FEP” Geochemistry contains FEPs such as Groundwater composition, Sorption, Precipitation/Dissolution, Microbial activity, and Colloid generation.
18
detail needed to describe the elements of the repository system increases and eventually, the lowermost levels of this PID consist of “individual” features, events or processes4, and are similar to small sections of the 2D PID. Although in the discussion below, all boxes are referred to as FEPs, the distinction between groups of FEPs, or super-FEPs, and individual FEPs should be appreciated.
The principal advantages of such an approach are that:
• development of a PID is to some extent intuitive as one can start from a fairly simple, superficial-level diagram (biosphere, far-field and near-field) and gradually add detail in a logical fashion as one becomes more familiar with the disposal system;
• each diagram of the PID is much simpler in appearance, typically consisting of about 4-8 FEP boxes;
• the structure beneath certain super-FEPs, i.e. the underlying FEPs and Influences, is in many cases identical, which offers the opportunity to duplicate those parts of the PID, using SPARTA.
Added to the above advantages is the large supporting database (see next section), which results in a flexible, yet powerful, software tool. The only apparent drawback of the 3D PID is, of course, the inability to view the entire PID at one time; however, given a complex PID such as that for the SFR-1 repository, this should not be regarded necessarily as a disadvantage.
Two examples of drawings are provided here: Figure 6, showing the individual barriers of the Silo section, and Figure 7, containing the individual FEPs within the Transport and Release of Radionuclides drawing for the Silo Waste Package.
5.2 Description of SPARTA Code and SPARTA PIDs
SPARTA was developed for SKI by QuantiSci (Jack and Hillier, 1999) to facilitate the construction of 3D PIDs. FEPs, or groups of FEPs are represented by boxes, and Influences by lines connecting boxes, similar to the basic components of a regular 2D PID.
However, in the 3D structure, Influences can extend over several drawings. To enable Influences to be properly recorded, therefore, lines called "Connections" are physically added to drawings. By way of an analogy, the layers of a 3D PID may be looked upon as separate floors of a building, FEPs may be considered as rooms within a floor, and Connections correspond to the wiring which links different rooms and different floors.
4
The term “individual” to FEPs is also an arbitrary one since decisions may subsequently be made to subdivide an individual FEP into two or more detailed FEPs. In such a case, the original “individual” FEP becomes one with structure, i.e. a super-FEP.
19 Near_Field\Silo_section\Silo_section.vsd Silo_section.vsd (Level 2) Backfill Waste package Porous concrete (grout) Reinforced concrete shell L2NFS8 L2NFS11 L2NFS4 L2NFS12 L2NFS2 L2NFS1 L2NFS10 L2NFS7 L2NFS9 L2NFS14 L2NFS6 L2NFS3 L2NFS5 L2NFS13
Figure 6 SFR-1 PID: Individual barriers of the Silo section of the SFR-1 repository.
Note: Lines extending from FEPs to the boundary of the drawing (Reinforced concrete
shell in Figure 6 above) connect Influences from that drawing to one or more other drawings.
Using SPARTA, each drawing consists of a rectangular boundary within which boxes, or FEPs are added. Connections between FEPs in the same drawing are obtained by direct lines between the FEPs concerned. Connections between FEPs in different drawings, on the other hand, are achieved by inserting lines from the FEPs concerned to the boundary of the drawing (see Figure 6).
The power of SPARTA lies in the supporting databases which store information on FEPs and Influences as well as incorporating links to more detailed documents, e.g. detailed FEP descriptions contained in a FEP Encyclopaedia (Miller et al., 1998). The code also allows searches of FEPs and Influences in the form of key words or key fragments of words.
For FEPs, the type of information recorded includes: • FEP title;
• drawing in which FEP is contained;
• description of FEP (with option of hyperlink to FEP Encyclopaedia (Miller et al., 1998);
20
• classification (e.g. geological, hydrogeological, mechanical, chemical/geochemical);
• time dependency, if any.
Near_Field\Silo_section\Waste_package\Transport_and_release_of_radionuclides\Transport_and_release_of_radionuclides.vsd Transport_and_release_of_ radionuclides.vsd (Level 4) Distribution & release of radionuclides Radionuclide sorption Gas-mediated radionuclide transport Radioactive decay & ingrowth Colloid transport L4NFRZCRTr5,Silo-WPTr19(10) L4NFRZCRTr4,Silo-WPTr6(10) L4NFRZCRTr6,Silo-WPTr4(10) L4NFRZCRTr 3 Groundwater-mediated transport of radionuclides Diffusion of radionuclides L4NFRZCRTr1,Silo-WPTr5(10) L4NFRZCRTr7,Silo-WPTr9(10),Silo-WPTr20(10) ASDAS,Silo-WP17(10) ASDSS WEFEE,Silo-WPTr11(10),Silo-W85B(10),Silo-W73B(10) BNMNV,Silo-W75(10),Silo-WP89(10),Silo-WP11(10) ASDASDS,Silo-WPTr1(10) CVBV,Silo-WTr7(10),Silo-WTr5(10),Silo-WTr6(10),Silo-WPTr10(10),Silo-WPTr3(10),Silo-WPTr100(10),Silo-WPTr7(10) SDFDCC,Silo-WPTr14(10) L4NFSWPTr17,Silo-W15(10),Silo-W23(10) L4NFSWPTr16 L4NFSWPTr20,Silo-WP156(10),Silo-WP18(10)
Figure 7 SFR-1 PID: Silo: Waste Package: Transport and release of radionuclides.
Note: Lines extending from FEP boxes to the boundary connect influences from one
drawing to the next; text coding attached to individual lines identifies specific Influences.
• general comments, which may be used for audit purposes; • creator's ID and date and time of FEP creation;
• unique identifiers for database records.
The type of information for Influences is similar to the above, with the exception of classification and time dependency, but with additional input of identifying those FEPs (starting and ending) which are linked.
21
5.3 Construction of SPARTA PID for SFR-1
5.3.1 Stages in Development of Current PID
As is the case for 2D PIDs, the development process is an iterative one, benefiting from feedback from various sources. The original intention had been to "convert" the Business Modeller 2D PID to a 3D version. Thus, the first PID developed using SPARTA contained the same FEP names as the 2D PID, part of which is shown in Annexe I. Subsequently, largely as the result of two Workshops held in 1999, one focusing on the PID (including Influences and Importance Levels), and the other on the use of SPARTA, the structure of the current PID was redefined to show a certain degree of consistency in names among different sections.
Preliminary Importance Levels (IL) were assigned to Influences based on the following arbitrary criteria:
• IL=10: Influence must be included or taken into consideration in the current context;
• IL=2: Influence is not considered important in the current context and can be ignored;
• IL=6: Influence may be important - requires second opinion.
"Current context" in the above criteria refers to the reference case Central Scenario in which only the expected evolution of the repository system is addressed.
The current PID with Importance Levels for Influences has not been formally audited. Rather, individual sections of the PID were examined by external reviewers familiar with Process System Models and the use of PIDs.5
5.3.2 Presentation of the Current PID
The drawings of the current PID for the SFR-1 repository, comprising full near-field (Silo, BMA, BLA and BTF sections, as well as near-field rock zone and far-field) are contained in Annexe III. The main features of this PID are:
• detailed drawings generated for far-field and near-field components only, the biosphere and external FEPs, or EFEPs, being considered separately;
• a total of 95 drawings;
• a total of 584 "FEPs" (including super-FEPs); • 2100 Influences.
5
Far-field and near-field rock zone: Matt White (QuantiSci); Silo section: David Savage (Quintessa); BMA section: Peter Robinson (QuantiSci); BTF section: Randy Arthur (Monitor Scientific).
22
Although the PID is substantial in terms of the number of FEPs and Influences, closer examination of the individual drawings shows that the structure of individual engineered barriers is similar, making the overall structure more easy to comprehend. Thus, approximately 30 FEPs/super-FEPs exist for each barrier and most of these FEPs are linked in an identical way.
5.4 Comments on Current SPARTA PID
It is appropriate at this stage to provide a few comments on the current PID constructed using SPARTA.
Firstly, it should be re-emphasised that the current PID and its contents have not undergone a formal audit. Rather, sections of the PID have been reviewed in detail combined with the fact that there is a significant overlap between the information contained in the 2D PID, which was audited, and the 3D PID. However, the immediate purpose of the existing PID was as a tool to help identify research and development needs for SKI over a one- to two-year period. In this context, the PID was used successfully at a January Workshop for such a purpose (Stenhouse et al., 2000; also discussed in Section 6).
As stated above, the current PID includes detailed treatment of the near-field and far-field only, in keeping with the scope of the project. Other components of the repository system, which are being treated elsewhere, are the biosphere and EFEPs, or scenario-generating FEPs. For the purposes of the January Workshop, EFEPs relevant to the Central Scenario, i.e. expected evolution of the repository system, were included in the PID.
Some of the FEPs/super-FEPs contained in the existing SPARTA-generated PID have different titles from those used to generate the 2D PID, the latter being listed in Appendices C and F. This situation has arisen primarily because the current PID was created independently of the 2D PID and is no longer an exact representation of the original PID. In addition, as a result of discussions at the various Workshops (2 in 1999, 1 in 2000), it was recognised that, particularly for cementitious barriers, some additional, more detailed FEP titles were desirable, particularly for the cementitious barriers, to ensure that specific processes were treated, e.g. Sulphate attack (on cement) and Degradation of superplasticisers (effect on Release and transport of radionuclides). Thus, the current near-field and far-field FEP lists are shown in Appendices I and J, with FEPs identified either as true FEPs or groups of FEPs.
23
6 Summary of Project
Two detailed PIDs have been prepared as part of the performance assessment of the SFR-1 repository. Each diagram provides a different representation of the near-field and far-field of the repository system; the first PID being two-dimensional and the later one three-dimensional. Despite the different approaches, the primary objective of constructing each PID has been the same: to ensure firstly, that all features, events and processes relevant to the future evolution of the repository system are considered, and secondly, that all "essential" Influences are identified so that they may be incorporated in some form in the modelling of the system’s evolution.
As mentioned in Section 5.4, the 3D PID was used at an SFR-1 Safety Assessment Workshop held in January, 2000 (Stenhouse et al., 2000), to guide the Rock and Vault Clearing Houses - groups of experts focussing on specific parts of the repository system. The objective of this Workshop was to identify key issues which needed to be considered in depth prior to performance assessment calculations. Each Clearing House was expected to:
• scope the information available within their area of responsibility;
• identify key questions and issues currently relating to SFR-1 safety (known uncertainties);
• review activities to be undertaken (review/scoping calculations/in-depth treatments);
• allocate review tasks and timetable;
• indicate and scope the relevant R&D required to address the key questions and issues;
• define any input requirements from other Clearing Houses.
The SPARTA-generated PID provided a successful basis by which the Rock and Vault Clearing Houses structured these tasks.
6.1 Recommendations
Currently, because of time constraints, the information contained in SPARTA's database for the SFR-1 PID is limited to the basic input required by SPARTA, together with a few, select comments on FEP descriptions. External review and an understanding/appreciation of the PID would therefore benefit from entries in the additional descriptive data fields accommodated by SPARTA. In addition, hyperlinks embedded in the FEP input information within the SPARTA PID, would allow links to individual FEP descriptions in the FEP Encyclopaedia, thereby enhancing the usefulness of the PID. These additions would allow the full potential of the new software to be realised.
24
With regard to other repository systems, owing to the amount of preparative work carried out prior to constructing the PIDs, i.e. FEP identification, compilation and selection, much of the information base is available for transfer to other repository systems, particularly where cementitious barriers are a significant component. In this context, the 3D PID for SFR-1 can be readily adapted to the deep repository for spent nuclear fuel, SFL 2, and to the deep repository for long-lived low- and intermediate-level waste, SFL 3-5.
25
References
Andersson J (ed.) (1989). The joint SKI/SKB scenario development project. SKI Technical Report 89:14, Stockholm, Sweden.
Andersson J, Barrdahl R, Hägg C, Jensen M, Sandin A-C, Sundström B and Wingefors S (1994). Evaluation of SKB's in-depth safety assessment for SFR-1. SKI Technical Report 94:30, Stockholm, Sweden.
Chapman N A, Andersson J, Robinson P, Skagius K, Wene C-O, Wiborgh M and Wingefors S (1995). Systems analysis, scenario construction & consequence analysis definition for SITE-94. SKI Technical Report 95:26, Stockholm, Sweden.
Cranwell R M, Guzowski R V, Campbell J E and Ortiz N R (1982). Risk methodology for geologic disposal of radioactive waste: scenario selection procedure. Sandia National Laboratory Report SAND80-1429, NUREG/CR-1667, Albuquerqe, New Mexico.
Eng T, Hudson J, Stephansson O, Skagius K and Wiborgh M (1994). Scenario development methodologies. SKB Technical Report TR 94-28, Stockholm, Sweden. Goodwin B W (1991). (ed.) Scenario analysis for the post-closure assessment of the Canadian concept for nuclear fuel waste disposal. AECL draft report 91/07/25. Subsequently published as AECL-10717, COG-93-7, Pinawa, Canada.
Hodgkinson D P and Sumerling T J (1989). A review of approaches to scenario analysis for repository safety assessment. In Safety Assessment of Radioactive Waste Repositories, Proc. NEA/IAEA/CEC Symposium, Paris 1989. NEA/OECD, Paris, France.
IAEA (1981). Safety Assessment for the Underground Disposal of Radioactive Wastes. IAEA Safety Series No. 56, Vienna, Austria.
Jack, J.P. and Hillier, J.E. (1999). Sparta User Guide, Sparta Version 2, QuantiSci Report SKI-6145A-1, Version 1.1.
Miller W M and Chapman N A (1992).(eds.) Identification of relevant processes. System Concept Group. UK DoE/HMIP Technical Report TR-ZI-11.
Miller, W.M.M. Savage, D., McEwen, T.J., McLeod, R. and White, M.J. (1999). Encyclopaedia of Features, Events & Processes (FEPs), Volume One, QuantiSci Report SKI-6141 Version 1, February 1999, QuantiSci.
Nagra (1994). Kristallin I: Safety Assessment Report. Nagra Technical Report NTB
26
NEA (1992). Systematic Approaches to Scenario Development: Safety Assessment of Radioactive Waste Repositories. Report of the NEA Working Group on the identification and selection of scenarios for the safety assessment of radioactive waste disposal. NEA/OECD, Paris, France.
Project Gewähr (1985). Nuclear waste management in Switzerland: feasibility studies and safety analyses. Nagra Project Report NGB 85-09, Wettingen, Switzerland.
Stenhouse M J and Chapman N A (1998). System studies in PA: Development of Process Influence Diagram (PID) for SFR Repository: Silo Near-Field. QuantiSci Report to SKI, SKI-6046A-GEN, Version 1, February 1998.
Stenhouse M J, Chapman N A and Sumerling T J (1993). Scenario development FEP audit list preparation: methodology and presentation. SKI Technical Report 93:27, Stockholm, Sweden.
Stenhouse M J, Chapman N A and Miller W M (1998). System studies in PA: Development of Process Influence Diagram (PID) for SFR-1 Repository: Near-Field + Far-Field. QuantiSci Report to SKI, SKI-6144/T1-1, Version 1, May 1998.
Stenhouse, M.J., Chapman, N A and Lind, A. (2000). Summary Notes of SFR-1 Workshop on SKI's Review of SKB SFR-1 Safety Assessment Project SAFE, held Vår Gård, Sweden, January 26-28, 2000. Monitor Scientific Report MSCI-9916-1 to SKI. Stenhouse M J and Chapman, N A (2001). System Studies in PA: Development of Process Influence Diagram (PID) for SFR-1 Repository using SPARTA: Near-Field + Far-Field. Monitor Scientific Report to SKI, SKI-9916-3, April 2001.
Thorne, M.C. (1992): Dry Run 3. A trial assessment of underground disposal of radioactive wastes based on probabilistic risk analysis. Volume 8: Uncertainty and bias audit. U.K. Department of the Environment Report DoE/HMIP/RR/92.040. London, U.K.
Wiborgh M (1995). (ed.) Prestudy of final disposal of long-lived low and intermediate level wastes. SKB Technical Report TR 95-03, Stockholm, Sweden.
27
Appendix A: Compilation of Near-Field
FEPs from International FEP List
FEPs from the following lists appear in this appendix (corresponding code in parentheses)6:
• Atomic Energy of Canada Ltd. (AECL): spent fuel disposal; Goodwin et al. (1991).
• Department of the Environment, U.K. (DOE): L/ILW waste disposal; Thorne (1992).
• International Atomic Energy Agency (IAEA): IAEA (1981).
• Nagra, Switzerland (PGA): vitrified HLW disposal; Project Gewähr (1985). • SKI/SKB (SKI): spent fuel disposal; Andersson (1989).
• Sandia National Laboratories, U.S.A. (SNL): HLW disposal; Cranwell et al. (1982).
• U.K. Nirex Ltd. (UKN): L/ILW disposal; Hodgkinson and Sumerling (1989). • Department of the Environment, U.K. (HMIP); L/ILW disposal; Miller and
Chapman (1992).
• Nagra Kristallin I (NAGRA): vitrified HLW disposal; Nagra (1994).
6
A list of over 1500 FEPS was compiled in Stenhouse et al. (1993). In this compilation, the FEP list of Nuclear Energy Agency (NEA, 1992) was included, but is identical to that of U.K. Nirex Ltd. (UKN) above. This current, reduced set of near-field FEPs does not include FEPs from the list prepared by Eng et al. (1994), which was compiled but used only for comparison purposes.
28
CODE Screen FEP NAME SEE
AECL1.1 P Backfill characteristics AECL1.2 T Backfill evolution
AECL1.3 R Biological activity DOE1.6.6 AECL1.4 ? Boundary conditions
AECL1.5 sub Buffer additives AECL1.6 AECL1.6 P Buffer characteristics
AECL1.7 T Buffer evolution
AECL1.8 R Cave ins DOE1.4.4
AECL1.9 V Chemical gradients
AECL1.10 Chemical interactions (expected) AECL1.11 T Chemical interactions (long-term) AECL1.12 ? Chemical interactions (other) AECL1.13 T Chemical kinetics
AECL1.14 E Climate change AECL1.15 Colloids
AECL1.16 Complexation by organics AECL1.17 V Concrete
AECL1.18 Container corrosion products AECL1.19 T Container failure (early) AECL1.20 T Container failure (long-term)
AECL1.21 ? Container failure (other long-term processes) AECL1.22 Container healing
AECL1.23 sub Containers - partial corrosion AECL1.24 Convection
AECL1.25 ? Correlation
AECL1.26 R Corrosion DOE1.1.1 AECL1.27 ? Coupled processes
AECL1.28 R Criticality DOE1.3.2 AECL1.29 Diffusion
AECL1.30 Dispersion AECL1.31 E Earthquakes
AECL1.32 Electrochemical gradients
AECL1.33 R Evolution of buffer AECL1.7 AECL1.34 Excessive hydrostatic pressures
AECL1.35 E Explosions
AECL1.36 E Faulty buffer emplacement AECL1.37 Formation of cracks
AECL1.38 R Formation of gases DOE1.2 AECL1.39 ? Galvanic coupling
AECL1.40 Geochemical pump AECL1.41 E Glaciation AECL1.42 E Global effects AECL1.43 P Hydraulic conductivity AECL1.44 P Hydraulic head AECL1.45 ? Hydride cracking AECL1.46 NR Hydrothermal alteration
29
CODE Screen FEP NAME SEE
AECL1.47 E Improper operation AECL1.48 E Incomplete closure
AECL1.49 E Incomplete filling of containers AECL1.50 ? Interfaces (boundary conditions) AECL1.51 E Intrusion (animal)
AECL1.52 E Intrusion (human) AECL1.53 P Inventory
AECL1.54 P Other wastes (other than vitrified HLW) AECL1.55 T Long-term physical stability
AECL1.56 ? Long-term transients AECL1.57 ? Methylation
AECL1.58 R Microbes DOE1.6.6
AECL1.59 R Microorganisms DOE1.6.6 AECL1.60 E Monitoring and remedial activities
AECL1.61 ? Mutation
AECL1.62 E Percolation in shafts
AECL1.63 sub Pitting DOE1.1.1 AECL1.64 E Preclosure events
AECL1.65 R Precipitation and dissolution DOE1.6.5 AECL1.66 Pseudo-colloids
AECL1.67 Radiation damage
AECL1.68 R Radioactive decay DOE1.3.1 AECL1.69 Radiolysis
AECL1.70 E Recharge groundwater AECL1.71 Reflooding
AECL1.72 E Retrievability
AECL1.73 E Sabotage and improper operation AECL1.74 T Seal evolution
AECL1.75 Seal failure
AECL1.76 R Sorption DOE2.4.5
AECL1.77 sub Sorption: non-linear AECL1.78 Source terms (expected) AECL1.79 ? Source terms (other)
AECL1.80 Speciation DOE1.6.5 AECL1.81 ? Stability
AECL1.82 H Stability of glass AECL1.83 NR Swelling pressure
AECL1.84 ? Temperature rises (unexpected effects) AECL1.85 T Time dependence
AECL1.86 R Transport in gases or of gases DOE2.4.11 AECL1.87 ? Uncertainties
AECL1.88 sub Uniform corrosion DOE1.1.1 AECL1.89 ? Unmodelled design features
AECL1.90 R Unsaturated transport DOE1.5.2 AECL1.91 ? Vault geometry
30
CODE Screen FEP NAME SEE
DOE1.1.1 Structural container metal corrosion
DOE1.1.1.1 sub Structural container metal corrosion: Localised DOE1.1.1.2 sub Structural container metal corrosion: Bulk DOE1.1.1.3 sub Structural container metal corrosion: Crevice
DOE1.1.1.4 sub Structural container metal corrosion: Stress corrosion cracking
DOE1.1.2 Physical degradation of concrete
DOE1.1.2.1 sub Cracking DOE1.1.2.2 sub Sealing of cracks DOE1.1.2.3 sub Pore blockage
DOE1.1.2.4 sub Alkali-aggregate reaction DOE1.1.2.5 sub Cement-sulphate reaction
DOE1.1.3 Chemical degradation of concrete
DOE1.1.3.1 sub Changes in pore water composition, pH, Eh DOE1.1.3.2 sub Exchange capacity exceeded
DOE1.1.3.3 sub Alkali-aggregate reaction DOE1.1.3.4 sub Cement-sulphate reaction
DOE1.1.4 H Degradation of wastes (vitrified glass)
DOE1.1.4.1 sub Metal corrosion DOE1.1.4.2 sub Leaching
DOE1.1.4.3 sub Complex formation DOE1.1.4.4 sub Colloid formation
DOE1.1.4.5 sub Microbial degradation of organic wastes DOE1.1.4.6 sub Microbial corrosion
DOE1.1.4.7 sub Radiolysis
DOE1.2.1 Hydrogen [production] by metal corrosion
DOE1.2.1.1 sub Structural steel DOE1.2.1.2 sub Container steel DOE1.2.1.3 sub Waste steel DOE1.2.1.4 sub Waste Magnox DOE1.2.1.5 sub Waste aluminium DOE1.2.1.6 sub Waste Zircalloy DOE1.2.1.7 sub Waste other metals
DOE1.2.1.8 sub Effects of microbial growth on concrete
DOE1.2.2 Methane and carbon dioxide [production] by microbial degradation
DOE1.2.2.1 sub Cellulosics
DOE1.2.2.2 sub Other susceptible organic materials DOE1.2.2.3 sub Aerobic degradation
DOE1.2.2.4 sub Anaerobic degradation DOE1.2.2.5 sub Effects of temperature DOE1.2.2.6 sub Effects of lithostatic pressure
DOE1.2.2.7 sub Effects of microbial growth on properties of concrete DOE1.2.2.8 sub Effects of biofilms
DOE1.2.2.9 sub Effects of hydrogen from metal corrosion DOE1.2.2.10 sub Inhibition due to the pressure of toxic materials DOE1.2.2.11 sub Carbonate/bicarbonate exchange with concrete DOE1.2.2.12 sub Energy and nutrient control of metabolism DOE1.2.2.13 sub Effects of radiation on microbial populations DOE1.2.3 Gas generation from concrete
31
CODE Screen FEP NAME SEE
DOE1.2.4 Active gases
DOE1.2.4.1 sub Tritiated hydrogen
DOE1.2.4.2 sub Active methane and carbon dioxide DOE1.2.4.3 sub Other active gases
DOE1.2.5 Toxic gases
DOE1.2.6 Gas transport
DOE1.2.6.1 sub In the waste container
DOE1.2.6.2 sub In the vaults between containers DOE1.2.6.3 sub Between vaults
DOE1.2.6.4 sub In the near-field, including up and around access shafts and adits DOE1.2.6.5 sub Into and through the far-field
DOE1.2.7 Flammability
DOE1.2.7.1 sub Fires DOE1.2.7.2 sub Explosions
DOE1.3.1 Radioactive decay and ingrowth DOE1.3.2 Nuclear criticality
DOE1.4.1 Canister or container movement DOE1.4.2 Changes in in situ stress field DOE1.4.3 Embrittlement
DOE1.4.4 Subsidence/collapse
DOE1.4.4.1 sub Repository induced DOE1.4.4.2 sub Natural
DOE1.4.5 Rock creep DOE1.4.6 Fracturing
DOE1.5.1 Changes in moisture content
DOE1.5.1.1 sub Due to dewatering DOE1.5.1.2 sub Due to stress relief
DOE1.5.2 Groundwater flow (unsaturated conditions)
DOE1.5.2.1 sub Initial conditions DOE1.5.2.2 sub Due to gas production
DOE1.5.3 sub Groundwater flow (saturated conditions)
DOE1.5.4 Transport of chemically active substances into the near-field
DOE1.5.4.1 sub Inorganic ions DOE1.5.4.2 sub Humic and fulvic acids DOE1.5.4.3 sub Microbes
DOE1.5.4.4 sub Organic complexes DOE1.5.4.5 sub Colloids
DOE1.6.1 V Differential elastic response DOE1.6.2 V Non-elastic response
DOE1.6.5 Chemical changes
DOE1.6.5.1 sub Metal corrosion DOE1.6.5.2 sub Concrete degradation DOE1.6.5.3 sub Waste degradation DOE1.6.5.4 sub Gas production DOE1.6.5.5 sub Complex formation DOE1.6.5.6 sub Colloid production DOE1.6.5.7 sub Solubility DOE1.6.5.8 sub Sorption