Landscape and within-field factors affecting the
damages of the brassica pod midge (Dasineura
brassicae) in Swedish winter oilseed rape
cultivation.
Axel Rösvik
Degree project • 30 hec
Hortonomprogrammet / Horticultural Science Programme Alnarp, Sweden 2019.
Faculty of Landscape Architecture, Horticulture and Crop Production Science
2
Landscape and within-field factors affecting the damages of the brassica pod
midge (Dasineura brassicae) in Swedish winter oilseed rape cultivation.
Landskap- och fältfaktorers påverkan på skadorna av skidgallmygga (Dasineura brassicae) i svensk höstrapsodling.Axel Rösvik
Supervisor: Mattias Larsson, Swedish University of Agricultural Sciences, Department of Plant Protection Biology
Co-supervisor: Peter Anderson, Swedish University of Agricultural Sciences, Department of Plant Protection Biology
Examiner: Helene Larsson Jönsson, Swedish University of Agricultural Sciences, Department of Biosystems and Technology
Credits: 30 hec
Level: Second cycle, A2E
Course title: Master's Thesis Project in Biology Course code: EX0800
Subject: Biology
Programme/education: Hortonomprogrammet / Horticultural Science Programme
Place of publication: Alnarp, Sweden. Year of publication: 2019
Cover picture: Axel Rösvik
Online publication: https://stud.epsilon.slu.se
Keywords: Landscape ecology, Dasineura brassicae, Ceutorhynchus obstrictus, Brassica napus, winter oilseed
rape
Sveriges lantbruksuniversitet
Swedish University of Agricultural Sciences
Faculty of Landscape Architecture, Horticulture and Crop Production Science Department of Plant Breeding
3
Contents
Abstract ... 5
Introduction ... 6
Oilseed rape ... 6
The oilseed rape plant and its growth stages ... 6
Cultivation of oilseed rape ... 7
Insect pests on oilseed rape ... 7
Study organisms ... 7
Brassica pod midge (Dasineura brassicae Winn.) ... 7
Cabbage seed weevil (Ceutorynchus obstrictus) ... 9
The problem with D. brassicae in Sweden ... 9
Landscape factors affecting the study organisms ... 10
Objectives ... 10
Material and methods ... 11
Study region and test localities ... 11
Fieldwork ... 12
Traps ... 12
Survey of damages ... 14
Geographic information system ... 14
Statistics ... 16
Results ... 17
Damages from D. brassicae between- and within-field during early and late pod set ... 17
Geographical variation in damage from D. brassicae ... 18
Trapping system ... 19
Abundance of C. obstrictus and damage from D. brassicae ... 20
Previous year’s area of WOSR and the damages from D. brassicae ... 21
Early pod set ... 21
Late pod set ... 21
Previous year’s area of WOSR and the abundance of C. obstrictus ... 22
Landscape complexity and damage from D. brassicae ... 22
Early pod set ... 22
Late pod set ... 22
Landscape complexity and abundance of C. obstrictus. ... 23
In field- and landscape parameters affecting damages by D. brassicae. ... 25
4
Damages and their within-field spread over the season ... 27
Damages from D. brassicae across the regions ... 28
Trapping systems ... 29
Abundance of C. obstrictus and its effects on damage caused by D. brassicae ... 29
Previous years WOSR and its effects on the study organisms ... 30
Landscape complexity and its effects on the study organisms ... 31
Within field and landscape factors affecting damages from D. brassicae ... 32
Conclusion ... 34
Acknowledgements ... 35
5
Abstract
The brassica pod midge (Dasineura brassicae) has been a serious upcoming problem in Swedish oilseed cultivation during recent years. This small dipteran utilized pods damaged by its facilitator, the cabbage seed weevil (Ceutorynchus obstrictus), to be able to oviposit. The larvae of D. brassicae feed on the inner pod wall, causing the pod to split prematurely and releasing its seeds, which causes yield loss for the farmer. In this study, we investigate how landscape and within-field factors such as previous years percentage of oilseed rape in the landscape, landscape complexity, distance to previous years oilseed rape field, abundance of C. obstrictus and chemical treatments affect the damages caused by D. brasssicae. This was done on 19 locations in Skåne, the southernmost province of Sweden. Yellow pan traps and yellow sticky traps were used to monitor the C. obstrictus
populations. Information on chemical treatments were gathered by contacting the farmers. The landscape parameters where assessed using geographical information systems and data from the Swedish Board of Agriculture and the Swedish Environmental Protection Agency. Our results showed a positive correlation between abundance of C. obstrictus and damages caused by D. brassicae. Both abundance of C. obstrictus and damage from D. brassicae showed a positive correlation with an increasing landscape complexity at a small distance (1000m), C. obstritcus also showed a positive correlation at larger distances (2000-4000m). However, no correlation was found between an increasing percentage of previously cultivated winter oilseed rape and the damages from D.
brassicae or abundance of C. obstrictus. Some regions within the province showed a significantly
higher amount of damage than others; these provinces generally contained a more complex landscape compared to the ones where surveys had shown less damage. Stepwise multiple
regression models with the within-field and landscape factors as independent variables showed that previous year’s percentage of oilseed rape had a positive impact on the damages caused by D.
brassicae during the entire season. In the late pod set, the abundance of C. obstrictus also had a
positive impact on the damages caused by D. brassicae. However, the chemical treatment did not seem to affect the damages caused by D. brassicae in late pod set in any way.
6
Introduction
Oilseed rape
Oilseed rape is one of the four major oil crops of the world together with palm oil, sunflower and soybean and is considered an important crop in European crop rotations covering an area of approximately 10.8% of the total arable land in Europe in 2014 (FAO 2017; Bunting 1986; Eurostat 2015). It consists of three distinct species belonging to the Brassicaceae family (Lamb 1989). Two of these species, Brassica napus and Brassica rapa are widely cultivated in Europe, New Zealand, Australia and Canada while the third species, Brassica juncea, is widely grown in Asia together with B.
rapa (Kumar et al. 2015). The two species grown in Europe have different ancestry, B. rapa was
domesticated in central Asia while B. napus was domesticated in southern Europe (Lamb 1989). The oilseed rape native to Europe, B. napus, is thought to be a result of a hybridization of turnip rape (Brassica rapa) and cabbage (Brassica oleracea) as seen in figure 1. No wild form of B. napus is known (U 1935) except to volunteer weeds from previous cultivation (Alford 2008).
Figure 1. U’s triangle illustrating the relationship between different species of Brassica (U 1935) Oilseed rape is mainly grown for its oil content and is used for culinary purposes, lubricants, fuel, synthetic rubber and soap while the residues from the oil extraction process are used for cattle fodder (Alford 2008). The crop has gained popularity in Europe during the 20th century (Bunting 1986). An example of this is the increase in the area of the crop in England were 5000ha were cultivated in 1971 and in just eight years this number rose to 260 000ha which is approximately a 50-fold increase in acreage (Lane 1983; Wheatley and Finch 1984).
The oilseed rape plant and its growth stages
The oilseed rape plant is an annual herbaceous plant with upright branching stems that reach a height of approximately 1-2m. The plant has a long thin tap root, smooth blueish-green waxed leaves with incised margins (Alford 2008). The stems are usually well branched but this can differ between varieties and environmental conditions. Throughout the stem of the plant there are axils where branches develop. These branches terminate in an inflorescence which itself is an elongated raceme with yellow four-petalled flowers in clusters that open from the base to the top of the raceme (Musil 1950). The fruits are green pods called siliques that turn brown when they ripen. They are formed
7
from two united carpels in the ovary. Inside the elongated fruit, there’s a wall (septum) dividing the inside of the fruit into two compartments (locules). Inside these compartments, the seeds develop. The seeds are black and hardy when mature. When the pod is mature, it dehisces from the bottom releasing the seeds (Alford 2008).
Cultivation of oilseed rape
Oilseed rape can be grown as winter oilseed rape (WOSR) that is sown in late summer during August or September and harvested in the summer the following year. It can also be grown as spring oilseed rape (SOSR) and is then sown in the spring and harvested in the summer the same year (Alford 2008). In Europe, winter oilseed rape is the most commonly grown form (Williams 2010). Oilseed rape is usually cultivated in a four-year rotation together with cereals such as winter wheat or winter barley, fabaceous crops such as peas or beans or after the land has been set-aside for a year (Alford 2008). For the WOSR it is important to have an early preceding crop to be able to sow the WOSR in time (Jordbruksverket 2014).
Different soil cultivation techniques are used depending on soil type and weather conditions. In conventional systems, inversion tillage through ploughing is often practiced but other non-inversion methods and reduced tillage operations are also carried out such as discing, rotary cultivation and harrowing (Alford 2008). Non-tillage options such as direct drilling or broadcasting of seed into the stubble of the previous crop are also performed (Alford 2008). A well-drained soil with a pH above 6.0 is preferred for cultivation (Jordbruksverket 2014).
Oilseed rape is heavily dependent on a steady water and nitrogen supply, especially during flowering and early pod development (Kimber and McGregor 1995). Studies by Clarke and Simpson (1978) have shown that in higher rainfall areas in Canada, there was an increase in flowering period and therefore an increase in the number of pods and seeds per pod. With nitrogen supply, applications of nitrogen in the autumn have shown negligible effect whereas spring application of nitrogen increases the yield potential (Mendham et al. 1981; Bilsborrow et al. 1993).
The cultivation of oilseed rape in Sweden has increased massively in the past years and today the acreage of oilseed crops in Sweden is bigger than ever before. In 2017, the preliminary acreage of oilseed rape and turnip rape was 114 800 ha which is an increase in 21 900 ha from 2016 (+26%) (SCB 2017). Of these 114 800 ha of oilseed crop in Sweden, 105 700 ha of the total acreage consists of WOSR (92%) (SCB 2017).
Insect pests on oilseed rape
The massive increase in cultivation of oilseed rape, on both a European and national level, have provided a relatively new environment for the insect community (Lamb 1989; Eurostat 2015; SCB 2017). In Europe, the following six pests are of high economic importance in oilseed rape cultivation: cabbage stem flea beetle (Psylliodes chrysocephala), pollen beetle (Meligethes aeneus), cabbage seed weevil (Ceutorhynchus obstrictus), brassica pod midge (Dasineura brassicae), cabbage stem weevil (Ceutorhynchus pallidactylus) and rape stem weevil (Ceutorhynchus napi) (Williams 2010). In this paper, we will study two of these organisms. The brassica pod midge (Dasineura brassicae) and the cabbage seed weevils (Ceutorhynchus obstrictus) which both are pests that attack the pod of oilseed rape.
Study organisms
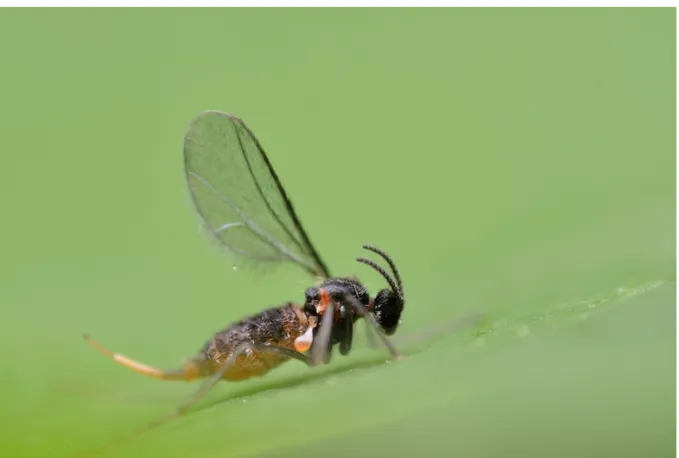
Brassica pod midge (Dasineura brassicae Winn.)
The brassica pod midge (Dasineura brassicae Winn.) is a Dipteran of the gall-forming Cecidomyiidae family, which contains over 5000 known species (Gagné 2004). The adult fly is approximately 0.7-2.2
8
mm long depending on the sex. Females are usually larger than males and have pinkish-red abdomen (figure 2) whereas the male have a yellow-grey abdomen (Sylvén 1949). The antennae of the adult insect are segmented with distinct hairs and resemble a pearl necklace (Alford 2008). D. brassicae is an important pest of oilseed rape and is restricted to Europe (Kimber and McGregor 1995; Bromand 1990).
D. brassicae is multivoltine and can have up to three generations per year when SOSR
is present (Williams et al. 1987). If only WOSR is present, only two generations will occur (Williams et al. 1987). The adult insects emerge from their cocoons from fields were oilseed rape have been previously cultivated (Stephansson and Åhman 1998). This happens in May-June depending on the temperature (Axelsen 1992). The adult insects then mate directly at the emergence site and females migrate from the emergence site to this year’s oilseed crop where she lays her eggs (Stephansson and Åhman 1998). The male and female locate each other at the emergence site through
pheromones released by the female (Williams and Martin 1986). Once the female has migrated and found an oilseed rape field for oviposition she lays eggs in batches of 20-30 in the pods of the oilseed crop (Sylvén 1949). Since the ovipositor of the female is thought to be too weak to bore into the pod she uses already damaged pods for oviposition (Sylvén 1949). These damages are usually feeding damages or larval exit holes from C. obstrictus but could also be from damages caused by wind or fungal disease (Ferguson et al. 1995; Winfield 1992). The larvae that hatch from the egg then start to feed on the inner pod wall which leads to the pod splitting prematurely, releasing the larvae that drop to the ground and burrow into the soil where they spin their cocoons (Sylvén 1949). The development from egg to adult usually takes between 2-4 weeks (Stephansson and Åhman 1998; Sylvén 1949).
Figure 2. The picture shows an adult female D. brassicae with an extended ovipositor (“Dasineura
9
Cabbage seed weevil (Ceutorynchus obstrictus)
The cabbage seed weevil (Ceutorhynchus obstrictus) is a Coleopteran pest in the family
Curculionidae. The adult individual is approximately 2-3 mm long with a conspicuous rostrum and a lead-grey body with black legs and a two-lined row of white hairs between its longitudinal furrows on its elytra as seen in figure 3 (Alford 2008). The cabbage seed weevil occurs in both Europe and North America where it is a pest on oilseed crops, and as described by its name it infests the pods of the oilseed crop and consumes the seeds (Kimber and McGregor 1995).
C. obstrictus is univoltine and oligophagous on Brassica species (Dosdall and Mason
2010). The adult individuals overwinter in perennial vegetation and leaf litter and then emerge from their overwintering site during the flowering stage of the WOSR (Alford 2008). This usually happens around May-June when temperatures exceed 13-15°C (Free and Williams 1979). The adult individuals then feed on the flowers, buds, stem tips and pods of the WOSR (Williams and Free 1978). The feeding on the pods from the adult individuals of C. obstrictus is one type of damage caused to the pods that is used by D. brassicae for oviposition (Ferguson et al. 1995). When the adult individuals of
C. obstrictus first reach the WOSR field the females are not ready to mate; the mating takes place
only after two weeks of feeding within the field (McCaffrey et al. 1991). After mating, the females lay eggs in the pods of the WOSR; usually the female lays one egg per pod and then marks it with an oviposition deterring pheromone to deter other conspecific females to oviposit in the same pod (Ferguson et al. 1999). The egg then hatches after one to two weeks and the first instar larva starts feeding on the seeds of the WOSR for 2-5 weeks, going through 3 larval instars before eating its way out of the pod and dropping to the ground for pupation (Dmoch 1965). The exit hole created by the larvae of C. obstrictus is another type of damage caused to the pod that is used by D. brassicae for oviposition (Hughes and Evans 2003). The pupae stay in the ground for 11-24 days before the upcoming generation emerges (Dmoch 1965). This generation feeds for a brief period in the WOSR crop before finding an overwintering site and entering diapause (Alford 2008).
Figure 3. The left picture shows an adult C. obstrictus stuck in a yellow sticky trap while the right picture shows two C. obstrictus mating in a B. napus flower (Photo: Axel Rösvik).
The problem with D. brassicae in Sweden
During the early years of oilseed production in Sweden, from the 1940’s until the 1970’s, D. brassicae was an important pest in oilseed crops (Stephansson and Åhman 1998). From the 1970’s the
10
producers (Stephansson and Åhman 1998). However, in Östergötland during the summer of 1992 there was a massive increase in damages caused by D. brassicae which in the following years declined once again (Gunnarsson 2016a; Stephansson and Åhman 1998). In the cropping season 2015 and 2016 the damage caused by D. brassicae was once again huge (Gunnarsson 2016a; Gunnarsson 2016b). In the southernmost region of Sweden, the overall yield was reduced by 1.5 tonnes per hectare partly due to damage from D. brassicae but also due to drought (Gunnarsson 2016b). During 2015 and 2016, inventories done by the Swedish board of agriculture showed an increase in the number of C. obstrictus in oilseed crops which also increases oviposition friendly pods for D. brassicae (Gunnarsson 2016c). The reason behind this sudden increase in the populations of D.
brassicae and C. obstrictus is not fully understood (Gunnarsson 2016a). However, cultivation of
oilseed rape has according to the Swedish board of agriculture (2017) increased by 12% from 1999 until 2017 and could be an explanation for the increasing pest problem.
Landscape factors affecting the study organisms
It has become clear that the occurrence of species and their population densities depend on
processes at large spatial scales (Tscharntke and Brandl 2004). Pests and natural enemies move over the landscape in search of resources and are therefore affected by the landscape matrix (Petit 2009; Tscharntke and Brandl 2004). With the increase in agriculture, formerly heterogeneous landscapes have turned into more monotonous landscapes which has a negative effect on natural enemies and the natural control of pest populations (Kareiva 1990; Thies and Tscharntke 1999). With pests such as
C. obstrictus and D. brassicae, which are both dependent on oilseed brassicas to fulfill their life cycle,
a more monotonous landscape with intense cultivation of the host crop could therefore theoretically increase their abundance (Hokkanen 2000). Previous studies on pests of oilseed rape have shown a positive correlation between the percentage of oilseed rape being cultivated in the surrounding landscape and the abundance of pests such as stem weevils (Zaller et al. 2008a). However, in the case of D. brassicae and C. obstrictus, no such positive correlation has been found, to my knowledge. Instead, studies have shown that both D. brassicae and C. obstrictusseem to have a negative
correlation with the percentage of oilseed rape in the surrounding landscape and a positive relationship with an increasing percentage of woody areas (Frank et al. 2008; Zaller et al. 2008b). Since C. obstrictus is dependent on perennial vegetation and leaf litter for overwintering (Alford 2008), woody areas, or areas with higher heterogeneity, could therefore be equally important to this organism as the abundance of oilseed rape.
Objectives
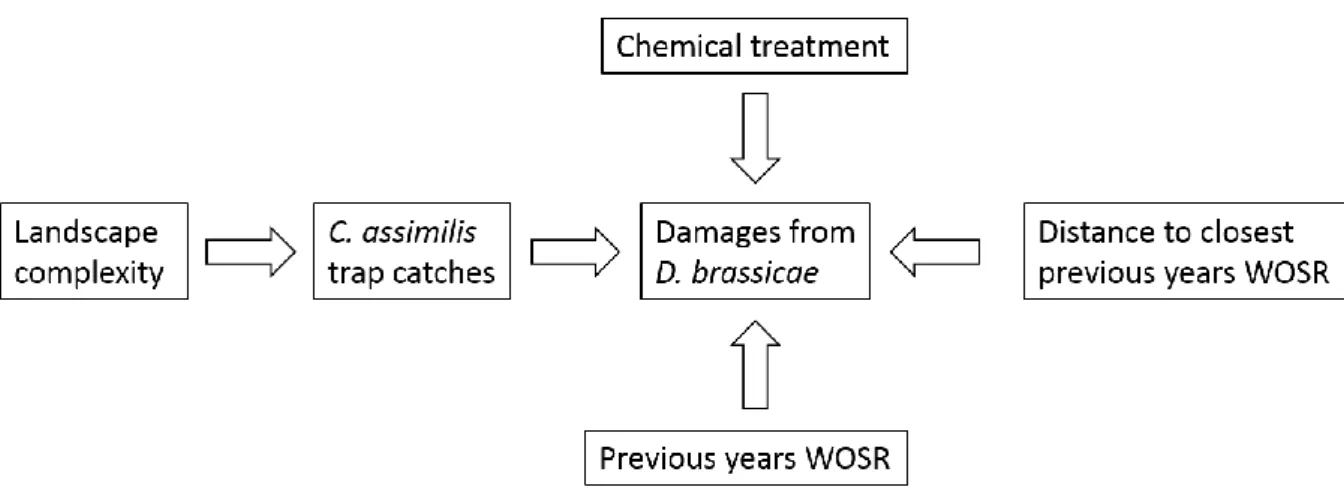
In this study, I will investigate whether within-field and landscape parameters such as landscape complexity, previous year’s cultivation of winter oilseed rape in the landscape, chemical treatments, distance to closest previous year’s winter oilseed rape field and abundance of weevils will affect the damages caused by D. brassicae in winter oilseed rape in the southernmost region of Skåne in Sweden.
I have hypothesized, according to previous knowledge regarding the life cycle of the studied organisms and their relationships with the surrounding landscape, that the following factors may be relevant (figure 4)
11
Figure 4. Flowchart of hypothesized variables that may affect the damages caused by D. brassicae in WOSR.
Based on these relationships, I posit the following questions and hypotheses:
1. How does the damage from D. brassicae at the field borders relate to the damage 20m into the field (which potentially will cause greater yield losses) and what is the relationship between damage in early season and damage in late season?
2. Are there any differences between the damages from D. brassicae geographically across the region?
3. There will be a correlation between the number of C. obstrictus caught in two different trapping systems: yellow pan traps and yellow sticky traps.
4. There will be a positive relationship between the abundance of C. obstrictus and the damages from D. brassicae.
5. What is the relationship between the area of WOSR from previous year and damages from D.
brassicae in a 1000-4000m radius from the current WOSR field?
6. What is the relationship between the area of WOSR from previous year and presence of C.
obstrictus in a 1000-4000m radius from the current WOSR field?
7. Is there any connection between the landscape complexity and the abundance of C.
obstrictus in a 1000-4000m radius from the current WOSR field?
8. Is there any connection between the landscape complexity and the damages from D.
brassicae in a 1000-4000m radius from the current WOSR field?
9. How does in field and landscape parameters such as the abundance of weevils, chemical treatment, amount of WOSR grown previous year in the landscape, landscape complexity, distance to the closest WOSR field, affect the damages caused by D. brassicae?
Material and methods
Study region and test localities
The study was carried out in the summer of 2017 in the region of Skåne in Southern Sweden. The area of the study region is approximately 11000km2 and agricultural land is covering roughly half of the area of the region with an acreage of approximately 5000km2 (SCB 2017). The most common agricultural crops within the region are winter wheat with an acreage of approximately 107 000ha in 2016, spring barley (68 000ha), winter oilseed rape (44 000ha) and sugar beet (29 000ha) (SCB 2017). Other oilseed crops such as spring oilseed rape, winter turnip rape, spring turnip rape and flax are of minor importance to the region with acreages ranging from 25ha-300ha (SCB 2017). Skåne has an
12
average temperature ranging from 15 − 17°C in the month of July, annual precipitation lies around 500 − 1000mm according to The Swedish Metrological and Hydrological Institute (SMHI 2016).
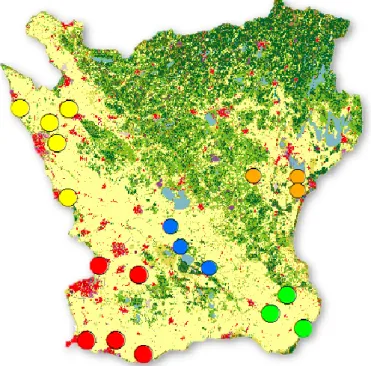
Farmers were primarily chosen from a geographical point of view to get an even spread of test fields throughout the region. The size of the farm and the field were the study was carried out was not taken into consideration when choosing the farms or performing the statistical analysis. The northwestern part of the region (yellow circles in figure 5) and the southwestern part of the region (red circles in figure 5) had five localities each while central region (blue circles in figure 5), northeastern region (orange circles in figure 5) and southeast region (green circles in figure 5) had three localities respectively. At the end of the growing season the farmers were once again contacted and information was gathered regarding the number of insecticide sprays that had been carried out in the test localities during the spring and summer of 2017. Number of insecticide sprays during the spring and summer varied from 0-2 over the 19 localities and were carried out in full bloom or at the beginning of the formation of the pods before the survey of the damages caused by D. brassicae started. Information about chemical substance, target insects and specific dates when the chemical treatments were carried out were not gathered.
Figure 5. Map of the study region Skåne with the WOSR localities highlighted with circles. The colours of the circles indicate the geographical locations the localities were divided into. Localities in the northwestern part of the region are indicated with yellow circles, northeastern part with orange circles, southwestern part with red circles, central part with blue circles and southeastern part with green circles. The map is produced in ArcGIS software (ESRI, Redlands, CA).
Fieldwork
Traps
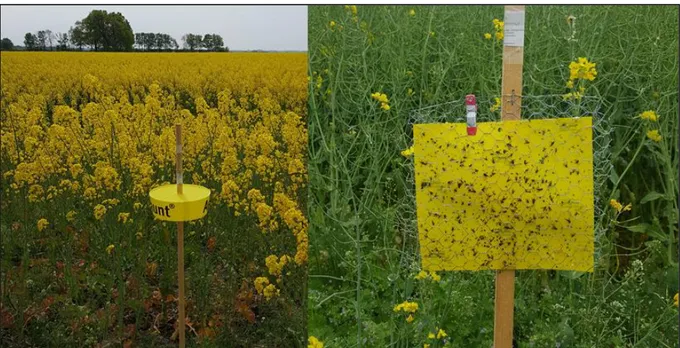
In each of the test fields, four yellow sticky traps (20 x 25cm) from Borregaard BioPlant were placed on wooden sticks at the height of the canopy of the crop and covered with protective netting to reduce the risk of catching unwanted animals (figure 6). The traps were put out in the field borders facing north, west, south and east (figure 7). Yellow pan traps were placed on sticks and filled with a mixture of water and soap and placed in the northern and southern borders of each field (figure 6).
13
Both traps were put at the height of the canopy of the crop. The sticky traps were changed and the pan traps emptied and refilled on a weekly basis. The last round of visits to the traps was somewhat delayed for up to two weeks. The first setup of the traps varied between the locations from the 3rd of May until the 15th of May while the last depletions of the traps varied between the 2nd of June to the 16th of June. This period with traps present in the field was chosen after the phenology of the crop. The trapping started in the flowering of the crop and ended when around 30% of the pods had reached their final size.
When changed, the sticky traps were covered with plastic film while the contents of the yellow pan traps were sieved and stored in ethanol (70%). Both sticky traps and yellow pan trap catches were refrigerated until the catches were analyzed. Catches done by the traps were analyzed by counting the total number of weevils per trap catch. For the analysis of the sticky traps, a grid was sketched out on a piece of plastic paper to make it easier to visualize and not recount already
counted weevils. In the case of the yellow pan traps, the contents were sieved through a tea filter and put in a petri dish with some water. Weevils were then separated from the rest of the insects and identified and counted under a stereo microscope. In both the sticky traps and the yellow pan traps, only C. obstrictus was counted. Identification of C. obstrictus was done with a key by Lindroth (1993).
Since the traps were put in the field on different dates and not emptied regularly during the entire season the number of weevils per day at the locations was calculated rather than the total amount of weevils per location.
Figure 6. The two different traps used in the study. The picture to the left shows a yellow pan trap in a WOSR field in full bloom while the picture to the right shows a sticky trap in a WOSR in the end of the flowering and the early stage of pod set (Photo: Axel Rösvik).
14
Figure 7. Field of WOSR (field with red circle) with traps located in field borders (green and blue circles). Green circles indicate yellow sticky traps while the blue circles indicate yellow pan traps. Yellow fields around this year’s WOSR field indicate the previous year’s WOSR field. The figure is created with ArcGIS (ESRI, Redlands, CA).
Survey of damages
Surveying the damages by D. brassicae was done according to a protocol by the Swedish Board of Agriculture (SBOA) but with some minor adjustments. According to the protocol by SBOA, two locations in every field would normally be checked for damages. At these two locations, the edges and 20m into the crop would be checked. The parts of the plant that is controlled are the main inflorescence, secondary inflorescence and the third inflorescence. During the survey, the total number of pods are counted and then checked for damages, which gives a percentage of damaged pods per plant. On both locations, 20 plants are checked.
In the adjusted protocol that was followed in this study, the survey was carried out in the field edge at the locations of the traps and 20m into the field from the field edge at all four trap locations. Because of this, the total amount of plants checked at every location in the field had to be reduced to five plants per location. This led to a total amount of 20 plants being surveyed in the edges and 20 plants 20 meters into the field in all the 19 fields. Surveys of damages were carried out two times. The first survey was done in early pod set between the 5th of June and the 16th of June while the second survey was carried out in late pod set from the 5th of July until the 14th of July. BBCH of the crop was 69-73 in the first survey and 78+ in the second survey (Lancashire et al. 1991).
Geographic information system
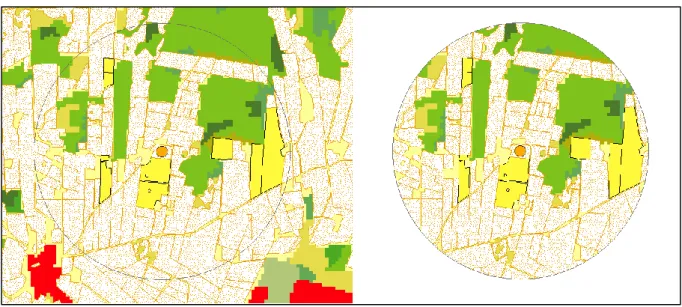
Information on the spatial arrangement of winter oilseed rape from the previous cropping season in 2016 was accessed via the Integrated Administration and Control System (IACS, Blockdatabasen), administered by SBOA. Coordinates from the center of each test field were put into ArcGIS software (ESRI, Redlands, CA) and circular buffer zones with a radius of 1000m, 2000m, 3000m and 4000m were created with the center of the test field being the center of the buffer zone (figure 8). The
15
buffer zones were then intersected and the data was converted from ArcGIS software (ESRI,
Redlands, CA) to Microsoft Excel where the percentage of winter oilseed rape within the four circles was calculated for every location. Unfortunately, no data on this year’s percentage of WOSR was available at the time this thesis was written and therefore not included.
Distance from the nearest previous year’s winter oilseed crop to the center of this year’s test fields was also calculated in all the test fields with the measuring tool in ArcGIS (ESRI, Redlands, CA). Spring oilseed rape was ruled out of the calculation because of its minor importance in the region studied (SCB 2017).
Figure 8. Orange dot indicating the center of the field where WOSR is being cultivated in 2017. Yellow fields indicate fields where WOSR has been cultivated in the previous year (𝑊𝑂𝑆𝑅−1). To the left we see a 2km buffer zone around the center of the field. On the right, the excess area has been removed from the buffer zone (ESRI, Redlands, CA).
Swedish groundcover data (SMD) over the region of Skåne based on the European classification system CORINE land cover was accessed via the Environmental protection agency. In this database, ground cover data on land usage from 1999-2001 is divided into 58 different classes which are accessible by the user (Naturvårdsverket 2014). Out of these 58 classes, 22 were used to display landscape complexity within a 1000m, 2000m, 3000m and 4000m radius from the study field (table 1). Percentage of these landscape types within the circular area around the study field was summed and used to explain the complexity of the landscape.
Table 1. Landscape types and their SMD codes included in the calculation of landscape complexity.
SMD code Landscape type
1425 Non-urban park 231 Pasture 3111, 3112, 3113 Deciduous forest 31211, 312121, 312122, 3122, 3123, 31212 Coniferous forest 3131, 3132, 3133 Mixed forest 321 Natural grassland 322 Heath 3241 Scrub
16 3243 Young forest 3211 Grass heath 3212 Meadow 411 Wetland 511 Watercourse
Statistics
The relationship between the damages caused by D. brassicae in field border and damages 20m into the field and the relationship between damage in early and late pod set was answered by performing Spearman correlation tests.
Geographical differences in damages from D. brassicae across the region was tested with a one-way ANOVA. Surveys on damages from D. brassicae from different geographical locations located northwest, northeast, southwest, southeast and in the center of the region studied where tested against each other at the field border and 20m into the field at early and late pod set. No post hoc test was carried out due to the small number of replicates.
Correlation between trap catches was assessed with a Spearman correlation test. The relationship between the abundance of C. obstrictus and the damages caused by
D. brassicae was assessed with a Spearman correlation test. Trap catches from both sticky traps and
yellow pan traps were computed against the damages estimated in field border and 20m into the field at early and late pod set.
The relationship between the previous year’s area of WOSR and this year’s damages from D. brassicae was tested by performing Spearman or Pearson correlation tests between the percentage of damaged pods in the field border and 20m into the field during early and late pod set against the percentage of WOSR grown previous year (WOSR−1) in the four radiuses 1000m
(WOSR1000m−1 ), 2000m (WOSR2000m−1 ), 3000m (WOSR3000m−1 ), 4000m (WOSR−14000m).
The relationship between the previous year’s area of WOSR and the abundance of C.
obstrictus was tested by performing Spearman correlation tests on the abundance of C. obstrictus
caught in either sticky traps or yellow pan traps against the WOSR−1 in the four radiuses WOSR1000m−1 , WOSR −1 2000m, WOSR −1 3000m and WOSR −1 4000m .
The relationship between the landscape complexity and the abundance of C. obstrictus was tested by performing Spearman correlation tests between the abundance of C. obstrictus in both sticky traps and yellow pan traps against the percentage of the 22 ground cover data used to display landscape complexity in a 1000m (complexity1000m), 2000m (complexity2000m), 3000m
(complexity3000m) and 4000m (complexity4000m) radius.
The relationship between landscape complexity and damages from D. brassicae was tested by performing Spearman correlation tests between the percentage of damaged pods in the field border and 20m into the field during early and late pod set towards the percentage of the 22 ground cover data used to display landscape complexity in a 1000m (Complexity1000m), 2000m (𝐶𝑜𝑚𝑝𝑙𝑒𝑥𝑖𝑡𝑦2000𝑚), 3000m (Complexity3000m) and 4000m (Complexity4000m) radius.
The impact of the landscape and within-field parameters on the damages caused by D.
brassicae was tested with a stepwise multiple regression model with damages caused by D. brassicae
17
WOSR field (WOSRDistance), complexity3000m and chemical treatment (CT) were set as the independent variables for the final model.
Survey data on damages of D. brassicae was log-transformed to attain normal distribution in the data. In all correlation tests, Pearson correlation test was performed when the data met the criteria for normal distribution; when this did not occur Spearman rank correlation was performed. All statistical analysis was performed using R statistical software (R Core Team 2017).
Results
Damages from D. brassicae between- and within-field during early and late pod set
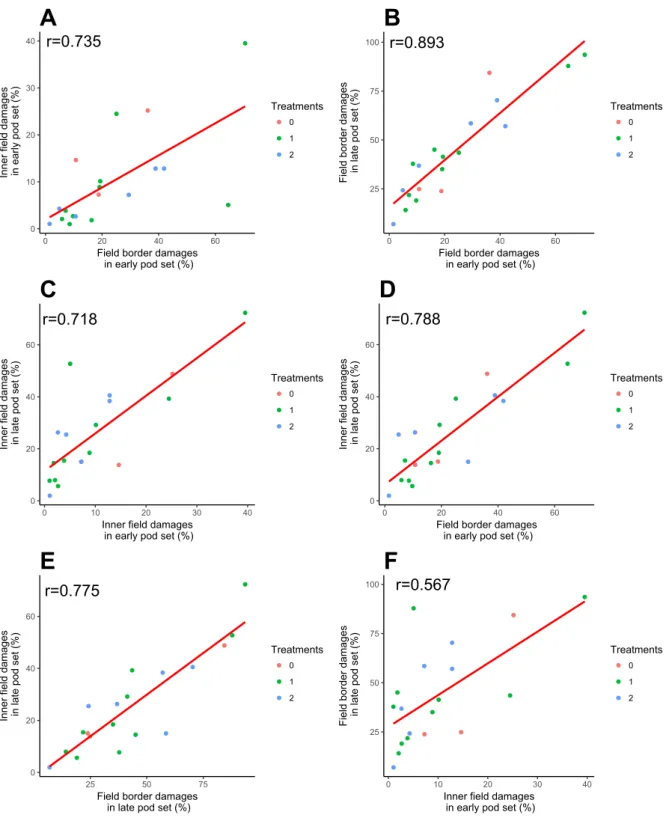
A Spearman correlation test was computed to assess the relationship between the damages in the field borders and 20m into the field during early and late pod set. A positive correlation was found between all combinations: field border damages in early pod set against inner field damages (r=0.735, n=19, p<0.001) (figure 9a), field border damages in early pod set against field border damages in late pod set (r=0.893, n=19, p<0.001) (figure 9b), inner field damages in early pod set against inner field damages in late pod set (r=0.718, n=19, p<0.001) (figure 9c), field border damages in early pod set against inner field damages in late pod set (r=0.788, n=19, p<0.001) (figure 9d), field border damages in late pod set against inner field damages (r=0.775, n= 19, p<0.001) (figure 9e), inner field damages in early pod set against field border damages in late pod set (r=0.567, n=19, p<0.05) (figure 9f).
18
Figure 9. Scatter plots with regression line of the damages in early pod set and late pod set in both field border and inner field (20m). The colour of the dots indicates the number of insecticide sprays during the season.
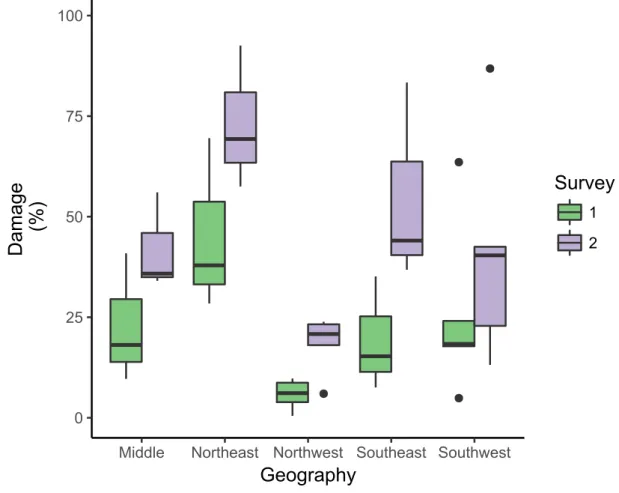
Geographical variation in damage from D. brassicae
A one-way ANOVA was conducted to evaluate the differences in damages by D. brassicae on five geographic locations (northwest, northeast, southwest, southeast and middle). The test computed showed a significant difference in the early pod set survey carried out in the border between the separate locations (figure 10. F(4,14) = 3.99, p < 0.05,∗) and in the late pod set survey carried out
19
in the border between the separate locations (figure 9. F(4,14) = 4.33, p < 0.05,∗). The test showed no significant difference in the early pod set survey carried out 20 meters into the field at the
separate locations ( F(4,14) = 1.087, p > 0.05) or in the late pod set survey carried out 20 meters into the field ( F(4,14) = 1.62, p > 0.05). No post hoc test was performed due to a small number of replicates.
Figure 10. Boxplot showing surveys carried out in the border in early pod set (1) and late pod set (2) plotted against the damage at the different geographical locations; Middle (n=3), Northeast (n=3), Northwest (n=5), Southeast (n=3) and Southwest (n=5). The boxplot shows the median (black line) and 25-75% percentiles. Outliers are indicated by black circles.
Trapping system
A Spearman correlation test was computed to assess the relationship between abundance of C.
obstrictus caught in sticky traps and in yellow pan traps. The test showed a positive correlation
20
Figure 11. Scatter plot with regression line of trap catches from the two different trapping systems. The colour of the dots indicates the number of insecticide sprays during the season.
Abundance of C. obstrictus and damage from D. brassicae
A Spearman correlation test was computed to assess the relationship between the abundance of C.
obstrictus and the damages caused by D. brassicae. Trap catches of C. obstrictus in both sticky traps
and yellow pan traps were assessed against the survey on damage caused by D. brassicae from field borders and 20m into the field during early and late pod set. A positive correlation was found
between the sticky trap and field border damages during early pod set (r=0.581, n=19, p<0.05) (figure 12a), sticky trap and field border damages during late pod set (r=0.707, n=19, p<0.01) (figure 12b), yellow pan trap and field border damages during early pod set (r=0.642, n=19, p<0.01) (figure 12c), and yellow pan trap and field border damages during late pod set (r=0.758, n=19, p<0.001) (figure 12d). No correlation was found between sticky trap and damages 20m into the field during early pod set (r=0.246, n=19, p>0.05) or damages 20m into the field during late pod set (r=0.446, n=19,
p>0.05). Also, no correlation was found in the case of the yellow pan trap and damages 20m into the field during early pod set (r=0.325, n=19, p>0.05) or 20m into the field during late pod set (r=0.405, n=19, p>0.05.
21
Figure 12. Scatter plots with regression line of the yellow pan trap catches and sticky trap catches computed against damages in the field border during early and late pod set. The colour of the dots indicates the number of insecticide sprays during the season.
Previous year’s area of WOSR and the damages from D. brassicae
Early pod set
Pearson and Spearman correlation tests were computed to assess the relationship between the damages from D. brassicae in the field border and inner part of the field during early pod set between the 5th of June and 16th of June and the previous year’s percentage of WOSR in the radius 1000m, 2000m, 3000m and 4000m from the field center. The results showed no correlation between field border damages in early pod set and WOSR1000m−1 (r=0.305, n=19, p>0.05), WOSR−12000m
(r=0.064, n=19, p>0.05), WOSR3000m−1 (r=-0.068, n=19, p>0.05) and WOSR−14000m (r=-0.203, n=19, p>0.05). Neither was there any correlation between the damages 20m into the field and WOSR1000m−1 (r=0.152, n=19, p>0.05), WOSR2000m−1 (r=-0.029, n=19, p>0.05), WOSR−13000m (r=-0.123, n=19, p>0.05) and WOSR4000m−1 (r=-0.276, n=19, p>0.05).
Late pod set
Pearson and Spearman correlation tests were computed to assess the relationship between the damages from D. brassicae in the field border and inner part of the field during late pod set between the 5th of July and the 14th of July and the previous year’s percentage of WOSR in the radius 1000m,
22
2000m, 3000m and 4000m from the field center. The results showed no correlation between the field border damages in late pod set and WOSR1000m−1 (r=0.327, n=19, p>0.05), WOSR2000m−1 (r=0.122, n=19, p>0.05), WOSR−13000m(r=-0.083, n=19, p>0.05) and WOSR4000m−1 (r=-0.148, n=19, p>0.05). Neither was there any correlation between the damages 20m into the field and WOSR1000m−1 (r=0.415, n=19, p>0.05), WOSR−12000m(r=0.281, n=19, p>0.05), WOSR3000m−1 (r=0.006, n=19, p>0.05) and
WOSR4000m−1 (r=-0.094, n=19, p>0.05).
Previous year’s area of WOSR and the abundance of C. obstrictus
A Spearman correlation test was computed to assess the relationship between the abundance of C.
obstrictus and the previous year’s percentage of WOSR in the radius 1000m, 2000m, 3000m and
4000m from the field center. The abundance of C. obstrictus from both sticky traps and yellow pan traps were assessed. C. obstrictus in sticky traps computed against WOSR showed no correlation against the following: WOSR1000m−1 (r=-0.050, n=19, p>0.05), WOSR2000m−1 (r=-0.249, n=19, p>0.05), WOSR3000m−1 (r=-0.302, n=19, p>0.05) and WOSR
−1
4000m (r=-0.232, n=19, p>0.05). Neither was there any correlation between C. obstrictus caught in yellow pan traps and the following WOSR1000m−1 (r=-0.009, n=19, p>0.05), WOSR−12000m(r=-0.305, n=19, p>0.05), WOSR−13000m(r=-0.314, n=19, p>0.05) and WOSR4000m−1 (r=-0.254, n=19, p>0.05).
Landscape complexity and damage from D. brassicae
Early pod set
A Spearman correlation test was computed to assess the relationship between the damages from D.
brassicae in the field border during early pod set and the landscape complexity in a 1000m, 2000m,
3000m and 4000m radius from the field center. The results showed no correlation between the first survey carried out in the border and complexity1000m (r=0.441, n=19, p>0.05), complexity2000m (r=0.214, n=19, p>0.05), complexity3000m (r=0.319, n=19, p>0.05) and complexity4000m (r=0.240, n=19, p>0.05). Neither was there any correlation between the inner part of the field and
complexity1000m (r=0.150, n=19, p>0.05), complexity2000m (r=0.018, n=19, p>0.05), complexity3000m (r=0.233, n=19, p>0.05) and complexity4000m (r=0.219, n=19, p>0.05).
Late pod set
A Spearman correlation test was computed to assess the relationship between the damages from D.
brassicae in the field border during late pod set and the landscape complexity in a 1000m, 2000m,
3000m and 4000m radius from the field center. The results showed a positive correlation between field border damages in late pod set and complexity1000m(r=0.512, n=19, p<0.05) (figure 13), no correlation was found for the following: complexity2000m(r=0.346, n=19, p>0.05),
complexity3000m(r=0.440, n=19, p>0.05) and complexity4000m(r=0.335, n=19, p>0.05). No correlation was found between the inner part of the field and complexity1000m(r=0.240, n=19, p>0.05), complexity2000m(r=0.098, n=19, p>0.05), complexity3000m(r=0.204, n=19, p>0.05) and complexity4000m (r=0.161, n=19, p>0.05).
23
Figure 13. Scatter plot with regression line of the landscape complexity in a 1000m radius plotted against field border damages in late pod set. The colour of the dots indicates the number of insecticide sprays during the season.
Landscape complexity and abundance of C. obstrictus.
A Spearman correlation test was computed to assess the relationship between the abundance of C.
obstrictus and the landscape complexity in the radius 1000m, 2000m, 3000m and 4000m from the
field center. The abundance of C. obstrictus from both sticky traps and yellow pan traps were assessed. C. obstrictus in sticky traps computed against landscape complexity showed a positive correlation against the following: complexity1000m(r=0.563, n=19, p<0.05) (figure
14a), complexity2000m (r=0.637, n=19, p<0.01) (figure 14b), complexity3000m (r=0.605, n=19, p<0.01) (figure 14c) and complexity4000m (r=0.511, n=19, p<0.05) (figure 14d). A positive correlation was also found between C. obstrictus caught in yellow pan traps and the following complexity1000m (r=0.550, n=19, p<0.05) (figure 15a), complexity2000m (r=0.565, n=19, p<0.05) (figure 15b),
complexity3000m(r=0.570, n=19, p<0.05) (figure 15c). No correlation was found between C.
24
Figure 14. Scatter plots with regression line of the landscape complexity in 1000m, 2000m, 3000m and 4000m radius plotted against yellow sticky trap catches. The colour of the dots indicates the number of insecticide sprays during the season.
25
Figure 15. Scatter plots with regression line of the landscape complexity in 1000m, 2000m and 3000m radius plotted against yellow pan trap catches. The colour of the dots indicates the number of insecticide sprays during the season.
In field- and landscape parameters affecting damages by D. brassicae.
Stepwise multiple regression models were computed to evaluate whether in field- and landscape parameters such as the abundance of weevils in sticky traps, yellow pan traps, amount of WOSR being grown previous year, distance to previous year’s closest WOSR field, landscape complexity and chemical treatment had an impact on the damages caused by D. brassicae.
A model was computed against the damages 20m into the field caused by D. brassicae during late pod set since this survey is considered of most importance for the farmer and a good predictor of the damages caused over the season. The following parameters seen in table 2 were computed and WOSR−1 and complexity with the lowest AIC was used for the final model.
Table 2. Stepwise regression models were computed against damages 20m into the field in late pod set to evaluate which WOSR−1and complexity that is of interest for the final model. The AIC value was calculated for the linear regression with the variables mentioned in order to find the most suitable model.
Model F DF p-value AIC
WOSR1000m−1 , Chemical treatment, complexityx
complexity1000m 3.538 1,17 >0.05 20.578
complexity2000m 3.538 1,17 >0.05 20.434
complexity3000m 3.335 3,15 <0.05, * 17.131
complexity4000m 3.073 3,15 >0.05 17.738
WOSR2000m−1 , Chemical treatment, complexityx
complexity1000m 1.835 2,16 >0.05 22.255
complexity2000m - 0,18 - 22.312
complexity3000m 2.932 2,16 >0.05 19.361
complexity4000m 2.604 2,16 >0.05 19.804
26
complexity1000m - 0,18 - 25.592
complexity2000m - 0,18 - 25.998
complexity3000m - 0,18 - 23.586
complexity4000m - 0,18 - 23.386
WOSR4000m−1 , Chemical treatment, complexityx
complexity1000m - 0,18 - 25.544
complexity2000m - 0,18 - 25.929
complexity3000m - 0,18 - 23.413
complexity4000m - 0,18 - 23.112
*p<0.05
With the stepwise regression models computed, the following landscape parameters were used for the final model: WOSR1000m−1 and complexity3000m (table 2). The two different trapping systems were then separately put into the model and AIC tests were computed to estimate the quality of the stepwise regression models.
Model with sticky trap:
WOSR1000m−1 , Chemical treatment, complexity3000m, yellow sticky trap (F(3,15) = 3.335, p < 0.05,∗, AIC = 15.805)
Model with yellow pan trap:
WOSR1000m−1 , Chemical treatment, complexity3000m, yellow pan trap (F(2,16) = 4.871, p < 0.05,∗ , AIC = 17.131)
The following variables were put into the final model according to the AIC: Yellow pan trap catches, WOSR1000m−1 , number of chemical treatments, complexity3000m and distance to nearest WOSR field from previous year. The VIF was tested for the variables put into the end model to check for multicollinearity. All the variables met the assumptions VIF<10 which indicates a low multicollinearity in the model (table 3) (Kutner et al. 2004).
Table 3. The variance inflation factor for the stepwise regression model with the 5 variables chosen for the final model.
Variable VIF
Yellow pan trap catches 2.026
WOSR1000m−1 1.663
Chemical treatment 1.450
Complexity3000m 2.538
Distance to closest WOSR field 1.604
The variables put in the final model were then used for the stepwise regression models run against all four inventories carried out during the season (table 4). In the stepwise regression model computed against field border damages in early pod set a significant regression equation was found
(
F(
4,14)
= 5.133, p < 0.01, ∗∗)
, with an R2 of 0.595 and an adjusted R2 of 0.479. In the stepwise regression model computed against damages 20m into the field in early pod set no significant regression equation was found(
F(
4,14)
= 2.55, p > 0.05)
, with an R2 of 0.422 and an adjusted R2 of 0.256. In the stepwise regression model computed against field border damages in late pod set a significant regression equation was found(
F(
4,14)
= 7.853, p < 0.01, ∗ ∗)
, with an R2 of 0.692 and an adjusted R2 of 0.604. In the stepwise regression model computed27
against the damages 20m into the field during late pod set a significant regression equation was found
(
F(
3,15)
= 3.976, p < 0.05, ∗)
, with an R2 of 0.443 and an adjusted R2 of 0.332.Independent variables for the four regression equations and their respective t- and p-values can be seen in figure 4.
Table 4. Independent variables of the four stepwise regression models with their respective t- and p-values.
Survey Location Variables t p
1 Field border
Yellow pan trap catches 1.902 >0.05
WOSR1000m−1 2.812 <0.05, * Chemical treatment -2.294 <0.05, * Complexity3000m 1.578 >0.05 1 Inner field WOSR1000m−1 1.816 >0.05 Chemical treatment -2.126 >0.05 Complexity3000m 2.406 <0.05, * WOSRDistance 1.357 >0.05 2 Field border
Yellow pan trap catches 2.452 <0.05, *
WOSR1000m−1 3.578 <0.01, **
Chemical treatment -2.113 >0.05
Complexity3000m 1.944 >0.05
2 Inner field
Yellow pan trap catches 2.562 <0.05, *
WOSR1000m−1 2.967 <0.01, **
WOSRDistance 1.318 >0.05
*p<0.05, **p<0.01
Discussion
Damages and their within-field spread over the season
Damages in the field border during early pod set showed a positive correlation with the damages recorded in the inner part of the field in early pod set (figure 9a), field border during late pod set (figure 9b) and inner field during late pod set (figure 9d). Damages from the inner part of the field during early pod set showed a positive correlation with the damages recorded in the inner part of the field during late pod set (figure 9c) and in the outer part of the field during late pod set (figure 9f). Damages in field border during late pod set showed a positive correlation with the damages in the inner part of the field (figure 9e)
Within-field spread of pests is influenced by several variables such as temperature, population size, crop size, growth stage of the crop and the structure of the plants during infestation (Williams & Ferguson 2010). Different oilseed rape pests have different within-field distribution patterns such as irregular aggregation as in the case of C. obstrictus, C. pallidactylus and M. aeneus or edge distribution as in the case of D. brassicae (Ferguson et al. 2003). Because of these irregular distribution patterns, monitoring of pest densities within-field can give various results depending on where in the field the monitoring is carried out. In the inventories carried out in this study, field
28
borders and inner part of the fields were both recorded to reduce the bias from the edge effects in the upcoming models and to be able to explain the factors affecting the damages from D. brassicae over the season.
Spatial information on pest movements between crops but also within the crop is of foremost importance for the farmer when it comes to pest control strategies (Murchie et al. 1999; Weisz et al. 1995; Evans et al. 1998). An aggregated within-field distribution of a pest, such as in the case of D. brassicae, usually have a greater impact on yield than more randomly or uniformly distributed pests since the crop is unable to compensate for injuries at a high aggregated pest density compared to a low more heterogeneously distributed pest density (Bardner and Fletcher 1974; Hughes and McKinlay 1988). Understanding these spatiotemporal distribution patterns of a specific pest could, in the long run, lead to spatially targeted applications of insecticides and
therefore reduce the overall use of insecticides within the crop (Weisz et al. 1995; Sylvester-Bradley et al. 1999; Evans et al. 1998). Such applications could also spare non-target organisms such as pollinators, predators and parasitoids which could help increase the overall biological control of the pest (Ferguson et al. 2003; Warner et al. 2000)
The over-season spatiotemporal distribution of damages caused by D. brassicae could to some extent tell the farmer what the outlook of the season is going to look like. As for this study, damages in field borders and inner part of the field during early pod set showed a positive
correlation with late-season damages within-field (figure 9c, d) and could therefore give the farmer a heads-up whether the damages are going to be of economic importance or not. In the long run, a further understanding of within-field pest distributions could lead to improvement of computer-based decision support systems for the studied crop (Johnen et al. 2010a). It could also be of interest for precision farming where within-field spatial information is gathered and used to spatially target the areas where inputs are required (Sylvester-Bradley et al. 1999). Such techniques are used for application of fertilizers, herbicides and seeding densities but would be considered more difficult to apply to insects since populations fluctuate both temporally and spatially (Williams & Ferguson 2010). However, in cases where insect populations are bound to a specific part of the field such as in the case of D. brassicae, techniques such as this could be promising.
Damages from D. brassicae across the regions
Significant differences in damages between the regions were found in the field border during early pod set and in the field border during late pod set (figure 10). The northeastern part of the region showed the highest damages while the northwestern part had the lowest damages (figure 10). No significance was found between the regions in the within-field inventories.
Regional differences in damages can be explained through several within-field and landscape factors and could easily become complex. However, researchers are unanimous that plant-insect interactions, and therefore also herbivore damages across regions, depend on ecological processes on scales larger than the single habitat (Wiens et al. 1997). Previous research has shown that the spatial scale experienced by the organism is directly linked to factors such as its body size, resource specialization, population size variability and rarity and that generalist organisms tend to be more dependent on the surrounding landscape than specialists such as D. brassicae (Tscharntke and Brandl 2004). Therefore, fragmentation of habitats is expected to affect specialized organisms such as D. brassicae (Holt et al. 1999). However, according to our results, damages from D. brassicae tend to be more severe in areas of the study region where there is generally a more diverse environment such as in the northeastern part of the region and lower in areas where the abundance of WOSR is higher such as in the northwestern part of the region (figure 5). Although this cannot be statistically
29
demonstrated in this study, due to a too small number of test fields for a post hoc test, a trend in the data supporting this can be seen (figure 10).
Aspects such as wind direction (Moser et al. 2009) together with the spatial
arrangement, quality of habitats, connectivity of habitats (Tscharntke and Brandl 2004) could be one explanation why damages from D. brassicae is higher in more fragmented landscapes. Inactive dispersal along corridors could lead insect pest to a suitable habitat in a fragmented landscape (Collinge 2000; Haddad et al. 2003; Rosenberg et al. 1997). The idea of corridors together with the idea that pests present in a landscape with fewer habitats could lead to large pest populations being funneled into the habitats available and therefore explain the contradictory observations in this study (Veres et al. 2013). According to the Stephansson and Åhman (1998) areas of forest and wind protected areas usually have higher damages of D. brassicae than wind exposed fields. This could be supported by this study that indicates that the northeastern part of the region studied, which also have a higher landscape diversity, have higher damages from D. brassicae.
Trapping systems
The results from the correlation test computed to assess whether there was a correlation between the abundance of C. obstrictus caught in the two different trapping systems between the 19 different localities showed a positive correlation (figure 11). This tells us that the two separate trapping systems could be used to monitor populations of C. obstrictus. Yellow pan traps have previously been used in the region to monitor C. obstrictus and other insect pests in the WOSR crop (Jordbruksverket 2016). The problem with these traps is that they are not user-friendly and usually catch a high number of unwanted insects which means that the handling of the trap catches of interest can be problematic (Östrand 2011). In the case of sticky traps, a smaller number of insects is caught on a weekly basis and therefore the trapped insects can be quantified faster. Also, with sticky traps, counting templates can be used when high abundances of insects are stuck on the trap and therefore decrease the overall time of monitoring (Dreistadt 1998). However, in the case of landscape studies, the yellow pan trap could be a valuable tool for inventory of insect populations since insects trapped can be sieved and stored in alcohol. From a farmer or an advisors point of view, the sticky trap could be an appropriate monitoring tool because of the overall decrease in handling time.
Abundance of C. obstrictus and its effects on damage caused by D. brassicae
With the two different trapping systems used for this study, we could show a positive correlation between the trap catches of C. obstrictus per day with the field border damages from D. brassicae in both early and late pod set. Also, in late pod set, trap catches from both trapping systems were almost correlated with inner field damages of D. brassicae. Inner field damages during early pod set showed no correlation with the two different trapping systems.
As previously described by Hughes and Evans (2003) D. brassicae is heavily dependent on C. obstrictus for pod access. C. obstrictus damages the pod through direct feeding or by the larvae exiting the pod to pupate in the soil (Åhman 1987). The damage created by direct feeding or the exit hole of the larvae can then be used by D. brassicae to insert its ovipositor and lay its eggs (Åhman 1987). It is therefore thought that absence of C. obstrictus could affect the abundance of D. brassicae because of this interaction between the species (Hughes and Evans 2003). Apart from damages from the C. obstrictus, studies have shown that D. brassicae can oviposit in pods damaged in other ways such as by wind or fungal disease or other phytophagous insects such as lygus bugs (Winfield 1992; Hughes and Evans 2003).
Because of the positive correlation between trap catches of C. obstrictus over the season and the damages caused by D. brassicae, our study can support the publications mentioning
30
the importance of the interaction between the species. However, there are also studies that
contradict these findings. In a study by Axelsen (1992), computed models could simulate D. brassicae populations without taking C. obstrictus population into consideration which would indicate that D.
brassicae is not that dependent on C. obstrictus as one would think. However, this could also be
explained by other factors damaging the pod, D. brassicae itself being able to oviposit in undamaged pods or that C. obstrictus even at low populations could create a sufficient number of oviposition-friendly pods for D. brassicae (Hughes and Evans 2003; Axelsen 1992).
The spatial distribution of C. obstrictus is generally aggregated to field borders during early season migration and then spreads into the field over the season (Murchie et al. 1999). Since damages from D. brassicae have somewhat the same distribution pattern as the abundance of C.
obstrictus an explanation for this could be that the high abundance of C. obstrictus in the field border
during early season leads to a higher abundance of oviposition friendly pods for D. brassicae in this part of the field (Ferguson et al. 2003). When C. obstrictus then move into the crop over the season the inner part of the field would also be accessible for D. brassicae. This theory could be
strengthened with the trap catches not being correlated with within field damages during early season but in late season a close to significant result is shown.
Because of the early season edge distribution, seen in both C. obstrictus and D.
brassicae, application of insecticides in crop borders alone could be an effective measure against
these pests (Murchie et al. 1999; Ferguson et al. 2003). However, the application of insecticide suggested for C. obstrictus would be during early flowering before D. brassicae is even present in the field and thus an early-season insecticide application would not affect both of the organisms
(Murchie et al. 1999). Post-flowering border applications could, however, have an impact on both organisms. D. brassicae usually migrates to the WOSR during May-June (Stephansson and Åhman 1998) while C. obstrictus has shown to have late migratory phases from close by OSR fields also showing a high distribution of adult individuals in the field borders (Murchie et al. 1999). Such post-flowering edge applications could, therefore, be more efficient targeting the pests and they could also be less harmful to non-target organisms within the crop such as pollinators, parasitoids that are very active during flowering (Ulber et al. 2010; Gunnarsson 2016a, c).
Previous years WOSR and its effects on the study organisms
The first surveys on damages caused by D. brassicae carried out in early pod set showed no
correlation with the percentage of WOSR in the surrounding landscape in the four radiuses studied (𝑊𝑂𝑆𝑅−11000𝑚, 𝑊𝑂𝑆𝑅−12000𝑚, 𝑊𝑂𝑆𝑅−13000𝑚, 𝑊𝑂𝑆𝑅−14000𝑚). Neither was there any correlation between the second survey carried out in late pod set and the four radiuses of WOSR. However, a close to significant result was found between the inner part of the field during late pod set and 𝑊𝑂𝑆𝑅−11000𝑚. In the case of the abundance of C. obstrictus, no correlation was found between trap catches from either sticky traps or yellow pan traps and the amount of WOSR in the studied radii.
These findings seem somewhat contradictory for D. brassicae since this organism overwinters in the soil layer of the WOSR field and following spring migrates from the previous year’s WOSR field to this year’s WOSR (Alford 2008). Therefore, this organism alone could be considered solely dependent on the amount of OSR in the landscape and thus an increasing proportion of OSR in the landscape would theoretically correlate with the abundance of D. brassicae and therefore also with the damages caused by the organism (Veres et al. 2013). However, in a study by Zaller et al. (2008b), the damage caused by D. brassicae was negatively correlated to B. napus area in the surrounding landscape. This also somewhat contradictory finding could have its explanations. First, chemical treatment could be used to a wider extent where the organism is thought to be most abundant (Ricci et al. 2009). In this case, this would be in landscapes where there’s a high percentage
31
of OSR being grown. Secondly, the organism’s abundance within OSR field might depend on non-treated fields but also feral plants in the vicinity of the crop. This could be supported by the study by Åhman (1987) that have shown that non-crop brassicas could be used for overwintering and
therefore contribute to next year’s population of D. brassicae. Third, pests with alternative hosts might be dependent on the alternative host rather than the crop of interest (Thies et al. 2005). This could be the case for C. obstrictus which depends not only on WOSR but also on litter and perennial vegetation for overwintering sites (Williams 2010). Since D. brassicae is dependent on feeding damages from C. obstrictus to be able to oviposit in the pods of B. napus (Ferguson et al. 1995) the amount of C. obstrictus in the landscape could also be expected to be the limiting factor of damages caused by D. brassicae rather than the amount of WOSR in the landscape. This could also be
supported by the higher abundance of damages from D. brassicae seen in the northeastern part of the study region that could be considered a more fragmented landscape and thus less agricultural land and less OSR fields.
Landscape complexity and its effects on the study organisms
Landscape complexity seemed to have no effect on border- or within-field damages caused by D.
brassicae in the early season. However, in the case of the late season inner-field survey and
landscape complexity on the 1000m scale there was a positive correlation between the variables (figure 13). In the case of the abundance of C. obstrictus, positive correlations were found in all cases for sticky traps versus landscape complexity at various scales (figure 14a-d). With the yellow pan traps, three out of four scales showed a positive correlation. These were the following, 1000, 2000, 3000 (figure 15a-c). However, the last scale (4000m) showed no correlation.
Previous studies have shown that abundance of D. brassicae larvae is positively related to landscape diversity and the percentage of woody areas (Frank et al. 2010). Since D. brassicae is known to be a weak flyer and heavily dependent on OSR to fulfill its life cycle these results are somewhat contradictory (Sylvén 1970). Landscapes that harbor high percentages of habitats that would be considered to increase the landscape complexity would generally leave less space for agricultural land and therefore also OSR crop which theoretically would have a negative impact on D.
brassicae (Den Belder et al. 2002). In this study, such a relationship was found in one case on a close
scale (1000m). Previous studies by Zaller et al. 2008a have shown that D. brassicae tends to respond to landscape variables at a small range, which could be supported by our study. However, landscape complexity is a vague term and is defined differently from study to study (Chaplin-Kramer et al. 2011). Therefore, the parameters decided to explain landscape complexity could differ between studies and therefore give different outcome (Veres 2013). In the case of the study by Zaller et al. (2008), the abundance of D. brassicae was positively related to woody areas. However, no such relation to grassy fallow area was found (Zaller et al. 2008). In our study, habitats within the landscape that, according to us, could influence landscape complexity such as woody areas and grassland have been used as a measure of landscape complexity and could, therefore, be a bias affecting the outcome of the results.
Since C. obstrictus is known to overwinter in perennial vegetation, semi-natural areas would be of immense importance for the survival of this organism (Williams 2010). This would be supported by our results that show a positive correlation between the abundance of C. obstrictus and the landscape complexity. Highly mobile species, such as C. assmilis, are known to move freely between habitats and are therefore less dependent on a homogenous landscape when moving from its nesting location to its foraging location (Tscharntke and Brandl 2004). The amount of semi-natural habitats could, therefore, be the limiting factor for this organism reproductive success and explain why they are more abundant in semi-natural areas. Another explanation for this could be that in homogenous agricultural landscapes C. obstrictus is spread among a larger amount of OSR field,