Pattern Mining
Shahrooz Abghari
∗Blekinge Institute of Technology Karlskrona, Sweden SE-371 79
shahrooz.abghari@bth.se
Veselka Boeva
Blekinge Institute of Technology Karlskrona, Sweden SE-371 79
veselka.boeva@bth.se
Niklas Lavesson
Blekinge Institute of Technology Karlskrona, Sweden SE-371 79
niklas.lavesson@bth.se
Håkan Grahn
Blekinge Institute of Technology Karlskrona, Sweden SE-371 79
hakan.grahn@bth.se
Jörgen Gustafsson
Ericsson AB Luleå, Sweden SE-971 28 jorgen.gustafsson@ericsson.com
Junaid Shaikh
Ericsson AB Luleå, Sweden SE-971 28 junaid.j.shaikh@ericsson.com
ABSTRACT
The growth of Internet video and over-the-top transmission tech-niques has enabled online video service providers to deliver high quality video content to viewers. To maintain and improve the quality of experience, video providers need to detect unexpected issues that can highly affect the viewers’ experience. This requires analyzing massive amounts of video session data in order to find unexpected sequences of events. In this paper we combine sequen-tial pattern mining and clustering to discover such event sequences. The proposed approach applies sequential pattern mining to find frequent patterns by considering contextual and collective outliers. In order to distinguish between the normal and abnormal behavior of the system, we initially identify the most frequent patterns. Then a clustering algorithm is applied on the most frequent patterns. The generated clustering model together with Silhouette Index are used for further analysis of less frequent patterns and detection of potential outliers. Our results show that the proposed approach can detect outliers at the system level.
CCS CONCEPTS
• Computing methodologies → Unsupervised learning; Anom-aly detection; Cluster anAnom-alysis;
KEYWORDS
Cluster Analysis, Data Stream Mining, Outlier Detection, Sequential Pattern Mining
ACM Reference format:
Shahrooz Abghari, Veselka Boeva, Niklas Lavesson, Håkan Grahn, Jörgen Gustafsson, and Junaid Shaikh. 2018. Outlier Detection for Video Session Data Using Sequential Pattern Mining. In Proceedings of ODD v5.0 Workshop on Outlier Detection De-constructed in Conjunction with ACM SIGKDD 2018, London, UK, August 19-23, 2018 (ODD v5.0 at KDD 2018), 9 pages. ∗S. Abghari is the main and corresponding author.
Permission to make digital or hard copies of part or all of this work for personal or classroom use is granted without fee provided that copies are not made or distributed for profit or commercial advantage and that copies bear this notice and the full citation on the first page. Copyrights for third-party components of this work must be honored. For all other uses, contact the owner/author(s).
ODD v5.0 at KDD 2018, August 19-23, 2018, London, UK © 2018 Copyright held by the owner/author(s).
1
INTRODUCTION
The Internet has transformed almost every aspect of human so-ciety by enabling a wide range of applications and services such as online video streaming. Subscribers of such services spend a substantial amount of time online to watch movies and TV shows. This has required online video service providers (OVSPs) to contin-uously improve their services and equipment to satisfy subscribers’ high expectation. According to a study performed by Krishnan and Sitaraman [17], a 2-second delay in starting an online video program causes the viewers to start abandoning the video. For each extra second delay beyond that the viewers’ drop-off rate will be increased by 5.8%. Thus, in order for OVSPs to address subscribers’ needs it is important to monitor, detect, and resolve any issues or anomalies that can significantly affect the viewers when watching requested video programs. Analyzing massive amounts of video sessions for identifying such abnormal behaviors is like finding a needle in a haystack.
In this study, we use sequential pattern mining in order to an-alyze video data sequences from an over-the-top video service (a delivery paradigm that uses Internet to deliver video). The video session data has temporal order and contains detailed information regarding which video is requested, what type of device (mobile phone, PC, etc.) is used for watching the video, and the list of oc-currences of all event types. The initial assumption with using sequential pattern mining is that frequent patterns can be consid-ered as normal system behavior, while the others can be potential outliers. By applying a clustering method, most frequent patterns can be grouped based on their similarities. Finally, non-most fre-quent patterns can be evaluated by the created model and their goodness-of-fit identified by applying an internal cluster validation measure such as Silhouette Index [24].
The proposed approach is able to detect outliers by analyzing video event sequences and finding specific patterns that do not commonly occur. Investigating these unexpected patterns can assist online video service providers to identify, diagnose, and resolve possible system level issues. To the best of our knowledge, this is the first study that combines sequential pattern mining and clustering analysis for detecting outliers in online video streaming.
2
BACKGROUND
2.1
Frequent Pattern Mining
The application of frequent itemset mining for market-basket analy-sis was first introduced by Agrawal et al. in 1993 [1]. The aim of such analysis is to reveal the customers’ shopping habits and to find out which sets of products are frequently bought together. The frequent itemset mining can be formulated as follows: let I= {i1, i2, ..., in}
be a set of all items and T= {t1, t2, ..., tj, ..., tm} a transaction
data-base, wheretjis a set of items that has been bought by a customer
(tj ⊆ I). The aim is to find those sets of items that occur frequently in most of the shopping baskets considerings, the user-specified support threshold.
The support for a k-itemsetX , which consists of k items from I, is the number of transactions that containX as a subset, i.e.,
ST(X ) = |{tj|X ⊆ tj∧tj ∈ T }|. Note that the support ofX can also
be defined as the relative support which is the ratio of the number of transactions containingX to the total number of transactions in the database T , i.e.,Rel ST(X ) = ST| T |(X ), suchX is frequent if and
only if its support is equal or greater thans.
Originally in frequent itemset mining, the order of items in the itemsets is unimportant. Looking at the market-basket analysis, the goal is to find frequent sets of items that are bought together. How-ever, there are some situations in which the order of items inside the itemset is important such as sequence databases. A sequence database consists of ordered sequences of items listed with or with-out a concrete notion of time [10]. Sequential pattern mining, the problem of finding interesting frequent ordered patterns, was first introduced in 1995 [2].
Let I= {i1, i2, ..., im} be a set of all items. A sequenceα defined
as ⟨a1, a2, ..., aj, ..., am⟩, whereajis an itemset. Each itemsetaj
represents a set of items that happened at the same time. A se-quenceα = ⟨a1, a2, ..., am⟩ is a subsequence ofβ = ⟨b1,b2, ...,bn⟩
if and only if there exist integers 1 ≤k1< k2< ... < km ≤n and
a1 ⊆bk1, a2 ⊆bk2, ..., am ⊆bkm [2]. Given a sequence database
T = {s1, s2, ..., sn}, the support forα is the number of sequences in
T that containα as a subsequence. Consequently, α is a frequent se-quential pattern if its support is equal or greater than user-specified support threshold.
Mining frequent patterns in a large database can lead to gen-erating a huge number of patterns that satisfy the user-specified support threshold. This is due to the fact that if a pattern is frequent, its sub-patterns are also frequent. To mitigate this problem, closed and maximal frequent pattern mining has been proposed [10]. A frequent patternα is called:
(1) a closed frequent pattern in the database T if and only if none of its super-patterns have the same support asα, (2) a maximal frequent pattern in the database T if and only if
none of its super-patterns is frequent [5], [10].
2.2
Sequential Pattern Mining Algorithms
Since the introduction of frequent itemset mining and the Apriori algorithm [1], several extensions of this algorithm were developed for both frequent itemset mining and sequential pattern mining. In general, there are two main categories of algorithms suitable for
frequent pattern mining: 1) Apriori-based algorithms and 2) Pattern-growth algorithms. Additionally, from a frequent pattern mining point of view, a sequence database can represent the data either in a horizontal data format or vertical data format [26]. Therefore, based on these two data formats Apriori-based algorithms can ex-pand to horizontal data format algorithms such as AprioriAll [2], and GSP [27] and vertical data format algorithms such as SPADE [30], and SPAM [3]. Apriori-based algorithms generate large sets of candidates and repeatedly scan the database for mining sequential patterns which require a lot of memory [13]. To solve this problem, pattern-growth approach as an extension of FP-growth algorithm [13] for frequent itemset mining without candidate generation was proposed. Pattern-growth algorithms such as FreeSpan [12], and PrefixSpan [21] work in a divide-and-conquer fashion and repeat-edly divide the database into a set of smaller projected databases and mine them recursively.
The most popular pattern-growth algorithm is PrefixSpan. Given a sequence database, T , and a user-specified threshold, min_sup, PrefixSpan applies a prefix-projection method to mine sequential patterns in T through 1) scanning the database once to find all frequent items with a length one, 2) dividing search space into a number of subsets according to the extracted frequent items in the previous step, and 3) constructing projected databases that repre-sent each subset of sequential patterns and mining them recursively. This way, only local frequent sequences will be explored to create sequential patterns in each projected database [21], [26].
In 2004, Pei et al. [22] showed that PrefixSpan has the best overall performance compared to GSP and SPADE, and FreeSpan. There-fore, in this study we choose to use PrefixSpan for extracting se-quential patterns in video data sessions.
3
RELATED WORK
Barbará et al. [4] proposed an intrusion detection system that ap-plies a frequent itemset technique to discover sets of items that are available in most data chunks. Using a clustering algorithm, these items that are considered as attack-free traffic, are divided into different groups based on their similarities. After creating the clusters, an outlier detection technique is applied to all the data points checking each instance against the set of clusters. Instances that do not belong to any clusters are presumed to be attacks. Re-cently, Rossi et al. [23] proposed an anomaly detection system for the smart grid domain similar to one considered in [4]. The method proposed by Rossi et al. uses frequent itemset mining on different event types collected from smart meters to separate normal and potential anomalous data points. For further evaluation, a cluster-ing technique with Silhouette Index analysis is applied to detect anomalies.
Hoque et al. [14] developed an anomaly detection system for monitoring daily in-home activities of elderly people called Holmes. The proposed system learns a resident’s normal behavior by con-sidering variability of daily activities based on their occurrence time (e.g., day, weekdays, weekends) and applying a context-aware hierarchical clustering algorithm. Moreover, Holmes learns tempo-ral relationships between multiple activities with the help of both sequential pattern mining and itemset mining algorithms. New
scenarios can be added based on resident and expert’s feedback to increase the accuracy of the system.
4
METHODS AND TECHNICAL SOLUTIONS
4.1
Problem Definition and a Use Case
Outlier detection refers to finding unexpected and abnormal pat-terns in data. The challenge in detecting outliers comes from the difficulty in defining a normal behavior, which includes the issue of labeling data [6]. Therefore, unsupervised learning methods or a combination of methods such as frequent pattern mining and clustering can be applied to analyze, understand and detect outliers. Finding unexpected patterns in video session data is challenging due to the scarcity of the labeled data.
Table 1: Example of video sessions sorted by Session ID and Date-time
Session ID Video ID Date-time Event type 1 002 Oct-01-16 22:44 client_roll 1 002 Oct-01-16 22:45 created 1 002 Oct-01-16 22:46 connectivity_changed 1 002 Oct-01-16 22:47 bitrate_switched 1 002 Oct-01-16 22:48 started 1 057 Oct-01-16 22:55 program_changed 1 057 Oct-01-16 23:22 pause 1 057 Oct-01-16 23:48 stopped 2 105 Oct-03-16 17:26 client_roll 2 105 Oct-03-16 17:27 created 2 105 Oct-03-16 17:28 connectivity_changed 2 105 Oct-03-16 17:29 bitrate_switched 2 105 Oct-03-16 17:30 bitrate_switched 2 105 Oct-03-16 17:31 bitrate_switched 2 105 Oct-03-16 17:32 stopped
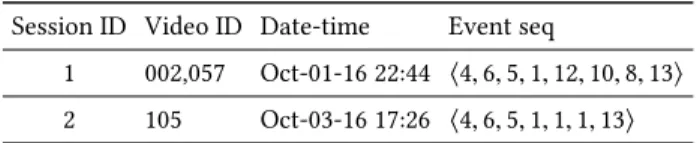
We investigate a dataset of video sessions, where each video session consists of session ID, video ID, date and time of an occur-ring video event together with its type. The aim is to use frequent sequential pattern mining on sequences of video events to find unexpected or abnormal patterns of video events. Table 1 shows two examples of video sessions. Every session starts with a viewer logging into his/her account (client_roll), instantiating the video player (created) and ending with stopped. We denote an itemseti by
Table 2: Event types and their corresponding IDs Event ID Event type Event ID Event type
1 bitrate_switched 8 paused 2 buffering_started 9 play 3 buffering_stopped 10 program_changed 4 client_roll 11 scrubbed 5 connectivity_changed 12 started 6 created 13 stopped 7 error_occurred
(i1, i2, ..., ij..., in), where eachijis an item. Table 2 shows all the
available event types that can appear in a video session together with their unique ID. A sequenceα is an ordered list of itemsets and defined as ⟨a1, a2, ..., aj, ..., am⟩, where eachaj is an itemset.
In our case each itemset,aj, is a singleton. Table 3 shows how the
information of Table 1 can be summarized as a sequence of events for each viewer. Using the sequential pattern mining, we would like to find frequent sequential patterns in our data, group them into clusters based on their similarities, and then each infrequent sequential pattern can be analyzed and matched to these clusters to find normal and abnormal patterns.
Table 3: Example of video sessions with sequences of events Session ID Video ID Date-time Event seq
1 002,057 Oct-01-16 22:44 ⟨4, 6, 5, 1, 12, 10, 8, 13⟩ 2 105 Oct-03-16 17:26 ⟨4, 6, 5, 1, 1, 1, 13⟩
Our use case relates to analyzing a sudden increase in the num-ber of video streaming performance events during video sessions. Performance changes in video streams are often reflected by the re-buffering and quality adaptation events (buffering_stared, buffer-ing_stopped, and bitrate_switched). A sudden increase in occurrence of such events can be related to some kind of performance issues at the system level. Considering only the total number of re-buffering and bitrate adaptation events, however, may not be a true indicator of a sudden change in overall performance of the video sessions. It may happen that the number of initiated sessions surge during a cer-tain time interval and that results in an increase in buffering_started, buffering_stopped and bitrate_switched events. This is because ev-ery session normally has some buffering and bitrate change events. However, what is more important for the OVSPs is to identify if such event types within sessions increase in number for many con-current video sessions and for many users approximately at the same time.
4.2
Clustering Analysis
Cluster analysis is a process of partitioning a set of objects into groups of similar objects. That is, the objects within each cluster are similar to each other but dissimilar to objects in neighboring clusters [11].
In our experiment, we use two different clustering methods to partition the data, namely k-means [19] and Affinity Propagation (AP) [7]. The popular k-means algorithm begins by an initial set of randomly selected centroids. It then iteratively revises this set until the sum of squared errors are minimized. k-means requires the value ofk, i.e., the number of clusters, as an input.
Affinity Propagation, on the other hand simultaneously consid-ers all data points as potential centroids and exchanges real-valued messages between data points until a good set of centroids and clusters appear. The exchanged messages represent either the suit-ability of one data point in comparison to others being the centroid (responsibility) or when one data point should choose a new cen-troid (availability). AP adapts the number of clusters based on the
data. In comparison with k-means, the AP algorithm uses actual data points as the cluster’s centroids.
4.3
Cluster Validation Measures
The cluster validation techniques can be regarded as important aids for interpreting partitioning solutions to find the one that best fits the underlying data. Cluster validation measures can be divided into two major categories: external and internal. External validation measures require the ground truth labels for providing an assessment of clustering quality. In case the ground truth labels are not known, internal validation measures can be used. Internal measures base their analysis on the same information used to cre-ate the model itself. In general, internal measures can be used to assess compactness, separation, connectedness, and stability of the clustering results [15]. A detailed overview of different clustering validation measures and their comparison can be found in [9, 29]. In this study we apply Silhouette Index (SI) [24] as an internal validation measure due to unavailability of the ground truth labels. SI can be applied to evaluate the tightness and separation of each cluster and it measures how well an object fits the available cluster-ing. For eachi, let a(i) be the average dissimilarity of i to all other objects in the same cluster. Let us now considerd(i,C) as an average dissimilarity ofi to all objects of a cluster C. After computing d(i,C) for all clusters, the one with the smallest average dissimilarity is denoted asb(i). Such cluster also refer to neighboring cluster of i. The Silhouette Index score ofi, s(i), is obtained by combing a(i) andb(i) as follows:
s(i) =max{a(i),b(i)}b(i) − a(i)
Thes(i) has values in a range of [−1, 1]. A score close to 1 im-plies that the object is well clustered. Whens(i) is about zero, this indicates the object is on the decision boundary between two neigh-boring clusters. The worst situation occurs whens(i) is close to -1. This indicates that the object is misclassified and assigned to the wrong cluster.
The averages(i) for all objects i belonging to the same cluster shows how tightly those objects are grouped. The averages(i) for all objectsi in the whole dataset judges the quality of the generated clustering solution.
4.4
Distance Measures
In order to calculate the similarity between the frequent patterns with different lengths, we study two different distance measures, namely Fast Dynamic Time Warping (FastDTW) algorithm [25] and Levenshtein Distance (LD) [18].
The FastDTW algorithm is able to detect an accurate optimal alignment between two time series and to find the corresponding regions between them. FastDTW reduces the resolution of the time series repeatedly with averaging adjacent pairs of points. Then it takes a minimum-distance warp path at a lower resolution and projects to a higher resolution. The projected warp path is refined and repeatedly projected onto incrementally higher resolutions until a full warp path is found.
The LD, also known as edit distance, is a string similarity metric that measures the minimum number of editing operations (insertion,
deletion and substitution) required to change one string into the other.
As mentioned earlier, the video session data has a temporal order, which means that events can only appear in a special set-up. Therefore, FastDTW is chosen for comparison of the patterns. On the other hand, LD as an edit distance considers the elements’ alignments of the patterns and the required changes to transform one into other. As an example consider these two patterns,P1 :
⟨1, 1, 1, 1, 1⟩ andP2 : ⟨1, 1, 1⟩. According to FastDTW, these two
patterns are 100% similar since the measure assumes thatP2is
bent. However, LD would show that the similarity between the two patterns are 60% since the insertion of 2 extra 1’s are needed to transformP2toP1. From the point of view of time series analysis
these two patterns are similar. However, from the video streaming performance point of view, repetition of re-buffering and quality adaptation events may represent performance issues, which in this scenario the result of the LD is more relevant. For this reason, in this study we evaluate the proposed approach with both distance measures (FastDTW and LD).
5
PROPOSED APPROACH
We combine frequent sequential pattern mining with clustering and Silhouette Index based analysis to detect unexpected patterns in online video data. Our approach can be found similar to Rossi et al.’s proposed method that has been applied for smart grid data in the district heating domain [23]. Both approaches deal with sequences of event types. However, instead of itemset mining we use sequential pattern mining due to the fact that the temporal order of occurrence of the video events is important.
To analyze video sessions for finding unexpected patterns at the system level the following steps are carried out:
1. Data segmentation. The video sessions are first divided into equal-sized segments based on the time period they are instanti-ated in order to identify sequential patterns. Data segmentation can be performed hourly, daily, and even weekly with different set-ups. For example, daily video sessions can be divided into four 6-hour period segments. Due to availability of daily patterns in the data, similar segments of similar days can be compared. We have conducted some initial experiments of our approach with bigger segment sizes, such as 2-days and weekly. However, additional evaluation and validation of these scenarios are needed to be able to make an informed conclusion about their significance for the approach performance. Therefore, in this paper, we have only con-sidered a daily segment. One segment includes all video sessions that are initiated at the same time period.
2. Frequent sequential patterns finding. The PrefixSpan algo-rithm [21] is used to find frequent sequential patterns in each seg-ment. The extracted patterns are stored in a list corresponding to each segment. These patterns can lead us to find collective outliers1. Note that we only use sequences of video events as inputs for the algorithm. Moreover, each video session has only one event se-quence, such as ⟨4, 6, 5, 1, 12, 10, 8, 13⟩ (see Session ID 1 in Table 3). Those sequential patterns that satisfy the user-specified support
1Collective outlier is a collection (sequence) of related data points that deviate
signifi-cantly from the entire data set. Note that the individual data points in the sequence may or may not be outliers by themselves[6, 11].
will be stored as frequent patterns. In this study, the user-specified support threshold is set to be 0.15, which means any pattern that appears more than (0.15 ∗size_of _the_seдment) times will be con-sidered. The support threshold is tested with different sizes ranging between 0.1 to 0.2. By choosing values close to 0.1 many patterns are extracted which affects the execution time dramatically. On the other hand, choosing values close to 0.2 ends up extracting very few patterns. However, by setting the support threshold to 0.15 we both decrease the execution time and gain a reasonable amount of patterns. Additionally, in order to decrease the computational time of the proposed approach, patterns with lengths less than 3 are omitted.
3. Frequent sequential patterns mapping. The list of extracted frequent sequential patterns is created for each segment in Step 2. Now, for each segment, the following steps will be carried out:
(1) Select a pattern, one at a time, from the list of frequent se-quential patterns and mark those video sessions that contain the pattern. Note that a video session can be matched with different patterns.
(2) Store the date, the pattern(s) and its related length and fre-quency in the selected_patterns list (if the pattern does not match any video sessions its frequency will be set to 0). We can also add additional information here such as whether the pattern happened during working days, weekends or irregular days (e.g., public holidays), and what day-of-week, that can be helpful for finding a contextual outlier2. (3) If not all patterns are selected, go back to 1 and select the
next pattern.
After Step 3 the selected_patterns list contains the following details: 1) date, 2) pattern, 3) length of the pattern, 4) frequency of the pattern in the segment, 5) date-time information (e.g., day-of-week (Mon = 0, Tue = 2, ..., Sun = 6), and type-of-day (irregular day = 2, workday = 1, and weekend = 0)). Therefore, the selected_patterns list can represent one element according to Table 3 as [date: Oct-01-2016, sequence: ⟨4, 6, 5, 1⟩, length: 4, frequency in segment: 1, day-of-week: 6, type-of-day: 0].
4. Most frequent and non-most frequent patterns finding. At this step, we look for those sequential patterns that occurred in more than one segment, i.e., the Most Frequent Sequential Patterns (MFSPs). The initial assumption is that frequent patterns that appear in more than one segment can be considered as normal. Non-most Frequent Sequential Patterns (NMFSPs) on the other hand can be assumed as potentially unexpected at this stage.
5. MFSPs clustering. The selected_patterns list summarizes de-tailed information regarding all video sessions. Then a clustering algorithm (e.g., k-means) can be used to group MFSPs into clus-ters. Note that since every video event has an ID (see Table 2), a sequential pattern such as {client_roll, created,connectivity_changed, bitrate_switched} can be transformed to ⟨4, 6, 5, 1⟩.
6. Analysis of NMFSPs and outlier detection. The clustering model built in the previous step can be used to analyze the NMFSPs, i.e., by matching each NMFSP into the MFSPs clustering model we can evaluate how well it fits into the model. The goodness-of-fit of
2Contextual or conditional outlier is a data point that deviates significantly with
respect to a specific context or condition [6, 11].
a NMFSP can be identified by applying some internal cluster vali-dation measures such as Silhouette Index. That is, those NMFSPs with Silhouette scores,s(i), less than the average s(i) for the whole clustering solution can be defined as outliers. Note thats(i) mea-sures how well an objecti, a NMFSP in our case, fits the available clustering and ranges from -1 to 1. The Silhouette score close to 1 implies that the pattern is well clustered. Whensiis about zero,
this indicates the NMFSP is on the decision boundary between two neighboring clusters. Ans(i) close to -1 indicates that the NMFSP is misclassified and assigned to an erroneous cluster, i.e., such NMFSP can be identified as an outlier.
6
EMPIRICAL EVALUATION
6.1
Data Collection
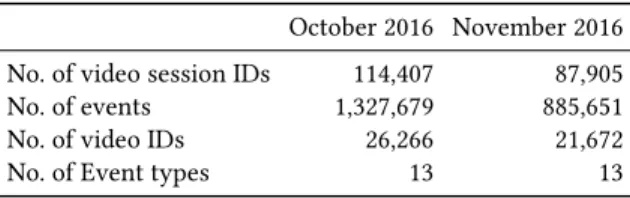
We used two months of data (October-November 2016) for initial evaluation of sequential pattern mining to find unexpected pat-terns in video sessions. The data is obtained from a large European telecommunication company and contains 202,312 unique video session IDs, 2,213,330 events, 13 event types and 47,938 videos. Table 4 summarizes detailed information about the data for each month.
Table 4: Summary of the data used in the experiment October 2016 November 2016 No. of video session IDs 114,407 87,905
No. of events 1,327,679 885,651
No. of video IDs 26,266 21,672
No. of Event types 13 13
6.2
Experimental Design
The proposed approach is implemented in Python version 3.6. The Python implementation of PrefixSpan, LD and FastDTW algorithms are fetched from [8, 16, 28] respectively. The clustering algorithms are adopted from the scikit-learn module [20]. The implemented code and the experimental results are available at GitHub3.
In this study, we have investigated the usage of two different distance measures namely, LD and FastDTW together with two clustering methods and sequential pattern mining for detecting outliers. The motivation behind this is due to the fact that these distance measures are able to capture different similarity charac-teristics between the two compared patterns (see the discussion in Section 4.4 for more details).
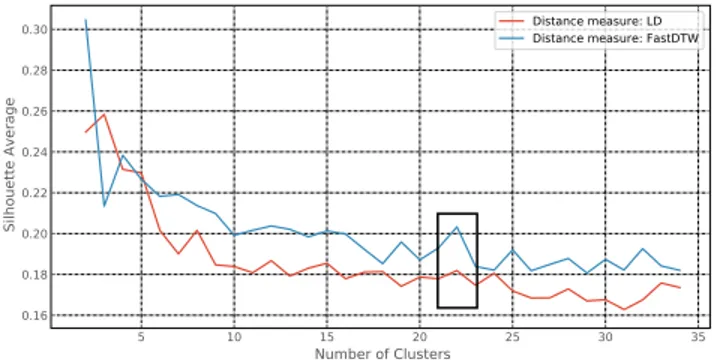
We use SI to determine the optimal number of clusters on the set of MFSPs. Namely, we have run k-means algorithm with a different number of clusters. Then we have used the SI as a validity index to identify the best partitioning scheme. Figure 1 shows the average Silhouette scores for allk in the range between 2 and 35 using the LD (red color line) and FastDTW (blue color line) measures for data belongs to October 2016. The selected range is based on the number of clusters chosen by AP. We search for a local maximum of each plot that has a sudden change in order to identify the optimalk.
3
Table 5: The results of the experiment
Affinity Propagation k-means
LD FastDTW LD FastDTW Oct 2016 No. of MFSPs 384 No. of NMFSPs 60 SI 0.149 0.170 0.182 0.203 No. of clusters 32 33 22 22
No. of detected outliers 33 31 40 36
No. of days 2 (31) 2 (31) 2 (31) 2 (31)
No. of matched video sessions / day 143 (4,359) 144 (4,359) 144 (4,359) 402 (4,359) 372 (2,390) 372 (2,390) 336 (2,390) 336 (2,390) No v 2016 No. of MFSPs 109 No. of NMFSPs 258 SI 0.175 0.192 0.194 0.207 No. of clusters 14 14 12 12
No. of detected outliers 120 144 137 160
No. of days 1 (30) 1 (30) 1 (30) 1 (30)
No. of matched video sessions / day 1,068 (3,705) 1,078 (3,705) 1,068 (3,705) 1,078 (3,705)
Note. Numbers inside the parentheses represent the total for both days and video sessions.
The black box in Figure 1 shows the selected optimalk = 22, which is the same for both measures in October 2016. The optimalk for data belongs to November 2016, is 12. In addition, SI is also applied to analyze the NMFSPs.
7
RESULTS AND ANALYSIS
The proposed approach is evaluated separately on data collected from October and November 2016. Two different clustering algo-rithms, AP and k-means together with LD and FastDTW are used for partitioning the MFSPs. The Silhouette Index is used to analyze NMFSPs on both clustering models. The results are presented in Tables 5, 6 and 7. As shown in Table 5, the number of extracted
Figure 1: Identifying the optimal number of clusters for k-means using Silhouette Index for data belongs to October 2016
. The black box shows the selected optimalk for the studied distance measures.
patterns, both MFSPs and NMFSPs, for October compared to No-vember varies considerably. In October, the daily segments contain
higher number of MFSPs, i.e., 384 compared to November which is 109. On the other hand, the number of NMFSPs for November is 258, which is approximately 4 times larger than the extracted patterns for October. This is mainly because the total number of video sessions and the frequency of event types in October is larger compared to November.
As presented in Table 5, during October and November both clustering algorithms detect outliers. In October we identify out-liers in two days and in November only in one day. The combina-tion of k-means algorithm with either of LD or FastDTW detected slightly more unexpected patterns compared to AP. The number of video sessions that matched with the detected outliers by the clustering algorithms are quite similar in both months except for the combination of k-means and FastDTW, which hits 402 video sessions in October. This perhaps relates to how each algorithm selects centroids of the clusters and tries to minimize the sum of squared errors. Table 5 also presents the number of video sessions that match with detected outliers. Overall, k-means matched more video sessions with the identified outliers during the months of October and November.
The results of the top five most frequent sequential patterns for both October and November 2016 are presented in Table 6. These patterns relate to the daily segment. These patterns are matched with the majority of the video sessions (101,996 out of 114,407 and 84,494 out of 87,905 matched video sessions for Oc-tober and November 2016, respectively). Most of these patterns begin with created (ID = 6) and client_roll (ID = 4) followed by connectivity_changed (ID = 5), bitrate_switched (ID = 1) and started (ID = 12) events. These sequences of the video events are the most common ones. Moreover, three of these sequences contain paused (ID = 8) and stopped (ID = 13), which represent a com-plete video session that begins with a viewer’s login and ends with
6
4
2
0
2
4
6
8
10
4
3
2
1
0
1
2
3
4
5
(a) Affinity Propagation and LD, (Oct 2016)
6
4
2
0
2
4
6
8
10
4
3
2
1
0
1
2
3
4
5
(b) k-means and LD, (Oct 2016)
6
4
2
0
2
4
6
8
10
4
3
2
1
0
1
2
3
4
5
(c) Affinity Propagation and FastDTW, (Oct 2016)
6
4
2
0
2
4
6
8
10
4
3
2
1
0
1
2
3
4
5
(d) k-means and FastDTW, (Oct 2016)
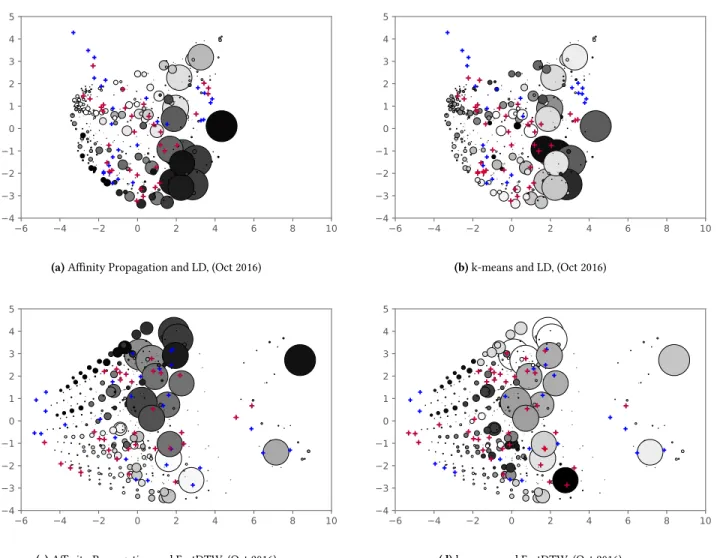
Figure 2: The visualization of the data is preformed by applying Principal Component Analysis (PCA) to convert the multi-dimensional dissimilarity matrices into 2-dimensional arrays. Therefore, no labels for axes are given. Each sphere represents one MFSP. The size of a sphere shows the number of video sessions that have been matched with it. Spheres with the same color belong to one cluster. The NMFSPs are shown with the blue pluses (”+ ”) and those NMFSPs that are identified as outliers are the red pluses (” + ”).
Table 6: Top 5 most frequent sequential patterns (MFSPs) re-late to the daily segment
Pattern Oct 2016 Pattern Nov 2016
MFSP ⟨6, 4, 5, 1, 12, 8, 13⟩ 74,362 ⟨6, 4, 5, 1, 12, 8, 13⟩ 59,340 ⟨6, 4, 5, 1, 12⟩ 12,061 ⟨6, 4, 5, 1, 12⟩ 19,104 ⟨6, 4, 5, 1, 12, 1⟩ 6,491 ⟨6, 4, 5, 1, 12, 8⟩ 4,449 ⟨6, 4, 5, 1, 12, 8⟩ 5,057 ⟨6, 5, 1, 12, 8, 13⟩ 1,098 ⟨6, 4, 5, 1, 12, 1, 8, 13⟩ 4,025 ⟨6, 5, 1, 12⟩ 503
Total matched patterns 101,996 84,494
Note. The bold patterns represent those that occur in both Oct and Nov 2016.
stopped. The bold patterns in Table 6 represent those patterns that occur in both months and in the case of MFSPs they cover a high proportion of the video sessions.
Table 7 shows the top 5 NMFSPs detected as outliers by clustering algorithms. There are two patterns detected with both AP and k-means in October. The first pattern contains bitrate_switched (ID = 1), buffering_started (ID = 2), followed by two bitrate_switched (ID = 1) events. The second pattern contains client_roll (ID = 4) followed by connectivity_changed (ID = 5), bitrate_switched (ID = 1), started (ID = 12) and program_changed (ID = 10) events. There are three bold patterns, only one detected by AP and two by means. The pattern ⟨1, 12, 10, 8⟩, which is detected by k-means is a sub-pattern of ⟨1, 12, 10, 8, 13⟩ detected by AP and they are quite similar. However, this pattern ⟨1, 2, 1, 1⟩ detected by k-means using FastDTW is interesting mostly because it has repetition
of bitrate_switched (ID = 1) and matched with 256 video sessions. In general, every video session contains a number of re-buffering and bitrate switched. However, any increase in the quantity of such event types for many viewers can be related to performance issues. This follows the definition of a collective outlier, i.e., an unexpected collection or sequence of related event types (data points) occurring together. Nevertheless, more investigation needs to be performed to find the reason of these issues. For November, both the clustering algorithms detect the same number of patterns.
Table 7: Top 5 non-most frequent sequential patterns (NMF-SPs) detected as outliers for each month
Affinity Propagation k-means
LD FastDTW LD FastDTW Oct 2016 ⟨1, 2, 1, 1⟩ - - - 256 ⟨1, 2, 1, 1, 8, 13⟩ 101 101 101 101 ⟨1, 12, 10, 8⟩ - - 148 148 ⟨1, 12, 10, 8, 13⟩ 136 136 - -⟨4, 5, 1, 12, 10⟩ 152 152 140 140
Total matched patterns 389 389 389 645
No v 2016 ⟨1, 1, 1, 1, 1⟩ 513 513 513 513 ⟨1, 2, 1⟩ 92 92 92 92 ⟨1, 1, 1, 2⟩ 67 67 67 67 ⟨3, 8, 13⟩ 66 66 66 66 ⟨1, 1, 1, 1, 2⟩ 53 53 53 53
Total matched patterns 791 791 791 791
Note. The bold patterns represent those that are detected by only one of the clus-tering algorithms in Oct 2016. ’-’ means unavailable.
The results of applying the proposed approach on data belonging to October are visualized in Figure 2. Both AP and k-means detect outliers in two weekdays. In all plots each sphere represents one MFSP. The size of a sphere shows the number of video sessions that have been matched with it. The spheres with the same color belongs to one cluster. The NMFSPs are shown with blue ”+ ” and the detected outliers displayed with red ”+ ”. Principal Component Analysis (PCA) is used to transform the multi-dimensional dissim-ilarity matrices created by distance measures into 2-dimensional arrays. Plot (a) shows the results of AP using LD measure. As it is shown in Table 5, AP partitioned the MFSPs into 32 clusters. The results of k-means using LD measure is shown in (b). The size of k is set to be 22 and 40 NMFSPs out of 60 are marked as outliers. The plots (c) and (d) present the results of AP (no. of clusters = 33) and k-means (no. of clusters = 22) using FastDTW measure, respectively. Using FastDTW measure, AP and k-means identified 31 and 36 outliers, respectively.
Using LD measure, it appears the partitioned MFSPs especially the bigger spheres, are condensed in clumps, surrounding the NMF-SPs. However, with the FastDTW algorithm, MFSPs seem to be stacked vertically and the NMFSPs extend across the 2D space in a horizontal trend. These differences reflect how each distance measure calculates the dissimilarity between two patterns. As we
mentioned earlier in Section 4.4, LD is more sensitive when part of one pattern is a sub-pattern of the other with different length. Nevertheless, using different distance measures together with 3D visualization techniques can provide a better understanding of the underlying organization of the data for OVSPs.
8
DISCUSSION
Outlier detection approaches can assist the online video service providers to monitor and improve the quality of their services. In general, finding outliers in online video data without having a clear definition of normal behavior is a challenging task. Hybrid approaches combining sequential pattern mining and clustering analysis, as it has been demonstrated in this study, can be useful in detecting unexpected sequences of events. In this study, video session data contains 13 unique event types (see Table 2 for more details). These event types are quite general and most of them can appear in both video sessions with good and bad quality. This makes it hard to draw any conclusions about the detected outliers without experts’ validation. However, looking at the ratio of the quality related events can assist us to judge the quality of the video sessions. For example, by being able to identify a sudden increase of re-buffering and bitrate switch events, one may prevent users from having an unsatisfactory experience. The proposed approach has been evaluated with two months of data supplied by a large Euro-pean telecommunication company. A number of outliers have been identified and matched with the studied use case, which analyzes a sudden increase of the video streaming performance events.
Perhaps it is worth to further study whether the different length of segments (see the discussion in Section 5) can affect the perfor-mance of the proposed outlier detection approach. In addition, it will be interesting to take into account the time interval between occurrences of the events in the evaluation set-up.
Furthermore, it is worthwhile to mention that not every pat-tern created by the sequential patpat-tern mining algorithms can be useful. Although, sequential pattern mining searches for ordered sequences of events that are frequently happening together, some of the sequences might not be matched with any video sessions. The reason is that some of the events of the sequence are not available and pattern matching will not work. The importance of matching the extracted patterns with video sessions is due to the fact that we are trying to identify both the unexpected patterns and those sessions that are affected. Therefore, to ensure that no information will be lost, we plan to further study the combination of sequential pattern mining with frequent itemset mining.
9
CONCLUSION AND FUTURE WORK
In this study, we have presented a hybrid approach for online video streaming by combining sequential pattern mining and clustering analysis to detect outliers at the system level. In addition, the usage of two different distance measures have been evaluated. In com-parison to other studies that often apply statistical analysis to find outliers, we have looked for unexpected patterns that can have impact on the video streaming performance.
By applying this approach, online video service providers can easily monitor suspicious video sessions and capture a better un-derstanding about the viewers’ experience.
For future work, we aim to pursue further evaluation and vali-dation of our approach on a variety of datasets by applying alter-native clustering analysis techniques, e.g., graph-based clustering approaches and different validation measures. Our future plans also involve integrating additional information into the analysis of non-most frequent sequential patterns supplied by the domain experts.
ACKNOWLEDGMENTS
This work is part of the research project “Scalable resource-efficient systems for big data analytics” funded by the Knowledge Foundation (grant: 20140032) in Sweden.
REFERENCES
[1] Rakesh Agrawal, Tomasz Imieliński, and Arun Swami. 1993. Mining association rules between sets of items in large databases. In Acm sigmod record, Vol. 22. 207–216.
[2] Rakesh Agrawal and Ramakrishnan Srikant. 1995. Mining sequential patterns. In Data Engineering, 1995. Proc. of the Eleventh Int’l Conf. on. IEEE, 3–14. [3] Jay Ayres, Jason Flannick, Johannes Gehrke, and Tomi Yiu. 2002. Sequential
pattern mining using a bitmap representation. In Proc. of the eighth ACM SIGKDD int’l conf. on Knowledge discovery and data mining. 429–435.
[4] Daniel Barbará, Yi Li, Julia Couto, Jia-Ling Lin, and Sushil Jajodia. 2003. Boot-strapping a data mining intrusion detection system. In Proc. of the 2003 ACM symp. on Applied computing. 421–425.
[5] Christian Borgelt. 2012. Frequent item set mining. Wiley Interdisciplinary Reviews: Data Mining and Knowledge Discovery 2, 6 (2012), 437–456.
[6] Varun Chandola, Arindam Banerjee, and Vipin Kumar. 2009. Anomaly detection: A survey. ACM computing surveys (CSUR) 41, 3 (2009), 15.
[7] Brendan J Frey and Delbert Dueck. 2007. Clustering by passing messages between data points. science 315, 5814 (2007), 972–976.
[8] Chuancong Gao. 2015. PrefixSpan algorithm source code. (2015). https://github. com/chuanconggao/PrefixSpan-py
[9] Maria Halkidi, Yannis Batistakis, and Michalis Vazirgiannis. 2001. On clustering validation techniques. Journal of intelligent information systems 17, 2-3 (2001), 107–145.
[10] Jiawei Han, Hong Cheng, Dong Xin, and Xifeng Yan. 2007. Frequent pattern min-ing: Current status and future directions. Data Mining and Knowledge Discovery 15, 1 (2007), 55–86.
[11] Jiawei Han, Jian Pei, and Micheline Kamber. 2011. Data mining: concepts and techniques. Elsevier.
[12] Jiawei Han, Jian Pei, Behzad Mortazavi-Asl, Qiming Chen, Umeshwar Dayal, and Mei-Chun Hsu. 2000. FreeSpan: Frequent pattern-projected sequential pattern
mining. In Proc. of the sixth ACM SIGKDD int’l conf. on Knowledge discovery and data mining. 355–359.
[13] Jiawei Han, Jian Pei, and Yiwen Yin. 2000. Mining frequent patterns without candidate generation. In ACM sigmod record, Vol. 29. 1–12.
[14] Enamul Hoque, Robert F Dickerson, Sarah M Preum, Mark Hanson, Adam Barth, and John A Stankovic. 2015. Holmes: A comprehensive anomaly detection system for daily in-home activities. In Distributed Computing in Sensor Systems(DCOSS), Int’l Conf. on. IEEE, 40–51.
[15] Anil K Jain and Richard C Dubes. 1988. Algorithms for clustering data. Englewood Cliffs, NJ.
[16] Bhavya Jain. -. Edit distance algorithm source code. (-).
[17] S Shunmuga Krishnan and Ramesh K Sitaraman. 2013. Video stream quality impacts viewer behavior: Inferring causality using quasi-experimental designs. IEEE/ACM Transactions on Networking 21, 6 (2013), 2001–2014.
[18] Vladimir I Levenshtein. 1966. Binary codes capable of correcting deletions, insertions, and reversals. In Soviet physics doklady, Vol. 10. 707–710.
[19] James MacQueen et al. 1967. Some methods for classification and analysis of multivariate observations. In Proceedings of the fifth Berkeley symposium on mathematical statistics and probability, Vol. 1. Oakland, CA, USA., 281–297. [20] F. Pedregosa, G. Varoquaux, A. Gramfort, V. Michel, B. Thirion, O. Grisel, M.
Blondel, P. Prettenhofer, R. Weiss, V. Dubourg, J. Vanderplas, A. Passos, D. Cour-napeau, M. Brucher, M. Perrot, and E. Duchesnay. 2011. Scikit-learn: Machine Learning in Python. Journal of Machine Learning Research 12 (2011), 2825–2830. [21] Jian Pei, Jiawei Han, Behzad Mortazavi-Asl, Helen Pinto, Qiming Chen, Umeshwar
Dayal, and MC Hsu. 2001. Prefixspan: Mining sequential patterns efficiently by prefix-projected pattern growth. In Proc. of the 17th int’l conf. on data engineering. 215–224.
[22] Jian Pei, Jiawei Han, Behzad Mortazavi-Asl, Jianyong Wang, Helen Pinto, Qiming Chen, Umeshwar Dayal, and Mei-Chun Hsu. 2004. Mining sequential patterns by pattern-growth: The PrefixSpan approach. IEEE Transactions on knowledge and data engineering 16, 11 (2004), 1424–1440.
[23] Bruno Rossi, Stanislav Chren, Barbora Buhnova, and Tomas Pitner. 2016. Anom-aly detection in Smart Grid data: An experience report. In Systems, Man, and Cybernetics (SMC), 2016 Int’l Conf. on. IEEE, 002313–002318.
[24] Peter J Rousseeuw. 1987. Silhouettes: A graphical aid to the interpretation and validation of cluster analysis. J. of computational and applied mathematics 20 (1987), 53–65.
[25] Stan Salvador and Philip Chan. 2007. Toward accurate dynamic time warping in linear time and space. Intelligent Data Analysis 11, 5 (2007), 561–580. [26] Wei Shen, Jianyong Wang, and Jiawei Han. 2014. Sequential pattern mining. In
Frequent Pattern Mining. Springer, 261–282.
[27] Ramakrishnan Srikant and Rakesh Agrawal. 1996. Mining sequential pat-terns: Generalizations and performance improvements. Advances in Database Technology–EDBT’96 (1996), 1–17.
[28] Kazuaki Tanida. 2017. FastDTW algorithm source code. (2017).
[29] Lucas Vendramin, Ricardo JGB Campello, and Eduardo R Hruschka. 2009. On the comparison of relative clustering validity criteria. In Proceedings of the 2009 SIAM International Conference on Data Mining. SIAM, 733–744.
[30] Mohammed J Zaki. 2001. SPADE: An efficient algorithm for mining frequent sequences. Machine learning 42, 1 (2001), 31–60.