This is the published version of a paper published in AIP Advances.
Citation for the original published paper (version of record):
Abbasiasl, T., Niazi, S., Sheibani Aghdam, A., Chen, H., Cebeci, F C. et al. (2020)
Effect of intensified cavitation using poly (vinyl alcohol) microbubbles on spray
atomization characteristics in microscale
AIP Advances
Access to the published version may require subscription.
N.B. When citing this work, cite the original published paper.
Permanent link to this version:
poly(vinyl alcohol) microbubbles on spray
atomization characteristics in microscale
Cite as: AIP Advances 10, 025318 (2020); https://doi.org/10.1063/1.5142607
Submitted: 16 December 2019 . Accepted: 28 January 2020 . Published Online: 12 February 2020 Taher Abbasiasl , Soroush Niazi , Araz Sheibani Aghdam, Hongjian Chen , Fevzi Çakmak Cebeci
, Morteza Ghorbani , Dmitry Grishenkov, and Ali Koşar
ARTICLES YOU MAY BE INTERESTED IN
Energy harvesting with micro scale hydrodynamic cavitation-thermoelectric generation
coupling
AIP Advances
9, 105012 (2019); https://doi.org/10.1063/1.5115336
Increasing the stability of nanofluids with cavitating flows in micro orifices
Applied Physics Letters
109, 104101 (2016); https://doi.org/10.1063/1.4962330
Biomedical device prototype based on small scale hydrodynamic cavitation
Effect of intensified cavitation using
poly(vinyl alcohol) microbubbles on spray
atomization characteristics in microscale
Cite as: AIP Advances 10, 025318 (2020);doi: 10.1063/1.5142607
Submitted: 16 December 2019 • Accepted: 28 January 2020 • Published Online: 12 February 2020
Taher Abbasiasl,1,2 Soroush Niazi,1,2 Araz Sheibani Aghdam,2 Hongjian Chen,3
Fevzi Çakmak Cebeci,1,2 Morteza Ghorbani,1,2,3 Dmitry Grishenkov,3 and Ali Ko¸sar1,2,4,a)
AFFILIATIONS
1Sabanci University Nanotechnology Research and Application Center, 34956 Tuzla, Istanbul, Turkey 2Faculty of Engineering and Natural Science, Sabanci University, 34956 Tuzla, Istanbul, Turkey
3Department of Biomedical Engineering and Health Systems, KTH Royal Institute of Technology, SE-141 57 Stockholm, Sweden 4Center of Excellence for Functional Surfaces and Interfaces for Nano-Diagnostics (EFSUN), Sabanci University, Orhanli,
34956 Tuzla, Istanbul, Turkey
a)Author to whom correspondence should be addressed:kosara@sabanciuniv.edu
ABSTRACT
In this study, cavitating flows inside a transparent cylindrical nozzle with an inner diameter of 0.9 mm were visualized, and the effect of cavitation on atomization characteristics of emerging sprays was investigated. Different patterns of cavitating flows inside the nozzle were visualized using a high-speed camera. In-house codes were developed to process the captured images to study the droplet size distribution and droplet velocity in different flow regimes. The results show that cavitating flows at the microscale have significant effects on atomization characteristics of the spray. Two working fluids, namely, water and poly(vinyl alcohol) microbubble (PVA MB) suspension, were employed. Accordingly, the injection pressures were detected as 690 kPa, 1035 kPa, and 1725 kPa for cavitation inception, supercavitation, and hydraulic flip flow regimes in the case of water, respectively. The corresponding pressures for the aforementioned patterns for PVA MB suspension were 590 kPa, 760 kPa, and 1070 kPa, respectively. At the microscale, as a result of a higher volume fraction of cavitation bubbles inside the nozzle, there is no large difference between the cavitation numbers corresponding to cavitating and hydraulic flip flows. Although the percentage of droplets with diameters smaller than 200 μm was roughly the same for both cases of water and PVA MB suspension, the Sauter mean diameter was considerably lower in the case of PVA MBs. Moreover, higher droplet velocities were achieved in the case of PVA MBs at lower injection pressures.
© 2020 Author(s). All article content, except where otherwise noted, is licensed under a Creative Commons Attribution (CC BY) license (http://creativecommons.org/licenses/by/4.0/).https://doi.org/10.1063/1.5142607., s
I. INTRODUCTION
The cavitation phenomenon results in phase change inside liq-uid and formation of several bubbles, and it has significant effects on many processes such as atomization and break-up of the liq-uid jet.1 Understanding the behavior of cavitating flow regimes in the microscale is a challenging task, and the amount of related data in the literature is not as abundant as that corresponding to macro- or miniscale. In this regard, Mishra and Peles2
experimen-tally investigated hydrodynamic cavitation in a short microchannel,
and they showed that the cavitation phenomenon was different at the microscale. There are also some numerical studies about cavi-tating flows at the microscale.3,4The collapse of cavitation bubbles at the outlet of the nozzle enhances spray atomization. Therefore, researchers attempt to move the cavitation bubbles to the end of the nozzle to reduce the length of liquid jet just after the nozzle. According to the studies by Payri and co-workers, cavitating flows lead to a rise in the spray cone angle as well as in the speed of the injected flow.5,6 During the past decade, several studies have focused on the cavitation phenomenon inside transparent nozzles
and its impact on spray characteristics.7–10 For example, Suh and Lee11investigated the impact of cavitation on diesel fuel atomization in 2D transparent acrylic resin nozzles with different length to width ratios. They studied the flow inside the nozzle and the spray mor-phology under different experimental conditions. There are other similar studies on the importance of cavitation and its effect on spray characteristics.7,12
To be able to exploit the effect of cavitation on spray formation, it is crucial to have a better understanding about the atomization quality, droplet size, cone angle, and other important parameters of the spray. For this purpose, several experimental and numeri-cal studies have concentrated on the effect of cavitating flows on spray formation over a wide variety of operating conditions.13–16In this regard, Nurick17proposed an experimental model to explain the behavior of the discharge coefficient within sharp-edged circular and rectangular orifices. The mixing uniformity of spray was established under different conditions, during cavitating and non-cavitating flows. Cavitation was shown to reduce the mixing uniformity for cir-cular orifice elements. Since most of the atomization nozzles are of micro- or miniscale (tens to several hundred micrometers), it is a challenging task to optically investigate cavitating flows inside the nozzle and its effect on the spray. As a result, there are numerous numerical studies on cavitating flows in nozzles and its impact on the atomization quality of sprays. Örleyet al.18performed a large eddy
simulation of cavitating flows inside rectangular nozzles. They did their numerical study based on the experimental configuration of Souet al.12There was a good agreement between the simulation and experimental results. According to the numerical results, the main mechanisms, which promote primary break-up, are turbulent fluc-tuations caused by the collapse of cavitation bubbles near the nozzle exit, gas entrainment into the nozzle, and collapse events inside the liquid jet adjacent to the liquid gas interface.
Most of the experimental studies focusing on the effect of cav-itating flows on jet atomization and spray characteristics have uti-lized 2D rectangular nozzles so that they could allow visualization of cavitating flows inside nozzles. As a result, there is still a consid-erable lack of information on the influence of cavitation inside 3D nozzles (e.g., cylindrical nozzles) on spray formation. Some studies employed nozzles with circular cross sections to investigate differ-ent stages of cavitation developmdiffer-ent inside the nozzle. However, they did not offer any noticeable information about the atomization features of sprays.9,19
The majority of studies on the transition from liquid jet to spray with separated droplets considered flow regimes inside the macroscale nozzles to examine the impact of cavitation on the spray performance,7,11,12,19–21 while the number of studies focusing on the effect of cavitating flows inside micro-nozzles on spray proper-ties is rather scarce.10,14,22Besides, in most of the investigations on
spray behavior in microscale, there are limited visualization efforts for observing the development of cavitating flows inside nozzles, and the captured images are not very clear to distinguish different stages of cavitation and its effect on liquid jets and atomization of sprays.22–25
In order to intensify the cavitating flows of water inside nozzles and to reduce the required injection pressure for cavitation incep-tion, some studies proposed roughened surfaces26 and droplets27
or microbubbles26 in the working fluid. Aghdam et al.28 modi-fied the inner surface of microchannels using layer-by-layer (LBL)
assembled Slippery Liquid-Infused Porous Surfaces (SLIPS). This technique of surface modification significantly reduced the incep-tion pressure. Moreover, in the roughened microchannel, super-cavitation conditions could be achieved for all the microchannels at lower upstream pressure, whereas supercavitation conditions did not occur for a number of microchannels in the same range of upstream pressures for the non-roughened surfaces. Ghorbani et al.26implemented both roughened microchannels and
microbub-bles [poly(vinyl alcohol) microbubmicrobub-bles] for the purpose of intensi-fying cavitation and lowering the required pressure for cavitation inception. They achieved promising results in this regard.
Even though the dominant role of supercavitation in chang-ing the flow regimes inside micro/macro channels has been already shown,12,19,29there is still a lack of information about the effect of supercavitation on sprays. For example, while Suh and Lee11 com-pared atomization characteristics of sprays in cavitating and turbu-lent flows, the effect of supercavitation was not discussed in that study. There are some studies addressing the impact of supercavi-tation on sprays; however, they did not offer detailed data related to droplet count, size distribution, and velocity.4,7 In their study,
Liet al.30investigated the effect of cavitating flows inside a micro-size single-hole diesel injector on sprays; nevertheless, they did not provide sufficient information about atomization characteristics.
In this study, first, cavitating flows inside a micro-nozzle made of transparent quartz are visualized, and the effect of cavitation on emerging spray is investigated in terms of atomization character-istics and velocity of the departed droplets. Then, inspired by the above-mentioned studies, water suspensions of poly(vinyl alcohol) microbubbles (PVA MBs) are employed as another working fluid to study the effect of intensified cavitation on the properties of the spray. This study illustrates the potential of PVA MBs as cheap, sta-ble, chemically versatile, and non-toxic suspensions in spray atom-ization. Moreover, the inner surface of the nozzle is also roughened to further intensify cavitation and to lower the required injection pressure for cavitation inception. Enhanced atomization character-istics of the spray are achieved as a result of cavitating flows and by using PVA MBs suspension inside the nozzle with surface rough-ness enhanced cavitation. The dominant role of supercavitation in atomization properties of the emerging spray is also discussed in detail.
II. EXPERIMENTAL APPARATUS AND PROCEDURE A. Experimental apparatus
Figure 1shows a schematic of the experimental setup. A high-pressure nitrogen tank was used to provide the desired injection pressure of the working fluid. A micro-filter was employed to elimi-nate the particles larger than 15 μm from the liquid. Pressure gauges were placed at different locations of the system to monitor the pres-sure. One pressure gauge was mounted immediately before the noz-zle in order to measure the injection pressure of the working fluid. All the parts before the transparent tube were made of stainless steel to avoid any chemical reaction with the working fluid. The nozzle was made of transparent quartz to allow the visualization of cavi-tating flows inside the nozzle. The geometry of the quartz nozzle is illustrated inFig. 2, and the detailed dimensions of the nozzle are presented inTable I. The inner and outer diameters of the first part of the nozzle were exactly the same as the stainless-steel tube to have
FIG. 1. Schematic of the experimental setup.
negligible pressure losses along the experimental setup. Before per-forming the experiments, in order to minimize the gas content in the working fluid, degassing was performed by exposing the working fluids to vacuum. The first part of the quartz tube was long enough to provide sufficient time for observing the working fluid and to make sure that there was no undesired disturbance in the working fluid before entering the nozzle (Fig. 2). The experiments were con-ducted at ambient pressure of 1 atm and a temperature of 293 K. Various injection pressures were tested to investigate the cavitating flow inside the nozzle.
A high-speed camera (Phantom V9.1) was used to the cap-ture real-time images of cavitating flows as well as liquid jets, and a Veritas miniConstellation 120.28○light-emitting diode (LED) light source was employed as the illumination system. The light source
FIG. 2. Schematic of the test nozzle.
TABLE I. Detailed specifications of the test nozzle.
L (total length of the quartz tube) 6 cm
LN(length of the nozzle section of the tube) 4 mm
D1(outer diameter of the tube) 6.35 mm
D2(inner diameter of the upstream section of the tube) 3.05 mm DN(inner diameter of the nozzle part of the tube) 0.9 mm
generated white light flashes, and the pulse duration could be as short as 2 μs with a maximum pulse rate of 100 kHz. The shad-owgraphy method was implemented to observe the flows inside the transparent nozzle and its effect on the emerged spray. The high-speed camera was connected to a personal computer (PC) to record the real-time images of the experiments using PCC software version 3.4.788.0 (AMETEK, Inc., Berwyn, PA). The resolution of the cap-tured images was 1280× 800 pixel for cavitation visualization inside the nozzle. However, for the spray studies, the resolution of the 192× 192 pixel was chosen to be able to capture the droplets with high velocity as clear as possible. The exposure time was adjusted to the value of 2 μs.
B. Surface modification
The inner surface of the nozzle part of the tubes was treated to have SLIPS (Slippery Liquid Induced Porous Surfaces) coat-ings to enhance cavitating flows and to reduce the probability of the collapse of the bubbles, which are generated upon cavita-tion, before leaving the nozzle.28 For this purpose, by using the layer-by-layer (LBL) assembly technique, five by layers of positively charged poly(allylamine hydrochloride) with an average molecu-lar weight of 50 000 (PAH) and negatively charged poly(sodium 4-styrenesulfonate) with an average molecular weight of 70 000 (SPS) were assembled on the surface of the nozzle, and, then, 10 by layers of PAH polyelectrolyte and homemade silica nanopar-ticles with 40 nm and 80 nm in diameter were deposited on the surface of the nozzle. The LBL assemblies were applied using the fluidic assembly technique as described in our previous work.27
The affinity of the surface was modified using 1H,1H,2H,2H-perfluorodecyltriethoxysilane 97% (PFDTS), which was applied by chemical vapor deposition and was followed by heat treatment to increase the stability of the fluorinated surface. Finally, the Slippery
FIG. 3. SEM image of the layer-by-layer assembled surface on a quartz plate.
Liquid-Infused Porous Surfaces (SLIPS) were formed by entrap-ping a fluorinated lubricant within the pores of the assembled sur-face. The surface modification increases the chance of the Fomblin YLVAC 25/6 with an average molecular weight of 3300 (PFPE) to be trapped within the pores of the surface. SEM (Scanning Electron Microscopy) image of the LBL assembled surface on a quartz plate is shown inFig. 3. The detailed description of the surface modifi-cation process and achieving SLIPS was described in our preview studies.27,28
The AFM results of smooth and rough surfaces are included in
Table II. The peak to peak roughness of the rough surface is six times the smooth ones. The projected surface shows the surface increase due to the increased roughness. Accordingly, the projected surface for the rough surface reaches 12.8%. The Rq or rms value of the rough surfaces is 30 times more than the smooth ones.
C. Protocol for PVA MB fabrication
The fabrication protocol of PVA MBs was described by Cav-alieriet al.314 g of PVA was dissolved in 200 ml Milliq-water and was heated up to 80○C. 380 mg of NaIO
4was added into the solu-tion to form telechelic PVA at a temperature of 80○
C for 1 h. The telechelic PVA solution was then cooled down to room tempera-ture. A homogenizer (UltraTurrax, IKA, Königswinter, Germany)
TABLE II. The AFM results of smooth and modified surfaces. (Superscripts: 1. Height difference between the maximum and minimum, 2. Surface area difference between the actual and projected surfaces, 3. Root mean square roughness of the surface, 4. Arithmetic average of the absolute values of the roughness).
Smooth surface Rough surface
Z range1(nm) 13.2 97.4
Surface %2 0.423 12.8
Rq3(nm) 0.583 15.3
Ra4(nm) 0.427 12.2
equipped with a stainless-steel tip S 25 N - 25 G (UltraTurrax, IKA, Königswinter, Germany) was employed to apply sharing force at the air/water interface of the telechelic PVA solution to cross-link the telechelic PVA under room temperature for 2 h. The resulting PVA MBs were harvested and washed 10 times. The PVA MBs have relatively a narrow size distribution below 10 μm with an average diameter (normalized by volume) of 3.5 μm± 0.77 μm and a con-centration of 2.72× 10⁸ml−1. The volume fraction of the master suspension is estimated as 3.5× 10⁻⁴.
In our study, an aqueous suspension of stable air-filled microbubbles was prepared at room temperature and at pH 5 using 2% W/V telechelic PVA aqueous solution. The surface tension of 2% PVA solution is approximately 0.055 N/m.32The density of the PVA powder used in our study is 1269 kg/m333The vapor pressure of water in the PVA aqueous solution is 3.54 kPa,34while the vapor pressure of pure water is 2.33 kPa. The higher value of the vapor pressure for the PVA aqueous solution results in the earlier arrival of the cavitation inception for the case of PVA suspension.
PVA microbubbles were prepared separately and then injected into the system for testing. PVA alone is a water-soluble powder, which is not the subject of the manuscript. Microbubbles with the PVA shell were suspended in water. All PVA fragments or bro-ken, formed, or unformed shells were removed from the fabrication solution during the 10 day filtering procedure using a separation funnel. The fabrication and filtering protocol and complete physi-cal characteristics of the PVA MBs were reported in our previous study.26
The PVA MBs will float to the top if the suspension stands still. Moreover, the PVA MBs have a high echogenicity under ultrasound imaging. Such pieces of evidence suggest that the PVA MBs have a core with low density, great mechanical impedance mismatch with solid (liquid), and a high compressibility. Therefore, the core of MBs cannot be solid or liquid; it must be gas. Furthermore, Kothapalli et al. (Kothapalli et al. 2015) reported the pumping-out fracturing mechanism of PVA MBs.35They observed that under a high pres-sure ultrasound wave, the shell of MBs cracked and the gas of PVA MB core leaked out from a shell-less bubble and finally dissolved in water.
The size of PVA MBs was obtained by a microscope in this study. Similar results were obtained by confocal laser microscopy36
and dynamic light scattering.37 D. Experimental procedure
Water and PVA MB suspensions were used as the working flu-ids to study the effect of cavitation on flow inside the nozzle and spray atomization. The physical properties of PVA MB suspensions are included inTable III.
TABLE III. Physical properties of the working fluid.
Working fluid Suspension of PVA MBs
Temperature (K) 293
Density (kg⋅m−3) 1269
Viscosity (mPa⋅s) 1.00
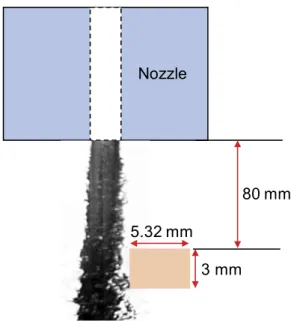
FIG. 4. Position of the window used for spray visualization during droplet
measure-ments.
Experiments were conducted under various test conditions [various Reynolds numbers (Re) and cavitation numbers (σ)]. Cavi-tation number, which is an indicator of the intensity of caviCavi-tation, is defined as
σ= Pi− Pv
(ρV2/2), (1)
where Pi, Pv, ρ, and V are the injection pressure, vapor pressure, den-sity of the working fluid, and velocity in the nozzle, respectively. The velocity of the fluid is the ratio of the flow rate to cross-sectional area of the nozzle.
Reynolds number is defined as Re=ρVD
μ , (2)
where D and μ are the nozzle diameter and viscosity of the working fluid, respectively.
Sauter mean diameter (SMD), which is used in atomization studies, is defined as D32= ∑nid 3 i ∑ nid2i , (3)
where D32is the Sauter mean diameter (SMD), niis the number of droplets in the size range i, and diis the diameter of droplet in the size range i.
E. Image processing
In order to obtain spray atomization characteristics and the effect of cavitation on the droplet size and velocity distribution, spray visualization experiments were conducted at a location as near as possible to the emerging liquid jet.11Figure 4demonstrates the precise location of the window with respect to the nozzle and liq-uid jet, which was used to capture images for the droplet size and velocity calculations. For water experiments, four injection pres-sures corresponding to four different flow regimes inside the nozzles were chosen to investigate the atomization characteristics, namely, (1) non-cavitating flow, (2) cavitation inception, (3) developed cav-itation, and (4) supercavitation. According to the results of the atomization study in the case of water (Sec. III C), supercavita-tion has the dominant effect on enhancing atomizasupercavita-tion, and as a result, the atomization study was not performed for developed cav-itation of PVA MB suspension. Spray was observed with a sam-pling speed of 24 096 images per second. For droplet size distri-bution at different pressures, 250 frames with a time difference of 830 μs were selected so that the time difference between the frames could be long enough to avoid appearance of the same droplet on two different frames. The selected images were processed using an in-house developed code in MATLABTM2018a (MathWorks, Inc., Natick, MA) to recognize the droplets on each frame and to deter-mine their diameters. For better understanding of the droplet size distribution during non-cavitating and cavitating flows, the Sauter mean diameter (SMD) was calculated from the measured droplet diameters.
For droplet velocity calculations, 300 pairs of successive frames were selected. These frame pairs were selected in such a way that none of them shared the same droplets. After processing the frames and determining the location of the same droplet on each frame of the pairs, the displacement of the droplet was found and used to obtain the velocity of the droplet.Figure 5shows typical loca-tions of two different droplets in two successive frames, which were used for velocity calculations. After finding the displacement of the droplets, the velocity could be easily calculated using the time step of the image capturing experiments. Another code was developed in MATLAB 2018a to find the velocity of droplets. For all the selected pressures, the spray visualization for droplet calculations was performed at exactly the same location so that the results could be comparable. In this study, only x and y components of the veloc-ity of the droplets were calculated, and the velocveloc-ity in the z direction
FIG. 5. Location of two different droplets
in two successive frames: (a) frame 1, (b) frame 2 (D1: droplet 1, D2: droplet 2). Note: The time difference between the frames is approximately 41.5μs.
FIG. 6. Spray cone angle (θ).
for the recognized droplets in the selected frames was considered to be zero. The selection of the frames for velocity studies was made in such a way that the same droplet could be recognized in two suc-cessive frames with the same size. However, if the droplets have a
slight velocity in the z direction, the same droplet might not be rec-ognized in the second frame. This method of frame selection for velocity studies ruled out many captured images. Since the nozzle has a symmetrical circular cross-section, it is valid to assume that if we consider all the droplets, x and z components of the droplet velocities will be approximately the same.
Spray cone angles of the liquid jets were measured from the cap-tured images in the proximity of the nozzle exit (15 mm downstream the nozzle exit, similar to the study of Souet al.12). For each injec-tion pressure, 20 frames of the liquid jets with a time difference of approximately 5 ms were used to determine the spray angle as shown inFig. 6, and the average of the 20 measured angles was reported as the spray cone angle at each injection pressure. The method pre-sented in the study of Ghorbaniet al.38was implemented to measure the spray cone angles.
III. RESULTS AND DISCUSSION A. Flow regimes
Flow regimes for the case of water in the nozzle with an inner diameter of 0.9 mm are shown inFig. 7. For cavitation numbers (σ) greater than 1.086, no cavitation bubbles are observed inside the nozzle, and the liquid jet outside the nozzle forms a “wavy jet.” For the cavitation number of 1.086 (P = 690 kPa), cavitation bub-bles appear around the edge of the nozzle entrance. The inception inside the nozzle switches to developed cavitation at the cavitation number of 1.069. The transition from inception to developed cavi-tation is very quick, which implies that the cavicavi-tation bubbles could reach to the end of the nozzle within a short time after the cavita-tion incepcavita-tion. In the developed cavitating flow regime, the liquid outside the nozzle still has the form of the “wavy jet.” With a fur-ther increase in the injection pressure, the flow inside the channel becomes supercavitation, where the cavitation region inside the noz-zle is extended to near the noznoz-zle exit (1.059< σ < 1.069). Under supercavitation conditions, enhanced atomization of the liquid jet can be seen, which causes the formation of more droplets and lig-aments. This morphology of the liquid jet is named “spray”, which has a wider angle compared to the “wavy jet.” For injection pressures higher than 1725 kPa, the nozzle flow exhibits hydraulic flip behav-ior, where the formation of the “flipping jet” outside the nozzle is observed.
FIG. 7. Cavitating flow development
inside the circular transparent quartz tube with a nozzle diameter of 0.9 mm for water.
FIG. 8. Different flow regimes and flow
rate in the nozzle at different injection pressures.
Before reaching cavitating flow conditions, the flow inside the nozzle is turbulent. At high injection pressures (>690 kPa), the gen-erated cavitation bubbles could reach the region of the nozzle exit, which causes a wider cone angle. In the hydraulic flip regime, the cavitation bubbles extend to the exit of the nozzle without being attached to the channel wall. In this case, the cone angle could even be lower than the angle corresponding to the cavitation inception case. The hydraulic flip happens when the cavitation bubbles move to the end of the nozzle, and the air flow existing at the outlet at the atmospheric pressure fills one of the boundaries of the nozzle. As a result, the air passage enters the nozzle causing backflow. This flow pattern is rarely observed in the cavitation studies and is useful in different industrial applications such as hydroentangling.
Souet al.12,19and Suh and Lee11used 2D rectangular and
cylin-drical nozzles to study the effect of cavitating flows on spray char-acteristics of injected flows. For these studies, the nozzles were of conventional scales. In the present study, despite the circular cross section of the nozzle and a much smaller diameter of the nozzle, the captured images of the development of cavitating flows at dif-ferent injection pressures could be clearly visualized. As can be seen inFig. 7, at the microscale, the cavitation bubbles fill a significant portion of the nozzle, leading to a lower liquid flow rate from the nozzle exit. After cavitation inception, increasing injection pressure leads to a higher volume fraction of cavitation bubbles, which sug-gests that small differences in cavitation numbers are experienced between cavitation inception and hydraulic flip conditions.
FIG. 9. Cavitating flow development inside the circular transparent quartz tube with a nozzle diameter of 0.9 mm with roughened surface for working fluid of PVA MB
TABLE IV. Comparison of the injection pressures for different flow regimes. Water (nozzle without PVA MBs (nozzle with
roughness) (kPa) roughness) (kPa)
No cavitation −690 −590
Cavitating flow 690–1725 590–1070
Hydraulic flip 1725 1070
Figure 8shows the effect of the injection pressure on the liq-uid flow rate and cavitation number. As can be seen, an increase in the injection pressure results in higher liquid flow rates. The flow rate increases sharply at low injection pressures compared to higher injection pressures until the hydraulic flip region, at which the flow rate starts to rise more steeply. This behavior is demonstrated in
Fig. 8, as the cavitation number is inversely proportional to the square of the liquid velocity. In addition,Fig. 8demonstrates differ-ent regimes of liquid jets. As mdiffer-entioned before, both non-cavitation and developed cavitation flow regions correspond to wavy jet flows, while supercavitation forces the jet to acquire the spray form. The spray velocity increases aggressively after supercavitation, which is depicted in the flow rate profile beyond the injection pressure of 1035 kPa. This fact implies that the discharge has a significant effect on the flow pattern in the hydraulic flip region.
After recording different flow regimes corresponding to various injection pressures in the case of water, the second set of experiments was conducted for PVA MB suspensions using the quartz tube with a roughened nozzle.Figure 9presents flow regimes inside the nozzle for the second set of experiments. The stages of development of cavi-tating flows are similar to that in the case of water in the nozzle with-out roughness. InTable IV, the injection pressures corresponding to
FIG. 10. Measured cone angles. (a)
Working fluid of water (nozzle without roughness). (b) Working fluid of PVA MB suspensions (nozzle with roughness).
FIG. 11. Droplet recognition during
the image processing using MATLAB™ 2018a software. (a) Raw image, (b) threshold image, and (C) final processed image with boundaries for each recog-nized image.
different flow patterns for water inside the nozzle without roughness and PVA MB suspension inside the nozzle with roughened surface are compared. In the case of PVA MB suspension, cavitation incepts at the injection pressure of 590 kPa, which is 100 kPa lower than that in the case of water. As can be seen inTable IV, for working fluid of PVA MB suspension, the injection pressure range for cavi-tating flows is 590–1070, which is smaller compared to the cavicavi-tating flow range of 690–1725 kPa in the case of water. In the case of PVA MBs, the injection pressures corresponding to cavitation inception, supercavitation, and hydraulic flip flows are 590 kPa, 760 kPa, and 1070 kPa, respectively, which shows a decrease of 100 kPa, 275 kPa, and 655 kPa for the same flow regimes in the case of water. Moreover, PVA MBs result in enhanced atomization characteris-tics, which will be discussed later. Therefore, PVA MB suspension has the potential in intensifying the cavity clouds with the consid-eration of the surface and geometrical characteristics. Our previous study proves that the pressure can be reduced to much smaller val-ues (below to the vapor saturation pressure) in the case of PVA MB suspension.26This characteristic causes an earlier arrival of dif-ferent patterns of the cavitation compared to that in the case of water. The flow pattern transitions to supercavitation conditions at 1070 kPa in the case of PVA MBs, which is a comparatively low injection pressure for engineering and industrial applications. B. Spray cone angle
The spray cone angles for water and PVA MB suspensions were averaged and plotted against the injection pressure inFig. 10. According toFig. 10(a), at very low values of injection pressures, water liquid jet is completely flat and has a cone angle of 0○. With an increase in the injection pressure, waves start to appear on the liquid jet and raises the cone angle (0○< θ < 2○). At a pressure of 690 kPa, which corresponds to the cavitation inception, the spray cone angle begins to increase at a higher rate until the pressure of 1725 kPa at which the hydraulic flip region makes the cone angle drop at a considerable rate. To observe the effect of PVA MBs on the cone angle, the same approach was implemented to measure the spray cone angle of the liquid jet of PVA MBs. As can be seen in
Fig. 10(b), the measured cone angles of PVA MB liquid jet have a similar trend as in the case of water. As mentioned in Sec.III A, for PVA MBs, cavitation incepts at a lower pressure, which leads to a steep increase in the spray cone angle at a lower pressure com-pared to the case of water. Although the measured cone angle of PVA MBs is bigger than in the case of water, there is not any consid-erable difference between the spray cone angles of water and PVA MB suspensions. According toFig. 10, the largest spray cone angle was under supercavitation conditions in the cases of both water and PVA MB suspensions. Under supercavitation conditions, the cavita-tion bubbles could reach near the nozzle exit region, and the collapse of these bubbles causes a significant energy release, which results in
the detachment of more droplets from the mother jet leading to a larger spray cone angle.
C. Atomization and droplet size distribution
Figure 11 shows the steps of image processing for a sample frame and the recognized droplets by the developed in-house code after processing. As can be seen, the developed code has a high capa-bility of spotting the droplets with an acceptable accuracy. A certain threshold was specified so that the method of counting the droplets on all of the pictures for all the pressures was the same.
Table Vpresents the selected pressures to study the influence of cavitation on atomization and droplet size distribution. As men-tioned before, since the results in the case of water proved that supercavitation plays a predominant role in spray atomization, and due to quick transition to supercavitation after cavitation inception, the atomization study was not performed for developed cavitation in the case of PVA MB suspension inside the roughened nozzle. The images captured during the spray visualization of mentioned pres-sures were used for droplet recognition and to determine the droplet size distribution, which was utilized to reveal the effect of cavitation on spray characteristics of water and PVA MB suspension.
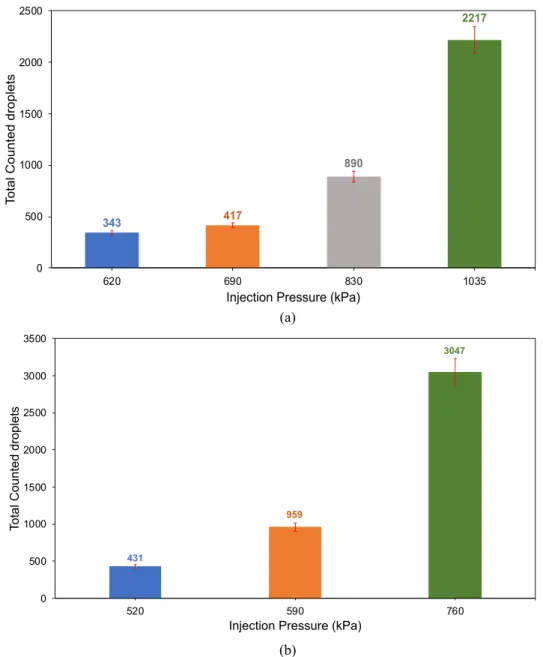
Figure 12shows the effect of cavitation on total droplet num-bers. In the case of water, there is not any considerable increase between counted droplets of non-cavitation and cavitation inception flow regimes. However, when the flow inside the nozzle becomes developed cavitation, there is a significant rise in the droplet num-ber. As can be seen inFig. 12(a), there is a substantial increase in the droplet number for the supercavitation flow pattern, which under-lines the importance of this flow regime in atomization characteris-tics of the spray. According toFig. 12(b), before cavitation inception, there is not any noticeable change in the total number of droplets in the case of PVA MB suspension compared to that in the case of water. However, for cavitating flows, the total droplet number significantly increases, which proves the beneficial impact of PVA MBs and surface roughness in droplet break-up and improving the atomization characteristics of cavitating flows, in addition to low-ering the pressure required to incept the cavitating flow inside the nozzle.
TABLE V. Selected pressures to capture the images of the spray for droplet size and velocity determination.
Water (kPa) PVA MBs suspension (kPa)
Non-cavitating flow 620 520
Cavitation inception 690 590
Developed cavitation 830 . . .
FIG. 12. Effect of cavitation on total
counted droplets. (a) Total counted droplets for working fluid of water (noz-zle without roughness). (b) Total counted droplets for working fluid of PVA MB suspension (nozzle with roughness).
Figure 13 displays the droplet size distribution for non-cavitating flow and different stages of non-cavitating flows. According toFig. 13(a), in the case of water, the percentage of droplets with diameter smaller than 200 μm increases considerably for super-cavitation flows compared to super-cavitation flows (89.2% for non-cavitation and 94.9% for supernon-cavitation). In the case of PVA MB suspension [Fig. 13(b)], even though the percentage of droplets with diameter smaller than 200 μm, noticeably, increases during non-cavitation flows compared to water (from 89.2% to 97.4%), it is roughly the same during supercavitation flows for both cases (94.9% for water and 95.2% for PVA MB suspension). This outcome indi-cates the effect of the PVA MB suspension on increasing the quality of the spray atomization. As a result, larger impact pressures pro-duced by the MB suspension lead to reduction in the liquid jet
length and smaller droplet sizes during the primary and secondary breakups.26
Figure 14 presents the overall SMD distributions for non-cavitating and non-cavitating flows. As shown, for both water and PVA MB suspension, the SMD for cavitating flow is lower than that for non-cavitating flow, which implies the dominant role of cavi-tation in enhancing the atomization. This is due to the high energy release and localized shock waves from bubble collapse, which leads to fine atomization. When the collapse of cavitation bubbles hap-pens, the energy stored on the surface of cavitation bubbles is con-verted into divergent breakup energy, which leads to enhanced atomization. As can be seen in Fig. 14(b), the overall SMD of PVA MB suspension is noticeably lower compared to the SMD of water for both non-cavitation and cavitating flow conditions,
FIG. 13. Effect of cavitation on droplet
size distribution. (a) Droplet size distri-bution for working fluid of water (noz-zle without roughness). (b) Droplet size distribution for working fluid of PVA MB suspension (nozzle with roughness).
FIG. 15. Raw and processed images to
locate the droplets on two successive frames. (a) and (b) Raw images; (c) and (d) respective processed images.
which suggests the intensified liquid atomization as a result of using PVA MBs.
D. Droplet velocity distribution
Figure 15shows an example of two successive frames processed by the developed code in MATLAB 2018a, which were used to find the locations of the droplets in each frame so that the velocity of the droplets could be calculated based on the method explained in Sec.II E.
After performing the same image processing on all the selected frames, the extracted data were used to find the velocity of the droplets.Figures 16(a)and16(b)exhibit the water droplet veloci-ties in x and y directions, respectively, for all the injection pressures presented inTable V. Increasing the injection pressure results in higher liquid flow rates leading to larger velocities of the injected liquid jet. The velocity of droplets in the x direction is much lower than that in the y direction, which indicates the low spray cone angle. As can be seen inFig. 16(a), after cavitation inception, the distance between velocity trendlines increases compared to the dis-tance between the velocity trendlines before cavitation inception (620 kPa and 690 kPa trendlines), which is the reason for the steep increase in the spray cone angle upon cavitation inception in Fig. 10(a). From Figs. 16(a) and 16(b), it can be noted that during supercavitation, both x and y components of the velocity of droplets increase considerably. This implies that the supercav-itation flow inside the nozzle plays a dominant role in enhanc-ing spray atomization besides makenhanc-ing the spray have a larger cone angle.
Suh and Lee11used a phase Doppler particle analyzer to mea-sure the velocity at the nozzle exit as well as the velocity of the droplets. They presented mean droplet velocities for turbulent flows, cavitating and flipping jet flow regions. The trend and increasing rate of the velocity of the droplets in different flow regions in this study are consistent with the results of their study.
The velocity fluctuations of the droplets with different diam-eters are shown as range bars inFig. 16(also included inFig. 17). Velocity fluctuations range from∼0.05 to ∼0.15 m/s in the x direc-tion and from∼0.5 to ∼1.5 m/s in the y direction.
FIG. 16. Velocity distribution of the departed droplets from the water jet
immedi-ately before and during cavitating flow inside the nozzle. (a) Velocity of the droplets in x direction. (b) Velocity of the droplets in y direction.
FIG. 17. Velocity distribution of the departed droplets from the PVA MB
sus-pension jet immediately before and during cavitating flow inside the roughened nozzle. (a) Velocity of the droplets in x direction. (b) Velocity of the droplets in y direction.
Figure 17presents x and y components of the droplet veloc-ity in the case of PVA MBs in the roughened nozzle, respectively. The magnitude and trend in the velocity of the suspension droplets in the x direction are similar to those of water droplets in the x direction. Nonetheless, there is a minor increase in the magnitude, which explains the larger spray cone angle of PVA MB suspension compared to water. Comparing the y components of the velocity of the suspension droplets with water droplets in the cavitating flow regime, it can be realized that there is a considerable increase in the velocity of the droplets in the y direction for the PVA MB suspen-sion droplets. The y component of the droplets in the case of PVA MBs could reach as high as approximately 40 m/s at an injection pressure of 760 kPa, while this value is nearly 30 m/s at an injec-tion pressure of 1035 for the case of water. It can be deduced that the presence of PVA MBs not only results in lowering the required injection pressure for the development of cavitation flow in the noz-zle, it also leads to a higher rate of atomization with larger velocities at lower pressure.
IV. CONCLUSIONS
In this study, a transparent quartz nozzle with an inner diam-eter of 0.9 mm was utilized to visualize cavitating flows of water inside the nozzle and investigate the effect of cavitation on spray atomization characteristics in terms of count, size, and velocity of the droplets. Another series of experiments were performed using a suspension of PVA MBs in a nozzle with modified surfaces to inten-sify cavitation and examine its influence on the spray. The obtained conclusions are as follows:
1. Cavitating flows inside the cylindrical nozzle can be classi-fied into the following regimes: (1) non-cavitation flow, (2) developed cavitation, (3) supercavitation, and (4) hydraulic flip. 2. In the case of water, the injection pressures corresponding to cavitation inception, supercavitation, and hydraulic flip are 690 kPa, 1035 kPa, and 1725 kPa, respectively. Using PVA MBs lowers the injection pressure for the same flow regimes by 100 kPa, 275 kPa, and 655 kPa, respectively.
3. At the microscale, there is not any noticeable difference in the cavitation numbers corresponding to cavitation inception and hydraulic flip flow condition.
4. Cavitating flow increases the spray cone angle considerably, while using PVA MBs does not have any significant effect on the spray cone angle. In the hydraulic flip regime, the spray cone angle drops and it could have a value even smaller than that corresponding to cavitation inception.
5. For both cases of water and PVA MB suspension, cavitation enhanced the droplet count. The number of counted droplets in the case of PVA MBs is higher compared to that in the case of water, which proves the important effect of PVA MBs and modified surface on enhancing atomization characteristics of sprays. Supercavitation increases the percentage of droplets with smaller diameter than 200 μm from 89.2% to 94.9% in the case of water. This percentage for supercavitaton flow is 95.2%, which is roughly the same as in the case of water. Cavitating flow lowers the overall SMD noticeably for both cases, and the overall SMD is smaller in the case of PVA MBs compared to that in the case of water.
6. Supercavitating flow has a significant influence on increasing the velocity of droplets. In the case of PVA MBs, in the super-cavitation regime, the y component of the velocity of droplets is larger compared to that in the case of water.
ACKNOWLEDGMENTS
This work was supported by TUBITAK (The Scientific and Technological Research Council of Turkey) Support Program for Scientific and Technological Research Project (Grant Nos. 118S040 and 217M869) and the Sabanci University Internal Project Grant (Grant No. I.A.CF-18-01877). Equipment utilization support from the Sabanci University Nanotechnology Research and Applications Center (SUNUM) is gratefully appreciated.
REFERENCES 1
W. Bergwerk, “Flow pattern in diesel nozzle spray holes,”Proc. Inst. Mech. Eng. 173, 655–660 (1959).
2C. Mishra and Y. Peles, “Cavitation in flow through a micro-orifice inside a silicon microchannel,”Phys. Fluids17, 013601 (2005).
3
C. P. Egerer, S. Hickel, S. J. Schmidt, and N. A. Adams, “Large-eddy simula-tion of turbulent cavitating flow in a micro channel,”Phys. Fluids26, 085102 (2014).
4
M. Jia, M. Xie, H. Liu, W.-H. Lam, and T. Wang, “Numerical simulation of cavi-tation in the conical-spray nozzle for diesel premixed charge compression ignition engines,”Fuel90, 2652–2661 (2011).
5
F. Payri, V. Bermúdez, R. Payri, and F. J. Salvador, “The influence of cavitation on the internal flow and the spray characteristics in diesel injection nozzles,”Fuel 83, 419–431 (2004).
6R. Payri, J. M. García, F. J. Salvador, and J. Gimeno, “Using spray momentum flux measurements to understand the influence of diesel nozzle geometry on spray characteristics,”Fuel84, 551–561 (2005).
7B. Abderrezzak and Y. Huang, “A contribution to the understanding of cavita-tion effects on droplet formacavita-tion through a quantitative observacavita-tion on breakup of liquid jet,”Int. J. Hydrogen Energy41, 15821–15828 (2016).
8F. Liu, Z. Li, Z. Wang, X. Dai, X. He, and C.-F. Lee, “Microscopic study on diesel spray under cavitating conditions by injecting fuel into water,”Appl. Energy230, 1172–1181 (2018).
9
J. Cui, H. Lai, K. Feng, and Y. Ma, “Quantitative analysis of the minor deviations in nozzle internal geometry effect on the cavitating flow,”Exp. Therm. Fluid Sci. 94, 89–98 (2018).
10
R. Payri, F. J. Salvador, J. Gimeno, and O. Venegas, “Study of cavitation phe-nomenon using different fuels in a transparent nozzle by hydraulic characteriza-tion and visualizacharacteriza-tion,”Exp. Therm. Fluid Sci.44, 235–244 (2013).
11
H. K. Suh and C. S. Lee, “Effect of cavitation in nozzle orifice on the diesel fuel atomization characteristics,”Int. J. Heat Fluid Flow29, 1001–1009 (2008).
12A. Sou, S. Hosokawa, and A. Tomiyama, “Effects of cavitation in a nozzle on liquid jet atomization,”Int. J. Heat Mass Transfer50, 3575–3582 (2007). 13
M. T. Shervani-Tabar, S. Parsa, and M. Ghorbani, “Numerical study on the effect of the cavitation phenomenon on the characteristics of fuel spray,”Math. Comput. Modell.56, 105–117 (2012).
14
M. Ghorbani, G. Alcan, A. K. Sadaghiani, A. Mohammadi, M. Unel, D. Gozuacik, and A. Ko¸sar, “Characterization and pressure drop correlation for sprays under the effect of micro scale cavitation,”Exp. Therm. Fluid Sci.91, 89–102 (2018).
15
R. Payri, F. J. Salvador, J. Gimeno, and L. D. Zapata, “Diesel nozzle geometry influence on spray liquid-phase fuel penetration in evaporative conditions,”Fuel 87, 1165–1176 (2008).
16
S. Som, A. I. Ramirez, S. K. Aggarwal, A. L. Kastengren, E. El-Hannouny, D. E. Longman, C. F. Powell, and P. K. Senecal, “Development and valida-tion of a primary breakup model for diesel engine applicavalida-tions,” Document No. 2009-01-0838, 2009.
17W. H. Nurick, “Orifice cavitation and its effect on spray mixing,”J. Fluids Eng. 98, 681–687 (1976).
18
F. Örley, T. Trummler, S. Hickel, M. S. Mihatsch, S. J. Schmidt, and N. A. Adams, “Large-eddy simulation of cavitating nozzle flow and primary jet break-up,”Phys. Fluids27, 086101 (2015).
19A. Sou, M. I. Maulana, S. Hosokawa, and A. Tomiyama, “Ligament formation induced by cavitation in a cylindrical nozzle,”J. Fluid Sci. Technol.3, 633–644 (2008).
20Z. He, W. Zhong, Q. Wang, Z. Jiang, and Z. Shao, “Effect of nozzle geometri-cal and dynamic factors on cavitating and turbulent flow in a diesel multi-hole injector nozzle,”Int. J. Therm. Sci.70, 132–143 (2013).
21Z. He, Z. Shao, Q. Wang, W. Zhong, and X. Tao, “Experimental study of cavi-tating flow inside vertical multi-hole nozzles with different length–diameter ratios using diesel and biodiesel,”Exp. Therm. Fluid Sci.60, 252–262 (2015).
22
J. M. Desantes, R. Payri, F. J. Salvador, and J. De la Morena, “Influence of cavitation phenomenon on primary break-up and spray behavior at stationary conditions,”Fuel89, 3033–3041 (2010).
23
P. G. Aleiferis, J. Serras-Pereira, A. Augoye, T. J. Davies, R. F. Cracknell, and D. Richardson, “Effect of fuel temperature on in-nozzle cavitation and spray for-mation of liquid hydrocarbons and alcohols from a real-size optical injector for direct-injection spark-ignition engines,”Int. J. Heat Mass Transfer53, 4588–4606 (2010).
24
J. Serras-Pereira, Z. Van Romunde, P. G. Aleiferis, D. Richardson, S. Wallace, and R. F. Cracknell, “Cavitation, primary break-up and flash boiling of gasoline, iso-octane and n-pentane with a real-size optical direct-injection nozzle,”Fuel89, 2592–2607 (2010).
25A. K. Agarwal, S. Som, P. C. Shukla, H. Goyal, and D. Longman, “In-nozzle flow and spray characteristics for mineral diesel, Karanja, and Jatropha biodiesels,” Appl. Energy156, 138–148 (2015).
26M. Ghorbani, H. Chen, L. G. Villanueva, D. Grishenkov, and A. Ko¸sar, “Inten-sifying cavitating flows in microfluidic devices with poly (vinyl alcohol) (PVA) microbubbles,”Phys. Fluids30, 102001 (2018).
27M. Ghorbani, A. S. Aghdam, M. T. Gevari, A. Ko¸sar, F. Ç. Cebeci, D. Grishenkov, and A. J. Svagan, “Facile hydrodynamic cavitation ON CHIP via cellulose nanofibers stabilized perfluorodroplets inside layer-by-layer assembled SLIPS surfaces,”Chem. Eng. J.382, 122809 (2020).
28
A. S. Aghdam, M. Ghorbani, G. Deprem, F. Ç. Cebeci, and A. Ko¸sar, “A new method for intense cavitation bubble generation on layer-by-layer assembled slips,”Sci. Rep.9, 11600 (2019).
29
R. Xue, Y. Ruan, X. Liu, F. Cao, and Y. Hou, “The influence of cavitation on the flow characteristics of liquid nitrogen through spray nozzles: A CFD study,” Cryogenics86, 42–56 (2017).
30
D. Li, S. Liu, Y. Wei, R. Liang, and Y. Tang, “Numerical investigation on tran-sient internal cavitating flow and spray characteristics in a single-hole diesel injec-tor nozzle: A 3D method for cavitation-induced primary break-up,”Fuel233, 778–795 (2018).
31F. Cavalieri, A. El Hamassi, E. Chiessi, G. Paradossi, R. Villa, and N. Zaffaroni, “Tethering functional ligands onto shell of ultrasound active polymeric microbubbles,”Biomacromolecules7, 604–611 (2006).
32A. Bhattacharya and P. Ray, “Studies on surface tension of poly (vinyl alcohol): Effect of concentration, temperature, and addition of chaotropic agents,”J. Appl. Polym. Sci.93, 122–130 (2004).
33Sigma-Aldrich, Poly(vinyl alcohol), version 6.2 safety data sheet, revised 18 January 2015.
34
M. Okazaki, K. Shioda, K. Masuda, and R. Toei, “Drying mechanism of coated film of polymer solution,”J. Chem. Eng. Jpn.7, 99–105 (1974).
35S. V. V. N. Kothapalli, V. Daeichin, F. Mastik, L. A. Brodin, B. Janerot-Sjoberg, G. Paradossi, N. de Jong, and D. Grishenkov, “Unique pumping-out fractur-ing mechanism of a polymer-shelled contrast agent: An acoustic characterization and optical visualization,”IEEE Trans. Ultrason., Ferroelectr., Freq. Control62, 451–462 (2015).
36D. Grishenkov, C. Pecorari, T. B. Brismar, and G. Paradossi, “Characteriza-tion of acoustic properties of PVA-shelled ultrasound contrast agents: Linear properties (part I),”Ultrasound Med. Biol.35, 1127–1138 (2009).
37F. Cavalieri, A. El Hamassi, E. Chiessi, and G. Paradossi, “Stable polymeric microballoons as multifunctional device for biomedical uses: Synthesis and char-acterization,”Langmuir21, 8758–8764 (2005).
38M. Ghorbani, G. Alcan, M. Unel, D. Gozuacik, S. Ekici, H. Uvet, A. Sabanovic, and A. Kosar, “Visualization of microscale cavitating flow regimes via parti-cle shadow sizing imaging and vision based estimation of the cone angle,”Exp. Therm. Fluid Sci.78, 322–333 (2016).