School of Sustainable Development of Society and Technology
Development of a screening assay for inhibitors of
inflammation useful against pancreatic cancer
Shima Ghafoory
Supervisor: Dr. Esther Guzmán,
Center for Marine Biomedical and Biotechnology Harbor Branch Oceanographic Institute
USA
Examiner: Dr. Sven Hamp, Mälardalen University
Sweden
DEGREE PROJECT, ECTS 30.0 FALL 2009
Keywords: Pancreatic Cancer; Chronic Inflammation; JAK/STAT Signaling Pathway;
ABSTRACT
Pancreatic cancer is the fourth most lethal cancer and ranks as the eighth most commonly diagnosed cancer worldwide. This is due to its rapid proliferation, strong metastatic potential and its delayed detection. One major risk factor for developing pancreatic cancer is the aggressive inflammatory disease chronic pancreatitis. Chronic inflammation frequently precedes the development of certain pancreatic cancers.
Inflammation is a protective and necessary process by which the body can alert the immune system of the existence of a wound or infection and mount an immune response to remove the harmful stimuli and start wound healing. The cross-talking of cells of the immune system and infected cells happens through cytokines, soluble
proteins that activate and recruit other immune cells to increase the system’s response to the pathogen. Failure to resolve the injury can result in persistent cytokine production that in turn allows a cell that is damaged or altered to survive when in normal conditions it would be killed. Inflammation is thought to create a microenvironment that facilitates the initiation and/or growth of pancreatic cancer cells.
Cytokines use two important kinases for their signaling: Janus Kinases (JAKs) and Signal Transducers and Activators of Transcription (STATs). The JAKs are activated upon the binding of cytokines to their corresponding receptors. When activated, the JAKs activate STATs through tyrosine phosphorylation. The STATs transduce signals to the nucleus of the cells to induce expression of critical genes essential in normal
physiological cellular events such as differentiation, proliferation, cell survival, apoptosis and angiogenesis. STAT3 (a member of the STAT family) is constitutively activated in some pancreatic cancers, promoting cell cycle progression, cellular transformations and preventing apoptosis. Therefore, STAT3 is a promising target for cancer treatment. Novel therapies that inhibit STAT3 activity in cancers are urgently needed. Natural products are a very good resource for the discovery of new drugs against pancreatic cancer.
Covering more than 70% of the Earths surface, The Ocean is an excellent source of bioactive natural products. Harbor Branch Oceanographic Institute’s Center for Marine Biomedical and Biotechnology Research (HBOI-CMBBR) situated in Florida, aims to find new marine natural products useful in disease prevention and drug therapy. Their current focus is to look for novel treatments for preventing both the formation of new pancreatic tumors and the metastasis of existing tumors.
The hypothesis of this degree project was that novel inhibitors of STAT3 useful in the treatment of pancreatitis and/or pancreatic cancer could be found from marine-natural products. The first specific aim of this degree project was to set up an assay to identify bioactive marine natural products as inhibitors of inflammation. Furthermore the assay was validated using a commercially available inhibitor of inflammation (Cucurbitacin I). The last aim was to further validate the assay by screening pure compounds and peak library material from the HBOI marine specimen collection.
At the end of the experimentation time, the assay still was not set-up as there were difficulties in proper cell culture techniques and the cell line did not respond as
advertised. While the results were not as expected, the work performed resulted in familiarization with research laboratory practices and increased laboratory skills.
TABLE OF CONTENTS
1. INTRODUCTION 1
1.1PANCREATIC CANCER 1
1.2MARINE NATURAL PRODUCTS AND DRUG DISCOVERY 1
1.3CHRONIC INFLAMMATION AND CANCER 2
1.4THE JAK/STATSIGNALING PATHWAY 2
1.4.1THE FUNCTION OF STAT3 3
1.4.2STAT3 IN CANCER DEVELOPMENT AND PANCREATIC CANCER 4
2. AIM AND HYPOTHESIS 5
3. MATERIALS AND METHODS 5
3.1CELL LINES 5
3.2MEDIA 5
3.3SUBCULTURE OF HELA/STAT3-LUC CELLS 6
3.4CELL COUNTING 6
3.5LUCIFERASE SCREENING ASSAY 7
3.6VIABILITY ASSAY WITH ETHIDIUM BROMIDE 7
4. RESULTS AND CONCLUSIONS 8
5. DISCUSSION AND FUTURE DIRECTIONS 16
6. ACKNOWLEDGEMENTS 18
7. REFERENCES 18
ATTACHMENT 1 20
ATTACHMENT 2 21
1. INTRODUCTION
1. 1 Pancreatic cancer
The pancreas is a gland organ, about 6 inches (∼15 centimeters) long, located on the right side of the abdomen (Fig. 1). The pancreas’s two main functions are to produce enzymes, which are useful for the digestion of food and to secrete hormones to maintain a proper level of sugar in the blood. [1]
Pancreatic cancer ranks as the eighth most commonly diagnosed cancer worldwide and represents the fourth most lethal cancer due to its rapid proliferation, strong metastatic potential and its delayed detection. Symptoms of the disease rarely emerge until it is nearly impossible to eradicate. [2, 3]
Pancreatic cancer has an overall five-year survival rate of only 1-4% after diagnosis. This type of cancer is highly resistant to all current chemotherapies and as attested by the low survival rate, current treatments remain only moderately effective. The discovery of new medicines and treatment strategies against pancreatic cancer are urgently needed.[2, 3, 4]
1. 2 Marine Natural Products and Drug Discovery
Natural products have long played an important role in treating and preventing many human diseases. A rich source of bioactive marine natural products can be found in The Ocean. The uniqueness, chemical diversity and complexity of the marine natural products, make them a very promising resource for the discovery of potential new drugs against cancers. [3]
Harbor Branch’s Oceanographic Institute’s Center for Marine Biomedical and Biotechnology Research (HBOI-CMBBR) situated in Florida, aims to find new marine natural products useful in disease prevention and drug therapy. HBOI-CMBBR has developed a unique screening library of secondary metabolites isolated from deep-water marine invertebrates. These marine-derived materials are tested to determine if they can kill cancer cells, stop cancer cells from dividing, or change the amount or activity of key molecules that confer cancer cells their malignant characteristics. This effort has resulted in identification of over 100 natural products with cancer fighting properties. Their current focus is to look for novel treatments for preventing both the formation of new pancreatic tumors and the metastasis of existing tumors, which are facilitated by chronic inflammation. [3]
Figure 1. The location of the pancreas [A]
1. 3 Chronic Inflammation and Cancer
Chronic inflammation frequently precedes the development of some cancers. Chronic inflammatory diseases have been associated with cancers such as lung, oesophageal, gastric, pancreatic, cervical, bladder, prostate and colorectal cancers [5].
In pancreatic cancer, chronic pancreatitis (chronic inflammation of the pancreas) is a very strong risk factor. Chronic pancreatitis is a very progressive and destructive inflammatory disease, which ends in the total destruction of the pancreas [4]. Suffering from hereditary pancreatitis results in a 53 times higher risk of developing pancreatic cancer than if unaffected, meanwhile a sporadic chronic pancreatitis gives a 17 times higher risk [3].
Inflammation is a protective process by which the body can alert the immune system of the existence of a wound or infection and mount an immune response to remove the harmful stimuli and start wound healing. In order to destroy the incoming pathogen a multifactorial network of cellular and molecular factors are unleashed against the invader. [6] This entire process is controlled by cytokines, which are secreted by many cells in the body and specific cells of the immune system e.g. macrophages, mast cells, etc. Cytokines exhibit pleiotropy (multiple biological actions) and control many functions in the body. Cytokines are soluble proteins that play a very important role in mediating an immune response by activating and recruiting further immune cells to increase the system's response to the pathogen. Cytokines can either be pro-inflammatory or anti-inflammatory. Interleukin-6 (IL-6) and Interleukin-10 (IL-10) are examples of a potent pro-inflammatory and an anti-inflammtory cytokine. It is the balance between these two different cytokines that determines the net effect of the inflammatory response. [6, 7, 8]
However sometimes inflammation fails to be reduced and results in many problems. The failure to resolve the injury by the cytokines can result in persistent cytokine production and in turn allow a cell that is damaged or altered to survive when in normal conditions it would be killed. The profile of cytokines persisting at an
inflammatory site is important in the development of chronic disease where the cytokines among other factors cause increased cell cycling and loss of tumor suppressor function. To summarize, inflammation is thought to create a microenvironment that facilitates the initiation and/or growth of some cancer types. [6, 8]
1. 4 The JAK/STAT Signaling Pathway
Cytokines signal through their specific receptors found at the surface of many cells that when bound to their ligand trigger the activation of tyrosine kinases called Janus Kinases (JAKs). In mammals, the JAK family comprises four different members: JAK1, JAK2, JAK3 and Tyk2. Upon JAK activation by the cytokines, the JAKs in turn tyrosine phosphorylate and therefore cause activation of the second members of this pathway called the Signal Transducers and Activators of Transcription (STATs). The STAT family consists of seven different members: STAT1, STAT2, STAT3, STAT4, STAT 5a, STAT 5b and STAT 6. STATs are latent transcription factors that reside in the cytoplasm until activated. Upon activation by the JAKs, STATs dimerize and translocate to the nucleus to induce expression of critical genes essential in normal physiological cellular events such as differentiation, proliferation, cell survival, apoptosis and
angiogenesis. The duration of STATs activation is a temporary process where they get exported back to the cytoplasm within hours as the activating signals decay. [7, 9]
Different JAKs activate different STATs depending which cytokine binding to the receptor. [9]
1. 4. 1 The Function of STAT3
One important member of the STAT family is STAT3. STAT3 is extremely important in several body systems and is essential for life [10].
Cytokines such as Interleukin 6,10,11 (IL 6,10,11), Oncostatin M (OSM), Tumor Necrosis Factor-Alpha (TNF- α), Leukemia Inhibitory Factor (LIF), Ciliary Neurotrophic Factor (CNTF) and Cardiotrophin-1 (CT-1) are all known to activate STAT3 [7]. Upon binding to the receptor JAK2 gets activated. In the nucleus STAT3 regulates the expression of genes that control embryonic growth, development, cell growth, cell migration and one of its most important functions, namely regulating the duration of inflammatory responses (Fig. 2). [10]
Table 1. Activated STATs in tumor types. STAT3 is the most commonly observed member [9].
1. 4. 2 STAT3 in Cancer Development and Pancreatic cancer
Several lines of evidence and studies have implicated some STAT family members in malignant transformation and tumor cell survival. STAT3 is the most commonly
observed member. In adulthood, STAT3 falls dormant and even though the JAK/STAT3 pathway is a tightly regulated process, STAT3 has been found constitutively activated in many human cancers, especially in certain pancreatic cancers. (Tab. 1). [7, 11]
The abnormal activation occurs due to deregulation of protein tyrosine kinases or constitutive release of cytokines [12]. STAT3 is considered as an oncogene, since it brings out the expression of genes such as cyclin D1, c-Myc, and bcl-xl which are involved in promoting cell cycle progression, cellular transformations and in preventing apoptosis [9]. By definition an oncogene is “a gene that, when mutated or expressed at high levels, helps turn a normal cell into a tumor cell” [13]. In pancreatic cancer aberrant STAT3 activation is required for growth and survival [11].
STAT3 becomes a promising cancer treatment target for therapeutic approaches to inhibit STAT3 activation.
2. AIM AND HYPOTHESIS
The hypothesis of this degree project is that novel inhibitors of STAT3 useful in the treatment of pancreatitis and/or pancreatic cancer can be found from marine natural products.
There are three specific aims of the project:
1. To set up a screening assay to identify bioactive marine natural products as inhibitors of inflammation.
2. To validate the assay using a commercially available inhibitor of inflammation (Cucurbitacin I).
3. To further validate the assay by screening pure compounds and peak library material from the HBOI marine specimen collection.
3. MATERIALS AND METHODS
3. 1 Cell lines
HeLa/STAT3-luc: Stable reporter cell line co-transfected with pSTAT3-luc and pHyg into cervical epithelial HeLa cells, followed by hygromycin selection. Selection of clones from the hygromycin-resistant cells was undertaken by using a functional Oncostatin M assay that induces luciferase activity. Cells were received as passage 3 from Panomics. (See Attachment 1)
A549/NFkB-luc: Stable reporter cell line co-transfected with pNFkB-luc and pHyg into caucasian human alveolar basal epithelial cells, followed by hygromycin selection. Selection of clones from the hygromycin-resistant cells was undertaken by using a functional TNF-α assay that induces luciferase activity. Cells were received as passage 3 from Panomic.
Human pancreatic cell lines such as ASPC-1 and Panc-1 were used in this project for the purpose of practicing proper cell culture techniques.
Only adherent cell lines were used in this project.
3. 2 Media
Dulbeccos’s Modified Eagles Medium (500ml, ATCC), containing 10% Fetal Bovine Serum (FBS), 100 units/ml Penicillin, 100 μg/ml Streptomycin and 100 μg/ml
3. 3 Subculture of HeLa/STAT3-luc cells
The degree of confluency on the cell culture was assessed using a phase contrast microscope. The cells were also viewed in the microscope to confirm that cells were healthy and that they had their typical epithelial morphology and shape. The absence of bacterial and fungal contaminants were confirmed this way. The cells were split when they had reached about 90% confluency.
Culture medium was removed from cells by aspiration. The cells were briefly rinsed with 2 ml phosphate buffered saline (PBS) (ATCC), and then removed by
aspiration. The PBS was added to remove serum proteins and to enhance trypsin activity. The cells were detached from the bottom of the flask by adding 2.5 ml trypsin and were then left to stand in a humidified incubator at 37 °C with 5 % CO2 for ~5 min.
Detachment was confirmed by observation with a microscope.
To inactivate the trypsin, 2.5 ml media was added to the culture flask and the cell suspension was gently pipetted up and down to break any clumps. 1 ml, corresponding ~106
cells, of the cell suspension was dispensed into a new T-75 flask followed by adding 14 ml pre-warmed complete growth medium to the flask (Fig. 3).
The culture flask was placed in a humidified incubator at 37 °C with 5 % CO2.
The cells were split every 2-3 days, when reaching 90% confluency.
Figure 3. The different steps in the subculture of adherent cells [C].
3. 4 Cell counting
Cells were counted by creating a 1:1 solution of cell suspension and 0.4% trypan blue (for viability, stains dead cells) for a total volume of 50 μl. The cells were counted using a hemocytometer (Bright-Line) using ~10 μl of the trypan-cell mixture. Dead and living cells were visualized using a microscope. The upper left and lower right regions in the hemocytometer were counted. Each region (square) counted has an area of 1mm2
and with a depth of 0.1mm, each square has a volume of 0.1mm3
(=10-4
ml). The
concentration of cells/ml and the viability of the cells were calculated using the formulas below:
Number of cells/ml = Average number of cells in one square x Dilution factor x 104
% Viable Cells = (Number of living cells / Total cell count) x 100
3. 5 Luciferase Screening Assay
Cells were plated in 100 μl media/well on a clear 96-well plate either at 1) 50,000 cells/well, 2) 25,000 cells/well, 3) a gradient starting with 6,250 cells/well and ending with 50,000 cells/well (with 2x increments). The plate was incubated overnight in a humidified incubator at 37 °C with 5% CO2. The cells were then treated with 100ng/ml
TNF-α in some wells and with 100ng/ml Oncostatin M (R&D systems and Sigma)in other wells. In some of the luciferase assays, Cucurbitacin I (Calbiotech, known inhibitor of the JAK/STAT3 pathway [10]) was also added to the added solutions. The plate was incubated for 6-8 hours at 37 °C with 5% CO2 to produce maximum induction
(Recommended dose and incubation times were obtained from Panomics, See Attachment 2). A commercially available protocol from Promega was obtained to perform a luciferase activity assay on the cells.
Medium was removed from the plate by aspiration and 50 μl lysis buffer
(Promega) was added to each well. The cells were incubated in lysis buffer for 4 minutes at room temperature with shaking. The cells were pipetted up and down 2-3 times to have them well mixed and to make sure they were lysed. 20 μl of each lysate were transferred to a new white 96-well plate for luciferase assay. 15 μl of each lysate were transferred to a new black 96-well plate for a viability assay (described in the next section).
To induce luciferase activity, 20 μl of luciferase substrate (Promega) was added into each well in the white plate and were then well mixed by pipetting up and down. The plate was immediately read using a luminometer (NOVOstar plate reader, BMG
Labtech). The cells treated with either TNF-α or Oncostatin M (STAT3 activators) were expected to produce light. The cells treated with the inhibitor Cucurbitacin I, were expected to show a decrease in light signal. All the added treatments were plated as duplicates, triplicates or more and the results for each treatment were graphed plotting the average values and standard deviations. Each assay was run once.
3. 6 Viability Assay with Ethidium Bromide
Each black 96-well plate containing 15 μl cell lysate in each well (mentioned earlier) was further used for a viability assay. 15 μl of 1.5 μM ethidium bromide was added to each well and was left to equilibrate for half an hour at room temperature with shaking, protected from light (wrapped in foil). The fluorescence was recorded at an excitation of 340nm and an emission at 590nm using the plate reader.
4. RESULTS AND CONCLUSIONS
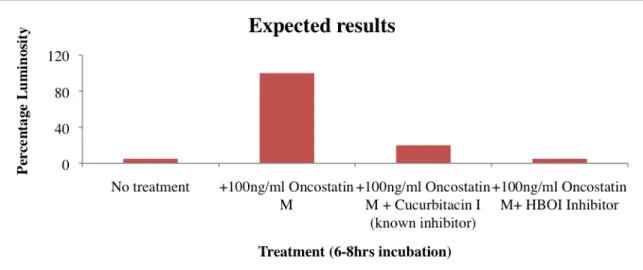
In order to set up the assay, a HeLa/STAT3-luc reporter cell line was obtained from Panomics. Optimal parameters for setting up the assay were obtained from Panomics (See Attachment 2). The HeLa/STAT3-luc cells are a cell line containing a luciferase reporter gene under the control of a STAT3 promoter. When the STAT3 promoter is activated it transcribes and translates the luciferase gene into a luciferase protein. By adding luciferase substrate light will be produced (See Attachment 3). Therefore activation of STAT3 via the treatment of a cytokine was expected to produce the most light. By additionally adding an inhibitor the light signal was expected to decrease significantly (Fig. 4).
Figure 4. The graph is showing the expected results from a luciferase assay using HeLa/STAT3-luc cells as an indicator of STAT3 inhibition. STAT3 activity is induced via the addition of a cytokine (e.g Oncostatin M or TNF-α) to all wells expect for media control (no treatment). Adding inhibitors will result in loss of luciferase activity resulting in significant decrease of light signal.
The expected results are based on earlier studies done by scientists at HBOI with NFkB-luc cells (stable reporter cell line, NFkB is another mediator of inflammation). As shown in Figure 5, cells treated with TNF-α induced signal because of NFkB activation. A set of HBOI compounds was tested on the cells for inhibition of NFkB activity. Compounds such as HB-27, 29, 45 and 90 showed very promising inhibitory properties.
Figure 5. Comparison of compound set 1treatments (5μg/ml) from the HBOI specimen collection using NFkB-luc cells as an indicator of NFkB inhibition. NFkB activity was induced via the addition of 100ng/ml TNF-α to all wells except for media control. 200μM Resveratrol (known inhibitor) was used as positive control. The graph was obtained from Mr. Michael Maher at HBOI.
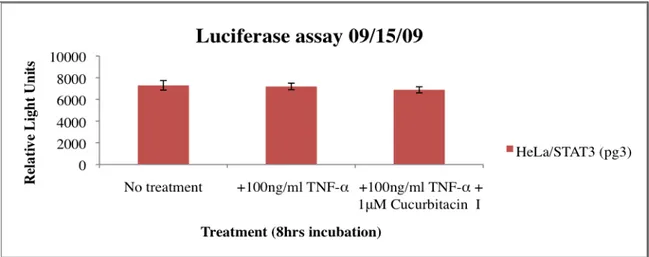
The first luciferase assay was set up with the HeLa/STAT3-luc cell line. As shown in Figure 6 there was no noticeable difference in signal between non-treated and treated cells. The TNF-α, which is a known inflammatory cytokine that activates STAT3, failed to induce signal in the cells. Because of the results obtained, no inhibition could be seen for the treatment with cucurbitacin I. The question arises whether the luciferase substrate got to the cells or not?
Figure 6. Luciferase assay using HeLa/STAT3-luc cells at a passage of 3 (pg3). All wells except the wells with media alone (no treatment) were treated with 100ng/ml TNF-α to induce STAT3 activity. In addition to some wells 1μM Cucurbitacin I (known inhibitor) was added to inhibit STAT3 activity. Cells were incubated for 8 hours. Light signal was measured with a plate reader.
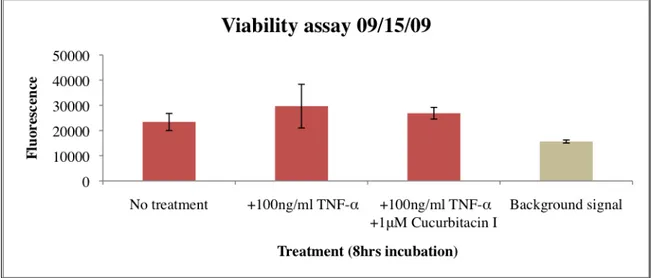
To determine whether luciferase substrate got to the cells or not, a viability assay was needed to be set up (Fig. 7).
Figure 7. Cell viability assay. The HeLa/STAT3-luc cells at a passage of 3, were incubated with 100ng/ml TNF-α in all wells except the wells with media alone (no treatment) for 8hrs. Some wells were also treated with 1μM Cucurbitacin I. Lysed cells were later treated with 1.5μM Ethidium Bromide for 30 minutes. Fluorescence was measured at an excitation of 340nm and an emission at 590nm with a plate reader. As shown in Figure 7 the background signal (empty wells) was lower than the signal from the wells with cells, which means that the cells were lysed since ethidium bromide could bind to the DNA of the cells. The luciferease was therefore able to bind to the substrate. In spite of this, no activation of STAT3 was induced (as shown earlier in Fig. 6). Although TNF-α is a known activator of STAT3, it seems like this is not the optimal cytokine to use in this assay since the vector used in the cell line might be
specific for Oncostatin M. Therefore 100ng/ml Oncostatin M was instead used from now on, since this was the recommended cytokine to use according to Panomics.
The viability assay was also used to monitor cell number in the wells. The fluorescence measured when ethidium bromide bind to the nucleus of the cells, gives information about the cell number distribution in each well in the plate. Greater fluorescence values indicate a greater number of cells. Fluorescence values do not represent the actual number of cells in each well.
Another conclusion drawn from the results of the viability assay in Figure 7 was that the cells in the wells were not plated evenly. Different fluorescent values from different wells indicate an uneven cell number distribution. To monitor the cell number much practice was done in counting cells.
Another viability assay was set up to confirm evenly plated cells in the wells. The viability assay turned out to be successful with an even cell number distribution (Fig. 8).
Figure 8. Cell viability assay. Cells at a passage of 7, were incubated for 8 hours with 100ng/ml TNF-α in some wells and with 100ng/ml Oncostatin M in others, except in the wells with media alone (no treatment). Some wells with Oncostatin M were also treated with 1μM Cucurbitacin I. Lysed cells were later treated with 1.5μM Ethidium Bromide for 30 minutes. Fluorescence was measured at an excitation of 340nm and an emission at 590nm with a plate reader.
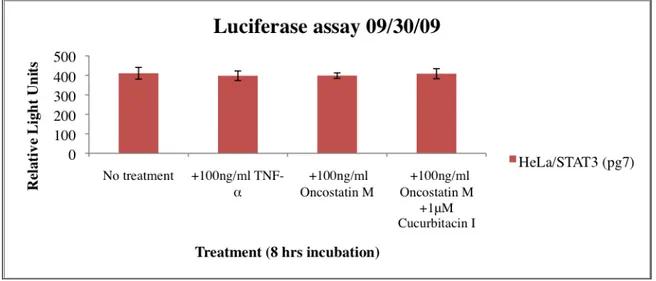
In the next luciferase assay, Oncostatin M was used as an activator of STAT3 parallel with TNF-α. No activation was obtained from either Oncostatin M or TNF-α (Fig. 9).
Figure 9. Luciferase assay using HeLa/STAT3-luc cells at a passage of 7. All wells except the wells with media alone (no treatment) were treated in some wells with 100ng/ml TNF-α and in others with 100ng/ml Oncostatin M, to induce STAT3 activity. Some wells with Oncostatin M were also treated with 1μM Cucurbitacin I (known inhibitor). Cells were incubated for 8 hours. Light signal was measured with a plate reader.
If the cells were too many in one well, they might have stressed each other out and not induced any signal. If they were too few they might have not induced enough signal. Plating different numbers of cells/well was the next step in troubleshooting the
luciferase assay. The cells were plated in a gradient to see if different cell number/well would affect the signal anyhow. As shown in Figure 10 still no signal was induced.
Figure 10. Luciferase assay using HeLa/STAT3-luc cells at a passage of 9. Cells were plated with different cell number/well. All wells except the wells with media alone (no treatment) were treated in some wells with 100ng/ml TNF-α and in others with 100ng/ml Oncostatin M, to induce STAT3 activity. Cells were incubated for 8 hours. Light signal was measured with a plate reader.
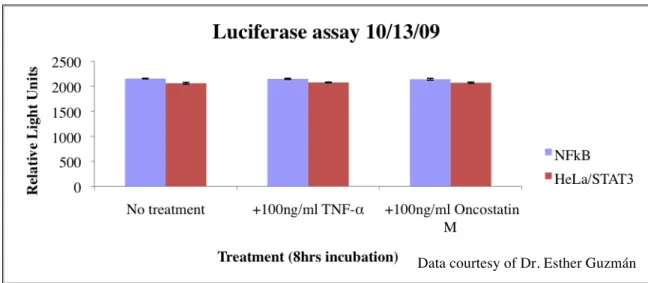
Consequently, there was doubt whether there was something wrong with the plate reader or maybe the reagents (luciferase substrate). To troubleshoot this, a NFkB-luc cell line, already known to work and induce signal (Fig. 5), was used in the assay parallel with HeLa/STAT3-luc cells (Fig. 11). No signal induction from the NFkB cells or the HeLa/STAT3 cells were detected by the plate reader. The plate reader was not working correctly.
Figure 11. Luciferase assay using HeLa/STAT3-luc and NFkB-luc cell lines. All wells except the wells with media alone (no treatment) were treated in some wells with 100ng/ml TNF-α and in others with 100ng/ml Oncostatin M, to induce STAT3 and NFkB activity. Cells were incubated for 8 hours. Light signal was measured with a plate reader.
Data courtesy of Dr. Esther Guzmán
The plate reader was replaced by a new one of the same type and another assay was set up. Since the HeLa/STAT3 cell line had been used for a while (pg12) there was a possibility that they had been stressed out and had kicked out their plasmid. Therefore a new healthy stock of HeLa/STAT3 cells (pg2) was used in the next assay parallel with the “old” ones. The NFkB cells were used once again.
As shown in Figure 12a the NFkB cell line induced light and it could therefore be concluded that the new plate reader was working and that there was nothing wrong with the reagents (luciferase substrate).
Figure 12a. Luciferase assay using old (pg12) and new (pg2) HeLa/STAT3-luc cells and a NFkB-luc cell line. All wells except the wells with media alone (no treatment) were treated in some wells with 100ng/ml TNF-α and in others with 100ng/ml Oncostatin M, to induce STAT3 and NFkB activity. Cells were incubated for 6 hours. Light signal was measured with a plate reader. The HeLa/STAT3 cells cannot be clearly seen in the graph. Please see Figure 14b for expansion.
By comparing the signal induced in the wells with new cells (pg2) with no
treatment and in those treated with Oncostatin A, a slight increase in signal could be seen (Fig. 12b). The signal produced was not high enough, as the expected induction was supposed to be 6-fold according to Panomics. The HeLa/STAT3 cells in passage 12 were not able to induce any signal. (Figure 12b is the same luciferase assay as the one in figure 12a, only now the focus is on the HeLa/STAT3 cells that couldn’t be seen before). New HeLa/STA3-luc cells were ordered from Panomics.
Figure 12b. Expansion of Figure 12a. Luciferase assay, using old (pg12) and new (pg2) HeLa/STAT3-luc cells. All wells except the wells with media alone (no treatment) were treated in some wells with 100ng/ml TNF-α and in others with 100ng/ml Oncostatin M, to induce STAT3 activity. Cells were incubated for 6 hours. Light signal was measured with a plate reader.
Another luciferase assay was set up but the cell number was changed from 50,000 cells/well to 25,000 cells/well using the new cells obtained from Panomics. The cells were induced in serum free media (recommended by Panomics). As a control the HBOI compound Lasonolide A was used. Lasonolide A is suspected to be a STAT3 activator. NFkB cells were again used as a control. Treating the cells with Lasonolide A did not affect the HeLa/STAT3 cells at all (Fig. 13). As before, Oncostatin M didn’t have any effect on the HeLa/STAT3 cells either. The NFkB cells induced good signal when treated with TNF-α. The Oncostatin M was suspected to not work.
Figure 13. Luciferase assay, using HeLa/STAT3-luc cell and NFkB-luc cells. All wells except the wells with media alone (no treatment) were treated in some wells with 100ng/ml TNF-α and in others with 100ng/ml Oncostatin M, to induce STAT3 and NFkB activity. Some wells were also treated with 5μg/ml Lasonolide A. Cells were incubated for 5 hours. Light signal was measured with a plate reader.
Data courtesy of Dr. Esther Guzmán
The previous assay was repeated with some changes. The cell lines were treated with different doses of Oncostatin M to see if this would affect the signal. This time the cells were treated with a much higher dose of Lasonolide A.
As shown in Figure 14, there was not any kind of induction or difference in induction on the cells treated with different doses of Oncostatin M. No activation of STAT3 with the higher dose of Lasonolide A was induced. One of the last things to troubleshoot was the Oncostatin M. New Oncostatin M was ordered from a different company (Sigma).
Figure 14. Luciferase assay, using HeLa/STAT3-luc cell and NFkB-luc cells. All wells except the wells with media alone (no treatment) were treated in some wells with 100ng/ml TNF-α and in others with different doses of Oncostatin M (100ng/ml-500ng/ml), to induce STAT3 and NFkB activity. Some wells were also treated with 20μM Lasonolide A. Cells were incubated for 7 hours. Light signal was measured with a plate reader.
The new Oncostatin M was received, substituted and used in the last assay. Different cell densities were plated ranging from 6,250 cells/well to 50,000 cells/well. Increased amount of luciferase substrate were added (100 μl instead of 20μl).
Once again no signal was induced from the cells (Fig. 15). Taking a closer look at the graph, one can see that there was a slight increase in signal in the wells plated with 12,500 cells/well and 25,000 cells/well compared to the non-treated cells. Once again this increase in signal was not high enough to be considered as a real induction.
Data courtesy of Dr. Esther Guzmán
Figure 15. Luciferase assay using a new HeLa/STAT3-luc cells at a passage of 8. Cells were plated with different cell numbers/well. All wells except the wells with media alone (no treatment) were treated with 100ng/ml Oncostatin M to induce STAT3 activity. Cells were incubated for 6 hours. Light signal was measured with a plate reader.
Aims 2 and 3 were not carried out due to the time it took to troubleshoot aim 1.
5. DISCUSSION AND FUTURE DIRECTIONS
The first aim of this project was to set up a screening assay to identify inhibitors of STAT3 activity. The assay was then going to be validated by using a known inhibitor (aim 2) and to be further validated by screening compounds from the HBOI compound library (aim 3). Due to difficulties encountered the first aim took more time than
expected. The efforts made for setting up a functional screening assay, therefore became the main focus of the project.
STAT3 activity was undertaken using HeLa/STAT3-luc cells. The luciferase reporter gene in the cells is supposed to provide a fast and an easy assay to detect STAT3 activity or identifying compounds that affect STAT3 expression. For this reason the HeLa/STAT3-luc cell line was chosen.
If the project had progressed as expected, the viability assays would have been used as a very important tool. If compounds had been screened they would have been expected to give a significant decrease in light signal (STAT3 inhibition).
Viability assays were run after each luciferase assay to determine cell number distribution in the 96 well plates. As described earlier in the materials and methods section, ethidium bromide was used in the viability assays as a powerful intercalating agent that binds to the DNA of the cells and fluoresces when exposed to UV light. An even cell number distribution in each well would have been necessary later when the compounds from HBOI would have been screened. The different compounds used in the screenings could have been very cytotoxic to the cells and caused cell death. This cell death would have been proven by the viability assay, showing a decrease in cell number in that certain well.
In the luciferase assay, dead cells would have resulted in decreased light signal since no luciferase activity would have been present. Since inhibition of STAT3 also results in decreased light signal, this could have resulted in misinterpretation of data. The viability assay would therefore have been an excellent way to eliminate any false positive results.
As an effort to inhibit STAT3 activity, cucurbitacin I was used in the first set of assays (Fig. 6-9). Cucurbitacin I is a commercially known inhibitor of the JAK/STAT3 pathway, which has been demonstrated to reduce the levels of phosphotyrosine of constituvely activated STAT3 in pancreatic cancer. The suppression caused by this compound results in blockade of STAT3 DNA-binding activity and STAT3 mediated gene transcription [10].
The concentration at which 50% inhibition occurs is called IC50. An IC50 of the cucurbitacin I was made by serial dilutions of the compound. Since the assay did not work in general, no useful results were obtained from the serial dilutions. If the assay would have worked out as expected the IC50 values of the cucurbitacin I, would later have been compared with IC50 values of the HBOI compounds.
At the beginning of the project, counting cells was an issue. As shown in Figure 7, the uneven numbers of cells were unacceptable (as discussed earlier). Therefore, more time had to be invested practicing proper counting of cells, using different pancreatic cancer cell lines (ASPC-1, Panc-1). This process lasted for about two whole weeks to really make sure that uneven cell numbers would not be an issue in the future. While this process took time away from the project, it guaranteed that cell numbers were not causing the problems with the assay. The relationship between cell number and fluorescence values is discussed under Figure 7.
Experiments with different cell passages were used to ensure that the reason for no signal wasn’t because of the conditions of the cells. According to the protocol from Panomics, “cells will undergo genotypic changes resulting in reduced responsiveness over time in normal cell culture conditions. Genetic instability is a biological
phenomenon that occurs in all stably transfected cells.” [14]
Many hours were spent in the lab to troubleshoot the assay. The troubleshooting became a big part of the project. The purpose of the troubleshooting was to step by step eliminate as many disturbing factors as possible.
At the beginning there were obviously some techniqual issues (plate reader, cell count) but after tackling that, still no functional assay was obtained. This cell line was expected to work as promised. But even though the assay didn’t work as expected, it is in itself a useful result, calling for further development efforts. The many challenges and problems have resulted in a deep knowledge and a valuable experience that would not have been gained if everything had worked out as expected.
Many difficulties faced in the beginning due to lack of lab experience, have now been overcome. Being able to judge degree of confluency, to judge if cells are healthy or stressed, to pipette accurately, to not cause cell stress, to count cells and to use aseptic laboratory techniques, are all some of the many things overcome that have resulted in a gained self confidence in working in a lab.
Future directions regarding this project would be to eventually get another STAT3 reporter cell line from another company. There is a possibility that the cell line from
Panomics had managed to kick out its plasmid with the reporter gene. One possible way to confirm this would be by setting up a polymerase chain reaction (PCR) assay.
Another option to get the project to work would be to find other ways to assay STAT3 activation. One suggestion would be to look more upstream in the JAK/STAT3 pathway, and study the JAKs and their tyrosine phosphorylation of the STATs in the cytoplasm using immunoblot techniques. By adding specific antibodies against phosphorylated STAT3, its activation could get confirmed.
6. ACKNOWLEDGEMENTS
First of all I would like to thank my supervisor throughout this project, Dr. Esther Guzmán, for giving me this great opportunity to work in her group. Thank you for the time you have invested in me, challenging me, stretching me and for making me a better scientist. I would like to thank everyone at BMR, especially Dr. Amy Wright and Dr. Peter McCarthy for helping and accepting me to work at HBOI. Thank you to Pat Linley and Tara Pitts for all their help in the lab, and Jennifer Grima and Kim Mulders for all the fun times we had together.
I would also like to give thanks to my professor Dr. Sven Hamp for being supportive and helpful throughout the project.
Last but not least I would like to thank my husband Martin Hjalmeby for always believing in me and supporting me.
7. REFERENCES
[1] Vertical Health, http://www.endocrineweb.com/endocrinology-overview/overview-pancreas, Viewed 20 December 2009.
[2] Toyonaga, T., Nakano, K., Nagano, M., Zhao, G., Yamaguchi, K., Kuroki, S., Eguchi, T., Chijiiwa, K., Tsuneyoshi, M., Tanaka, M., Blockade of Constitutively Activated Janus
Kinase/Signal Transducer and Activator of Transcription-3 Pathway inhibits Growth of Human Pancreatic Cancer, Cancer Letters, Volume 201, 2003, Pages 107-116.
[3] Innovations-Report,
http://www.innovations-report.de/html/berichte/biowissenschaften_chemie/researcher_oceans_bioactive_natural_ products_chemo_135575.html, Viewed 19 December 2009.
[4] Whitcomb, D., Inflammation and Cancer V. Chronic Inflammation and Pancreatic
Cancer, American Journal of Physiology, Volume 287, August 2004, Pages 315-319.
[5] Vakkila, J., Lotze, M., Inflammation and Necrosis promote Tumor Growth, Nature, Volume 4, August 2004, Pages 641-646.
[6] Coussens, L., Werb, Z., Inflammation and Cancer, Nature, Volume 420, December 2002, Pages 860-866.
[7] Hodge, D., Hurt, E., Farrar, W., The Role of IL-6 and STAT3 in Inflammation and
Cancer, European Journal of Cancer, 2005, Pages 1-11.
[8] Dranoff, Glenn., Cytokines in Cancer Pathogenesis and Cancer Therapy, Nature, Volume 4, January 2004, Pages 11-21.
[9] Calo, V., Migliavacca, M., Bazan, V., Macaluso, M., Buscemi, M., Gebbia, N., Russo, A., STAT Proteins: From Normal Control of Cellular Events to Tumorigenesis, Journal of Cellular Physiology, Volume 197, 2003, Pages 157-168.
[10] National Library of Medicine, 2008, http://ghr.nlm.nih.gov/gene=stat3, Viewed 27 December 2009.
[11] Blaskovich, M., Sun, J., Cantor, A., Turkson, J., Jove, R., Sebti, S., Discovery of
JSI-124 (Cucurbitacin I), a Selective Janus Kinase/ Signal Transducer and Activator of Transcription 3 Signaling Pathway Inhibitor with Potent Antitumor Activity against Human and Murine Cancer Cells in Mice, Cancer Research, Volume 63, March 2003,
Pages 1270-1279.
[12] Gamero, A., Young, H., Wiltrout, R, Inactivation of STAT3 in Tumor Cells:
Releasing a Brake on Immune Responses against Cancer?, Cancer Cell, February 2004,
Pages 111-112.
[13] Online biology textbooks,
http://users.rcn.com/jkimball.ma.ultranet/BiologyPages/O/Oncogenes.html , Viewed 28
December 2009.
[14] Panomics, Product insert,
http://www.panomics.com/downloads/RC0003_HeLa_STAT3-luc_2006_08_20.pdf PICTURES USED:
[A] Figure 1, WebMD Corporation, Picture of the pancreas available at
http://www.ghi.com/yourhealth/encyclopedia/articles/PancreaticCancer.jpg, Viewed 8
December 2009.
[B] Figure 2, Adapted from Sigma Aldrich, Picture of the STAT3 Signaling Pathway available at:
http://www.sigmaaldrich.com/life-science/cell-biology/learning-center/pathway-slides-and/stat3-signaling-pathway.html, Viewed 26 December 2009.
[C] Figure 3, R. Ian Freshney, 2000, Culture of Animal Cells. A Manual of Basic
ATTACHMENT 1
Figure A. HeLa/STAT3-luc cell line. Cervical cancer cell line with epithelial cell morphology. Commercially available from Panomics. Picture taken at a 10X magnification in a phase contrast microscope.
ATTACHMENT 2
Figure B. Dose Response of Oncostatin M using HeLa/STAT3-luc cells. Best activation of STAT3 occurs with 100ng/ml Oncostatin M. Data courtesy of Panomics.
(http://www.panomics.com/index.php?id=product_54)
Figure C. Time Course of Oncostatin M mediated induction using HeLa/STAT3-luc cells. Best activation of STAT3 occurs at 8hrs of incubation with 100ng/ml Oncostatin M. Data courtesy of Panomics.
ATTACHMENT 3
Figure D. The mechanism of the STAT3-luc reporter cell line. A luciferase gene is under the control of a STAT3 promoter. Upon STAT3 activation the luciferase gene is transcribed and later translated to a luciferase reporter protein (luciferin). When adding luciferase substrate a chemical reaction takes place and luminescence is produced. The luminescence is measured by a luminometer (plate reader). Picture drawn in Paint.
![Figure 1. The location of the pancreas [A]](https://thumb-eu.123doks.com/thumbv2/5dokorg/4726933.124942/4.918.161.380.500.643/figure-location-pancreas.webp)
![Figure 2. Diagram over the JAK/STAT3 pathway [B].](https://thumb-eu.123doks.com/thumbv2/5dokorg/4726933.124942/6.918.218.803.432.1016/figure-diagram-jak-stat-pathway-b.webp)
![Table 1. Activated STATs in tumor types. STAT3 is the most commonly observed member [9]](https://thumb-eu.123doks.com/thumbv2/5dokorg/4726933.124942/7.918.163.494.290.677/table-activated-stats-tumor-types-commonly-observed-member.webp)
![Figure 3. The different steps in the subculture of adherent cells [C].](https://thumb-eu.123doks.com/thumbv2/5dokorg/4726933.124942/9.918.165.692.509.832/figure-different-steps-subculture-adherent-cells-c.webp)