DISTRIBUTION GRID TARIFF DESIGN
Transition to a demand based distribution grid tariff design to manage
future trends of electric vehicles and peak demand
JOHAN HERBST
NICKLAS MEIJER
School of Business, Society and Engineering, Mälardalen University
Degree Project in Industrial Engineering and Management, FOA402
Examiner: Angelina Sundström Tutor: Peter Ekman
Company supervisor: Kenny Granath, Mälarenergi Elnät AB
Date: 2016-06-03 Johan.her@hotmail.com Nicklas.meijer@gmail.com
Abstract –
“
Distribution grid tariff design” Date: 3rd May 2016Level: Degree Project in Industrial Engineering and Management, 30 ECTS Institution: School of Business, Society and Engineering, Mälardalen University Authors: Johan Herbst Nicklas Meijer
27th March 1979 8th February 1987 Title: Distribution grid tariff design
Tutor: Peter Ekman, Mälardalen University
Keywords: Distribution tariff design, Demand tariffs, Electricity behaviour, Electric vehicles
Research
question: How should a generic tariff be designed and what factors should a DSO be aware of to manage an increasing penetration of EV and peak demand?
Purpose: The purpose of this study is to examine possible tariff designs for a Swedish DSO to better reflect the individual’s future use of the grid when it comes to the expected effects of EV.
Method: A qualitative research method with a combination of an experimental and comparative case study design was carried through. The literature review involved data gathering within the subjects of grid tariff design, pricing of natural monopolies and behaviour related to electricity use. Empirical data consisted of quantitative data from the grid in
combination with interviews of 5 respondents. With a systematic combining approach, the theoretical framework, empirical data and analysis evolved simultaneously. The results were analysed through emerging themes and evaluated with simulations.
Conclusions: The study has shown that a static and easy to understand tariff is preferable. A reflective way to price distribution of electricity does not imply a correct breakdown of allocating costs to direct causes of them. When designing the tariff, a DSO must be aware of the psychological barriers and consequences a tariff design can induce. By that we find the combination of a fixed, demand and ToU component should give incitements well enough to make customers mindful of how they use their electricity. During a transition to a new tariff design, a customer focus approach should be used, were transparency and simplicity are keywords. The future could imply a shift from static to dynamic tariffs designs in which enabling technologies will have to ease the
complexity for the customer in order to break down the psychological barriers.
Sammanfattning –
”Utformning av elnätstariffer för distributionsnätet” Datum: 3 juni, 2016Nivå: Examensarbete i industriell ekonomi, 30 ECTS Institution: Akademin för Ekonomi, Samhälle och Teknik, EST,
Mälardalens Högskola
Författare: Johan Herbst Nicklas Meijer 27:e mars 1979 8:e februari 1987
Titel: Utformning av elnätstariffer för distributionsnätet Handledare: Peter Ekman, Mälardalens Högskola
Nyckelord: Elnätstariff, effekttariff, elanvändningsbeteenden, elbilar,
Frågeställning: Hur ska en generell tariff vara utformad och vilka faktorer bör ett elnätsföretag vara medveten om för att hantera ett ökat
elbilsanvändande samt effektbehov?
Syfte: Syftet med denna studie är att undersöka hur ett elnätsföretag kan förändra sin tariff för att möta ett framtida elbilsanvändande och toppeffekt.
Metod: En kvalitativ forskningsmetod med en kombination av experimentell och komparativ fallstudie användes. Litteraturgenomgången består av ämnen inom elnätstariffer, prissättning på naturliga monopol och elanvändningsbeteenden. Empirisk data bestod av kvantitativa siffror från nätet i kombination med intervjuer av 5 respondenter. Med en ansats i systematic combining utvecklades den teoretiska
referensramen, empiriska data och analysen samtidigt. Resultaten analyserades genom uppkomna teman och utvärderades genom simuleringar av två fall.
Slutsatser: Studien har visat att en statisk och lättförståelig elnätstariff är att föredra. Ett kostnadsreflektivt sätt att designa elnätstariffen innebär inte en korrekt fördelning av orsakerna till kostnaderna. När ett elnätsföretag konstruerar en elnätstariff måste denne ta hänsyn till psykologiska barriärer och konsekvenserna en elnätstariff medför. Förutom det anser vi att en fast, effekt och tidsdifferentierad elnätstariff bör ge tillräckliga incitament för att göra kunderna medvetna om hur de använder sin el. I en förändringsprocess av elnätstariffen måste fokus vara på kunden och dess reaktioner där öppenhet och enkelhet är nyckelord. Framtidens tariffer kommer förmodligen vara dynamiska, där teknologier för automatiska styrning kommer att minska komplexiteten för kunden och övervinna de psykologiska barriärerna.
ACKNOWLEDGMENTS
First and foremost, we would like to express our appreciation to our tutor at Mälardalens University, Peter Ekman, for showing a great commitment and patience throughout this thesis. With your excellence in guidance, the orientation through this complex subject was possible even through the hard times.
Secondly, we would like to show gratitude to our supervisors at Mälarenergi Elnät AB, Kenny Granath and Johanna Rosenlind, for giving us the trust to perform this study at Mälarenergi. Especially Kenny, which had a crucial role making sure that we came in contact with the appropriate individuals and finding adequate information.
At last we would like to give thanks to our respondents, without which the results would not have been accessible.
TABLE OF CONTENTS
1 INTRODUCTION ...1
2 ACTORS AND TRENDS IN THE SWEDISH ELECTRICITY GRID ...5
2.1 Distribution System Operators ... 5
2.2 Trends concerning the electricity market ... 6
2.2.1 Electric vehicles ... 7
2.2.2 Smart metering ... 8
3 TARIFF PRICING AND DESIGN ... 11
3.1 Approaches to tariff design ...12
3.2 Cost allocation ...14
3.3 Pricing of natural monopolies ...15
3.4 Tariff designs ...16
3.4.1 Static tariff designs ...17
3.4.2 Dynamic tariff designs ...19
3.5 Impacts of tariff programs ...20
4 PSYCHOLOGICAL FACTORS TO ELECTRICITY CONSUMPTION ... 23
4.1 Putting numbers on barriers ...24
4.2 Voluntary selecting of a dynamic tariff ...25
5 LITERATURE SUMMARY ... 27
6 METHODOLOGY ... 29
6.1 Research approach ...29
6.2 Case study design ...30
6.3 Literature review ...30 6.4 Interviews ...31 6.4.1 Respondents ...32 6.4.2 Interview design ...33 6.5 Case simulation ...34 6.5.1 Simulation tool ...35
6.5.2 Data collection ...35
6.5.3 Mälarenergi Elnät AB’s grid ...36
6.5.4 Simulation parameters ...38
7 CURRENT PRACTICES ... 41
7.1 Results ...41
7.2 Analysis and discussion ...46
8 SIMULATION OF TWO TARIFF DESIGNS ... 55
8.1 Results ...55
8.2 Analysis and discussion ...58
9 CONCLUSIONS ... 61
9.1 Managerial implications ...62
9.2 Further Research ...63
APPENDIX
APPENDIX 1 – INTERVIEW GUIDE
APPENDIX 2 – DSOS WITH A DEMAND COMPONENT, DESIGN AND PRICE LEVELS APPENDIX 3 – LOAD CURVE PROFILS
LIST OF FIGURES
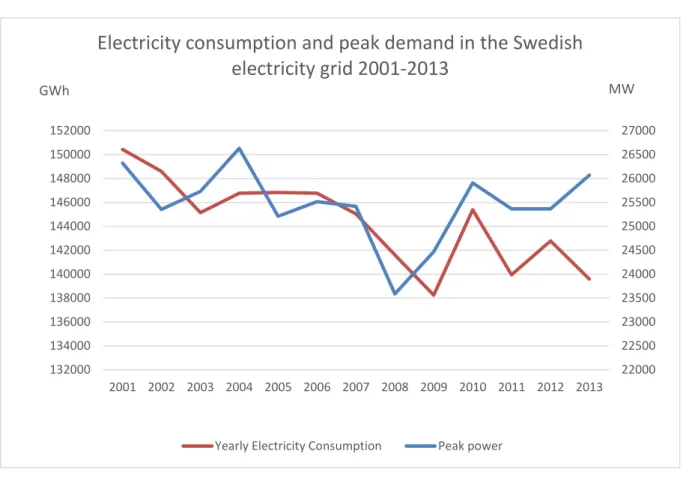
Figure 1: Electricity consumption and peak demand in the Swedish electricity grid 2001-2013. Made by the authors Source: Svenska Kraftnät and Swedish Energy Agency 2
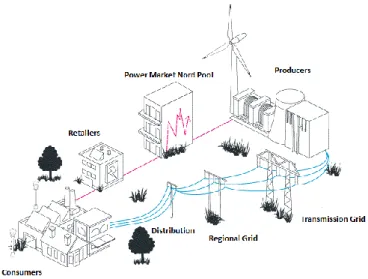
Figure 2: The electricity grid. Adjusted by the authors. Source: SVK ... 5
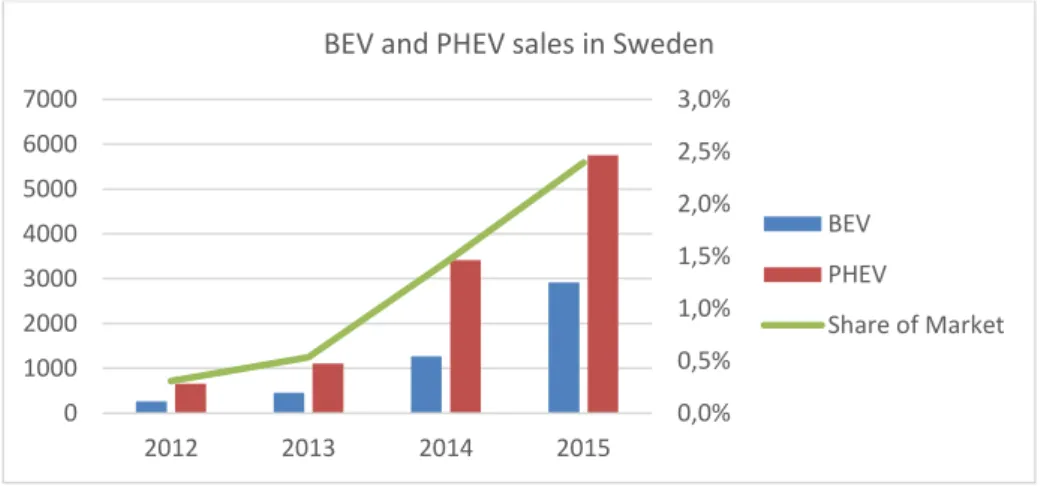
Figure 3: Sales of BEV and PHEV in Sweden, created by the authors. Source: SCB ... 6
Figure 4: Average EV load curve during a 24 hours’ period. Modified by the authors. Source: Grahn, et al. (2011, p. 73.) ... 8
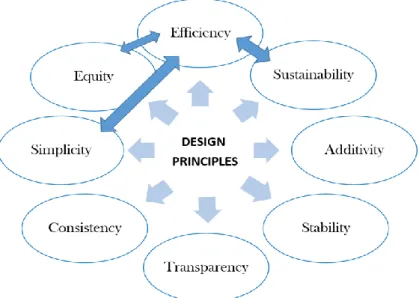
Figure 5: Tariff methodology, remade by the authors. Source: Ortega, et al. (2008, p. 1716) .12 Figure 6: Tariff design principles and contradictions, remade by the authors. Source: Reneses & Ortega (2014, p. 1647) ... 13
Figure 7: Relationship MC and AC in natural monopolies. Remade by Authors. Source: Similä, et al. (2011, p. 12) ... 15
Figure 8: Volumetric component. Energy reduction and load reduction (right) and with no load reduction (left), remade by the authors. Source: EURELECTRIC (2013, p 17) ... 17
Figure 9: Demand component. Peak shaving and thus energy reduction during that period. Remade by the authors. Source: EURELECTRIC (2013, p 17) ... 18
Figure 10: ToU component. Peak load reduction with small energy reduction. Remade by the authors. Source: EURELECTRIC (2013, p 17) ...19
Figure 11: Literature summary. ... 27
Figure 12: Thesis work process overview ... 29
Figure 13: Map over the selected areas for the cases ... 37
Figure 14: Why did the DSOs change the tariff design ...41
Figure 15: How the tariff design was changed ... 42
Figure 16: Results of the transition and new tariff design ... 44
Figure 17: Tariff future adaptions ... 45
Figure 18: Case 1. Change in distribution of the costs with 0, 13 and 73 % penetration of EV. ... 56
Figure 19: Case 1. The distribution of yearly revenue for a DSO. ... 56
Figure 20: Case 2. Change in distribution of the costs with 0, 13 and 73 % penetration of EV. ... 57
LIST OF TABLES
Table 1: Tariff approach principles. Adjusted by the authors. Source: Picciariello, et al. (2015,
p. 372) ... 13
Table 2: Cost allocation. Remade by the authors. Souce: Ek & Hallgren (2012a) ... 15
Table 3: Barriers and economics-inspired solutions. Remade by the authors. Source: Hobman et al. (2016, p 457-458). ... 23
Table 4: DSOs with a demand component in the tariff design, 16-25 A. Source: DSOs’ webpages ... 32
Table 5: Operationalization of interview. ... 33
Table 6: Customer tariff for 2015 Source: Mälarenergi Elnät AB ... 36
Table 7: Total revenue 2015 in selected areas ... 39
Table 8: Cost distribution in tariff components. Calculated by the authors. ... 39
Table 9: Case and scenario parameters ... 40
ABBREVIATIONS
Abbreviation Explanation
AC Average cost
BEV Battery electric vehicles CPP Critical peak pricing,
DER Distributed energy resources DSO Distribution system operator
EV Electric vehicles
kW/kWh Kilowatt and kilowatt hours
MC Marginal cost
PTR Peak time rebate
PHEV Plug-in hybrid electric vehicles
PV Photovoltaics
RTP Real time pricing
SEK Swedish krona
SEMI Swedish Energy Market Inspectorate
SM Smart meter
1
INTRODUCTION
With a starting point in the European Union’s energy policies to stimulate an increasing share of renewable energy production and a more energy efficient society, a larger transformation of the energy market has begun. The EU’s 20/20/20 goals and their long term visions have created prerequisites for a more intermittent energy production within the Union. This has also been the case for Sweden which has discussed an electrification and a fossil free vehicle fleet by 2030. (Prop. 2008/09:162)
With the introductory paragraph in mind, this will pose big challenges on the transmission and distribution networks ability to handle both the production and consumption patterns the transition bring. The question is how these challenges are supposed to be met. Smart grid is a buzzword used as a solution to the problem. (Bertling Tjernberg, 2015) Although there is no clear interpretation of what a smart grid is but commonly used concepts are control strategies leading to energy efficiency, active customers and to cut peak demand. In Sweden 2012, it was assigned a coordination council to oversee and propose actions towards smart grids. (Dir. 2012:48) There has also been an energy commission assigned to manage
seminars and workshops to discuss the future of the electricity networks ability to cope with and creating of a sustainable energy system (Dir 2015:25). It is clear that the electricity network that exist today is not adapted to the needs of tomorrow.
The structure of the electricity grid in Sweden is divided into three layers; long distance transmission with high voltages owned by Svenska Kraftnät (the Swedish transmission operator) and two levels of distribution. A regional level owned by a few network operators, and a local grid for which most of the customers are connected to. (Svenska Kraftnät, Oberoende Elhandlare, Svensk Energi, 2015) The market for electricity transmission and distribution is characterized by a natural monopoly as it would not be economically efficient for society to build parallel lines (Saplacan, 2008; Honkapuro, Tuunanen, Valtonen & Partanen, 2014). Therefore, a revenue framework assigned by the Swedish Energy Market Inspectorate (SEMI) and laws are central for operations. Distribution grid operators (DSOs) cannot charge more for the service they provide than what the regulatory authority decides and cannot charge the same type of customer by different methods. The charging method DSOs uses are by network tariffs and in 2014 the law of electricity was updated with an addition that the tariffs should contribute to an efficient use of the grid, electricity production and electricity consumption. (SFS1997:857)
The grid must be dimensioned for the peak demand on each level and not by the volume of energy consumption. Consumption of electricity is dependent on the season and at what time of the day it is. (Helbrink, Lindén, Nilsson & Andersson, 2015) Since the beginning of the 21th century the consumption has been declining and this is illustrated on the primary y-axis in figure 1. At the same time the peak demand of the system has almost been the same when comparing the years 2001 and 2013 which is illustrated on the secondary y-axis in figure 1.
Figure 1: Electricity consumption and peak demand in the Swedish electricity grid 2001-2013. Made by the authors Source: Svenska Kraftnät and Swedish Energy Agency
Electricity network tariffs has long been designed based on the volumetric consumption of electricity. As long as the energy transmitted through the grid has been similar to the actual peak demand this has been a fairly good model. But as have been shown in figure 1, peak demand and energy transmitted starts to diverge increasingly over the last couple of years. The most significantly share of the cost for a DSO is related to the capacities of distributing power in the grid (Koliou, et al., 2015). With a volumetric based tariff design, it will yield less revenue but the cost for high peak demand will remain and therefore challenge the business model for the DSOs (Sioshansi, 2015).
With the introduction of smart meters and the possibility of hourly measuring, the power output can be read off more precisely and used by the grid companies as a basis for choosing a type of tariff (Norstedt, Persson & Ny, 2015). With this opportunity, a time-of-use (ToU) component has become more interesting and several studies has focused on the possibilities and effects of ToU tariff designs (Koliou, et al., 2015; Bartusch, et al., 2011). They have shown that by using a ToU component in combination with a demand component has a direct impact on the load curve, shifting electricity use from peak to off-peak periods. It has also been shown that when using the meters as feedback system, acting as a reminder and motivator, a reduction in demand at peak hours can be reached (Carroll, Lyons & Denny, 2014). Although the latter can be discussed as there are other studies which has concluded the opposite and that education should be used instead of visualization (Lynham, Nitta & Tarui, 2016; Thuvander, Meiling, Andersson & Nilsson, 2012).
22000 22500 23000 23500 24000 24500 25000 25500 26000 26500 27000 132000 134000 136000 138000 140000 142000 144000 146000 148000 150000 152000 2001 2002 2003 2004 2005 2006 2007 2008 2009 2010 2011 2012 2013 MW GWh
Electricity consumption and peak demand in the Swedish
electricity grid 2001-2013
Unlike the combination with a demand and a ToU component in the tariff which is rather static, a more dynamical tariff design has been used in the United States since the beginning of the 21th century. It has been labelled Critical Peak Pricing (CPP) and operates when extremely high peaks on the network appears. Studies from the US has shown the effect of CPP to reduce peak demand for residential customers by 3-4 times more than normal ToU tariffs and even more in combination with control technologies. (Faruqui & Sergici, 2010) With the increasing amount of distributed energy resources (DER) like electrical vehicles (EV), solar panels and energy storage a customer’s dependency of the grid will decrease (Honkapuro, et al., 2014). Although that might be in terms of total energy, the need of power might not coincide with the possibility to use the DER technologies. Uncontrolled charging in combination with an increasing amount of EV can put strain on the grid, leading to a higher peak demand (Grahn, et al., 2013). Taking the above into consideration a volumetric based tariff design must change to another type of tariff design to better reflect the customer’s use of the grid.
Since the grid is under a natural monopoly condition, studies of how to prize the electricity distribution are focused on pricing models like Ramsey pricing, two-part tariff and cost causality. Furthermore, expressions like long and short run marginal costs are used in combination to find efficient cost allocation and pricing methods. (Ortega, Pérez-Arriaga, Abbad & González, 2008; Reneses & Ortega, 2014; Picciariello, Reneses, Frias & Söder, 2015) Based on these premises, there is a knowledge gap regarding how Swedish DSOs prepare for the future trends of electricity use, with an expanding number of electric vehicles, and how the tariff design can cope with those.
The purpose of this study is to examine possible tariff designs for a Swedish DSO to better reflect the individual’s future use of the grid when it comes to the expected effects of EV. This research is based on existing and customers’ future consumption behaviour, how different tariffs affects consumption and in that sense how they can be used to change a behaviour. Finding a tariff design which fits future trends could lead to a more effective use of the distribution grid.
Following the described challenges and research, this study address the research question:
How should a generic tariff be designed and what factors should a DSO be aware of to manage an increasing penetration of EV and peak demand?
Besides answering the research question, this study also address how and what DSOs need to consider when adopting a generic tariff to cope with EV and peak demand in the grid. I.e. this study also aspires to offer some managerial implications on the process of changing the tariff design to manage EV and peak demand.
2
ACTORS AND TRENDS IN THE SWEDISH ELECTRICITY
GRID
On the electricity market there are six different actors; electricity producers, consumers, retailers, power market (Nord Pool), distribution system operators (DSO) and a regulatory authority (TSO). The Swedish electricity market was deregulated in 1996, enabling a
consumer to buy electricity from a preferable retailer. Since the distribution is still under no such free choice, consumers are interacting with the market in two ways, through the retailers and the DSOs. The structure of the market can be simplified and seen in figure 2. (Svenska Kraftnät, Oberoende Elhandlare, Svensk Energi, 2015)
Figure 2: The electricity grid. Adjusted by the authors. Source: SVK
2.1
Distribution System Operators
There are about 170 grid companies in Sweden distributing electricity to its customers from the producers. As electricity cannot be packaged and delivered in an industrial scale, the consumption has to be measured at each customer and this responsibility is laid upon the grid companies. A grid company is also responsible for the management, maintenance and development of its grid. (Svenska Kraftnät, Oberoende Elhandlare, Svensk Energi, 2015) Because of the deregulation, a grid company (DSO) cannot engage in electricity production or electricity trading (SFS1997:857). The region for which a grid company is responsible is set by a geographical area (Svenska Kraftnät, Oberoende Elhandlare, Svensk Energi, 2015). To be able to build a grid, a concession is needed and if there already exists a concession within an area, another one will not be handed out (SFS1997:857).
SEMI is the market supervisor, determining a revenue framework and the purpose of it is that an electricity grid operator should conduct their business in an efficient way at low costs (ei.se, 2016a). In the ex-ante regulation, it is stated what incomes are reasonable, in other words, the costumer should pay a fair price for the service. The network tariffs should also be
unbiased, non-discriminatory and encourage an efficient use of the grid (SFS1997:857). An ex-ante regulation covers four years, e.g. 2016-2019, and the DSO has to lay forth a draft for their revenue framework nine months before the regulation period starts. Two months before the regulation period starts the SEMI decides the revenue framework for the DSOs. (ei.se, 2016a)
The size of the revenue framework is decided by the DSO’s costs that are reasonable to be covered. These costs are divided into capital costs, non-avoidable costs and controllable costs. The costs of capital in the form of example cables and transformation stations are considered to be capital costs. This cost is divided into depreciation and rate of return. The rate of return is set by the SEMI and is affected by how efficient the grid is used. Non-avoidable costs are considered to be grid losses, fees to the authorities, and subscription towards the overlaying grid (TSO). Customer specific cost such as measurements, reporting and calculations are considered to be controllable costs. Operation and maintenance costs are also considered to be controllable, and this category of costs has a cap set by SEMI which is based on historical data. (ei.se, 2016b)
2.2
Trends concerning the electricity market
The transport markets share of emissions in 2014 was 32 percent of the total emissions in Sweden (SCB, 2015). This can be compared with the EU15 countries whose share was 21 percent for the same market. An explanation for this disparity is the low share of fossil fuel in electricity and heat production in Sweden. To battle the problem with greenhouse gas
emissions on the transport market the government has set a goal of a vehicle fleet
independent of fossil fuels by 2030. Replacing or reducing the dependency of fossil fuels as a source of energy in the vehicle fleet can be done by battery electric vehicles (BEV) or plug-in hybrid electric vehicles (PHEV). (Prop. 2008/09:162, 2009) To encourage an increase in the share of electric vehicles the Swedish government introduced a financial subsidy in which buyers of new cars can subtract a considerable amount of the cars price (Prop. 2011:1590). The recent year’s number of new registered BEV and PHEV can be seen in figure 3 and their combined share of the total number of new registered cars in Sweden (SCB, 2016).
Figure 3: Sales of BEV and PHEV in Sweden, created by the authors. Source: SCB 0,0% 0,5% 1,0% 1,5% 2,0% 2,5% 3,0% 0 1000 2000 3000 4000 5000 6000 7000 2012 2013 2014 2015
BEV and PHEV sales in Sweden
BEV PHEV
2.2.1
Electric vehicles
Since the introduction of hybrid electric vehicles in the 1990s, such as Toyota Prius, the price has been gradually reduced. This is because of technological learning and increasing amount of vehicles produced. The higher costs of EV are based on the battery with a substantial increase for a corresponding car of the same model. The development of EV are hard to predict because of the large amounts of variables involved, and the forecasts usually have a large spread in number of vehicles sold and price interval. (Swedish Energy Agency, 2009; Weiss, et al., 2012) Depending on the life cycle cost and governmental incentives the share of electric vehicles could be between 11% and 73% of the total number of cars in Sweden by 2030 (Swedish Energy Agency, 2009; Trafikverket, 2012).
EV come in many different shapes, sizes and designs trying to satisfy all different kind of needs in transportation. In EV, the battery replaces or complement the fuel tank. BEV use only a battery as a source of energy and needs to be charged. Hybrid electric vehicles complement the fuel tank with batteries and are divided into two categories in which one where the battery can be charged (Plug in Hybrid Electric Vehicle, PHEV) and one where they cannot (Hybrid Electric Vehicle, HEV). For the sake of simplicity in this study in which only the chargeable cars (BEV and PHEV) are of interest they will now be called EV.
The number of different EV on the market opens up for a variety of specifications regarding battery size and consumption. The size of a battery is usually in the range of 10 to 35 kWh while consumption can be derived from a lot of different variables such as driving cycle or outdoor temperature, and are usually in the range of 0.12 to 0.25 kWh/km. (Fiori, Ahn & Rakha, 2016; Grid for Vehicles, 2010; Weiss, et al., 2012)
There is a wide range of possible ways to charge EV and as long as the car is parked it can be charged either at home, at work or on public parking. Studies have shown that the most preferred charging place is at home. The charging power in Sweden range from 2.3 kW using 230 V and 10 A at home, up to 90 kW using a public fast charger. Charging the car at home, the power would range from 2.3 kW to 13.9 kW. Mälarenergi Elnät AB (further described as Mälarenergi) sells a charger to house owners which can be set at anything between 2.3 to 13.9 kW. (Grid for Vehicles, 2011; Kütt, et al., 2014; Grahn, et al., 2013; Mälarenergi, 2016) There exists a large infrastructure for engine block heating in Sweden, for both houses and
apartments, which with a small adjustment could be used for slow mode charging since its using 230 V and 10-16 A (Swedish Energy Agency, 2009).
A wide range of studies have investigated EV charging and tried to predict a load curve. A common variable is uncontrollable charging dependent on user habits (Ashtari, Bibeau, Shahidinejad & Milinski, 2012; Grahn, et al., 2013; Clement-Nyns, Haesen & Driesen, 2010). Other models took in consideration if the vehicle was only charged after all the trips over the day was over (Darabi & Ferdowsi, 2011). Some studies investigated if the charging only took place at home (Grahn, et al., 2013). The batteries in PHEV are relative smaller than in BEV as they are usually considered to be only charged at home because they are assumed to only use a standard outlet (Grahn, et al., 2013; Clement-Nyns, et al., 2010). There is a general
consensus among studies that the uncontrollable charging of electric vehicles at home will lead to a considerable higher demand for electricity during the evening (Grahn, et al., 2013;
Darabi & Ferdowsi, 2011; Ashtari, et al., 2012; Deilamai, Masoum, Moses & Masoum, 2011; Clement-Nyns, et al., 2010). With a wide range of variables in mind, a typical average load curve for electric vehicles have the characteristics visualized in figure 4 (Grahn, Hellgren & Munkhammar, 2011).
Figure 4: Average EV load curve during a 24 hours’ period. Modified by the authors. Source: Grahn, et al. (2011, p. 73.)
2.2.2
Smart metering
A pre-requisite for most of the components in the tariff design (described in chapter 3.4) to be available as a solution is the existence of smart metering or at least hourly metering (Brown, Faruqui & Grausz, 2015; Irastorza, 2005). In Sweden this was introduced by law in 2012 and that those customers who wanted hourly readings should have the possibility to obtain these readings, i.e. the meters should at least be prepared to read hourly
(SFS1997:857).
In 2015, SEMI issued a report regarding the smart meters (SM) possibility to read on a shorter timeframe of 15 minutes. The report stated that the new meters shall be equipped with an open source and standardized interface that can give the customer real-time numbers on effect, voltage, meter indication and generation. The customer should also have the
opportunity to access these numbers. With the SM it should be possible to control relays which can turn on or off certain equipment with a high consumption, such as water heaters or freeze boxes. With the possibility for a more refined control system in the customer’s facility, which could be controlled remotely, a new type of tariff design that makes it easier for the customer to be demand flexible can emerge. (Norstedt, et al., 2015) This makes it more possible to find load spikes and help tariffs promoting load shifting or load cutting. As for a case with a laundry washer with 2.3 kW is in operation for 30 minutes. If hourly metering would be in place, the readings would be 1.15 kW as peak value of power. Corresponding reading would be 2.3 kW with the 15-minutes interval reading. In the case of a tariff design when 100 SEK/kW of maximum load would be in operation, it would lead to a billing difference of 115 SEK. 0 0,2 0,4 0,6 0,8 1 1 2 3 4 5 6 7 8 9 10 11 12 13 14 15 16 17 18 19 20 21 22 23 24 kW
Hour of the Dayl
But as well as the basic principles (chapter 3.1) the tariff design depends on, the issues regarding smart meters and privacy must be incorporated if one has to gain trust from the customer. A study conducted in the UK focused on the consumer acceptance of SM and discussed the privacy, threats and opportunities. They found out that to gain acceptance the need of SM must be discussed and explained in the long term, e.g. moving towards smart grid opportunities. With the possibilities to gain external control over customers´ consumption and by extension the bill the barrier of mistrust against SM could increase. There is a strong need for the companies to communicate with the customers. (Buchanan, Banks, Preston & Russo, 2016)
3
TARIFF PRICING AND DESIGN
A large part of a grid company’s costs are fixed, meaning to entry the market requires large investment costs. But when they are invested, the grid itself does not crave more investment until the grid is “full”. Then for the average cost during that period, it decreases as the output (power) increases and large economies of scales appear. Hence, for new companies to enter this kind of market will not be economic efficient. Therefore, the environment a grid
company operates within fits perfectly into the description of a natural monopoly. (Saplacan, 2008)
As of late, tariff design has been controversial and different governmental bodies and organizations releasing reports and holding seminars frequently. NordREG has held
seminars and released a report called “Tariffs in Nordic Countries – survey of load tariffs in DSO grids” (Nordic Energy Regulators, 2015). A thing of interest in that report was the listing of studies been carried out regarding grid tariffs had mainly not been done in academic journals. These studies had been commissioned by government and other research projects. Though, this is not unusual according to studies that government tends to let private
consultancy firms make reports as a basis for decisions (Corcoran & McLean, 1998). This is the case when the revenue framework is set for the DSOs, private consultancy firms calculate the WACC (weighted average cost of capital) which constitutes the rate of return on invested capital a DSO can get (Ernst & Young AB, 2015). In Sweden a commission has been put in place of which one main objective is the distribution and transmission of electricity (Dir 2015:25). In late 2015 both NordREG and Energikomissionen held seminars about future issues regarding distribution and pricing methods. Furthermore, Svensk Energi and Elinorr have un-published research projects examining the future design of tariffs.
A DSO get the large part of its income from the network tariff (further described as tariff). To further examine the phenomena of a tariff one must know what the term tariff actually means, in Sweden this is described in the electricity act of 1997. In the first chapter, 5 §, the tariff is described as “fees and other terms for distribution of electricity and for connection
to a cable or grid”. As described earlier, the tariff design should emphasize an efficient grid
but it is not regulated in detail letting the grid companies design it the way they prefer. Although this has been open for debate of lately as the SEMI presented a report in 2012 questioning if there is a need for more regulation of the tariffs. (Ek & Hallgren, 2012a) The future penetration of DER and specially EV, PV and electric storage will make a huge impact on future tariff design as they make the customers less reliable of the grid, but might have the same peak demand as before. The literature on this subject is not very extensive but either way, a DSO must take the impact of DER into consideration when designing a tariff. (Picciariello, et al., 2015) Technology as such might change the electric consumption completely in the future, making the electricity customers less reliable of the grid and therefore might challenge the DSO business model (Honkapuro, et al., 2014; Sioshansi, 2015). In other words, the literature on tariff designs does not include the DER impact of the grid, even more studies are needed to find an optimal solution (Picciariello, et al., 2015). Still the basic objectives of the tariff are to collect enough revenue to cover the allowed costs and
to send economic signals. If it is well designed it could lead to a more efficient use of the grid in the short as well as the long run. (Ortega, et al., 2008; Picciariello, et al., 2015)
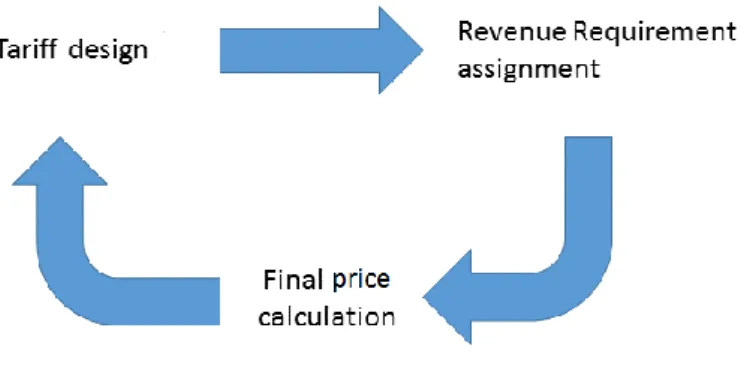
There are three steps in a general tariff methodology and they are illustrated in figure 5. Although they are done simultaneously, the starting point should be in the tariff design. But in the literature there is no clear way of how to price the distribution fee and most of the studies has been from abroad having other market designs. Though there are theories of how to price a naturally monopoly, those methods might contradict the approaches to tariff designs. Therefore, there is a need to first explain different approaches to tariff designs and how they might contradict each other. (Reneses & Ortega, 2014; Picciariello, et al., 2015; Ortega, et al., 2008)
Figure 5: Tariff methodology, remade by the authors. Source: Ortega, et al. (2008, p. 1716)
3.1
Approaches to tariff design
Apart from the two basic objectives of the tariff, there are some fundamental approaches a DSO must consider before designing a tariff and start allocate costs of distribution. In the literature they are well described in numerus of studies, both academically and by
governmental studies. (Ortega, et al., 2008; Picciariello, et al., 2015; Strbac & Mutale, 2005) According to a study (Picciariello, et al., 2015) they have to be revised because they have not been taken the DER into consideration and try to shed a light on the impacts of DER. The study made by Picciariello (2015) states that the lack of adapted tariffs for DG in combination with volumetric tariffs is a threat to not recover the costs of the DSO.
There are three groups of fundamental approaches presented in the literature. These are mostly drawn from political reasons, and are usually expressed in the laws and regulations. The three fundamental approaches are labelled; system sustainability, economic efficiency
and customer protection and are presented in table 1. (Picciariello, et al., 2015; Reneses &
Ortega, 2014) First group of principles takes into consideration the connection or access for all to the grid. Furthermore, it regards the cost drivers and makes sure that the grid
companies get revenue to fully cover their costs. As there is a regulation in place, there must be stability in the regulation as the adjustments in the revenue framework has an impact on
includes efficiency, both for the operation and in making sure those who value the service are charged accordingly. The last group of principles are targeting the customers. In this group simplicity, stability, transparency and gradualism has an influence on how to design a tariff. (Picciariello, et al., 2015) Another study also highlighted the concept of fairness. Even though there are no clear interpretation of the exact meaning of fairness it might be seen that the same customer category should be charged the same way (Brown, et al., 2015). As for the case of Sweden this is regulated by law.
Figure 6: Tariff design principles and contradictions, remade by the authors. Source: Reneses & Ortega (2014, p. 1647)
All of these does not function together and might in some cases even contradict each other as been illustrated in figure 6. Especially the cost-causality, which is a part of the efficiency principle, might be opposite to the simplicity and equity principle. For the governmental regulations as well as the DSOs’ tariff designs there is a need to prioritize to reach a trade-off between the listed principles. (Reneses & Ortega, 2014) As some customers become
prosumers, the need for new tariff designs are needed. Table 1 lists the approaches and a brief explanation of each (Picciariello, et al., 2015; EURELECTRIC, 2013; Sakhrani & Parsons, 2010).
Table 1: Tariff approach principles. Adjusted by the authors. Source: Picciariello, et al. (2015, p. 372)
System sustainability principles – functional
Universal access For those who want access to the grid/electricity Cost recovery Complete cost recovery for the DSOs
Additivity Tariff components needs to add up to total revenue
Economic efficiency principles – minimizing economic losses
Productive efficiency Provided at the lowest cost as possible
Allocative efficiency Charge according to perceived value of the customers Cost-causality Reflecting the customers’ use of the grid
Equity Same customer category – same charging scheme
Consumer protection principle – to assure consumers interests
Transparency The tariff design process shall be available for all Simplicity Easy to understand
3.2
Cost allocation
The shared nature of a grid as well as different behavioural electricity patterns results that the cost of one customer affects the cost for another (Sakhrani & Parsons, 2010; Picciariello, et al., 2015). This leads to a delicate problem, to whom should the costs be derived in terms of investment needed in the grid, losses etc. In the future with more DG and electrical vehicles, this will lead to even more challenges. (Picciariello, et al., 2015) The literature states that there is no universal methodology to derive these costs to different customers and by that it is a very complicated task (Reneses & Ortega, 2014). With this in mind, the rest of this chapter will more in detail describe how Swedish DSOs in general are allocating the costs to different tariff components.
First, after taking the principles in mind, the cost drivers must be identified and derived to different components in the tariff design. There are four main cost drivers for a DSO;
connection, capacity, energy and consumer. (Reneses & Ortega, 2014) But since the tariff
does not include the connection charges (which is regulated separately by SEMI) it will be excluded from further examination. The drivers are derived from four main cost components. (Ek & Hallgren, 2012a; Lydén, Sämfors & Fritz, 2011)
Costs for customer administration; metering and billing
Cost for capacity; installations, cables, operation and maintenance Cost for distribution losses
Cost for “overlying” grid; variable energy/load and fixed
All these are summing up to the costs the tariff should cover. Amongst these components, the cost distribution varies greatly. The cost for capacity is the largest post and is a fixed cost once it is invested. (Reneses & Ortega, 2014) It could be allocated by a capacity charge according to the actual use of the grid. In all, to find a correctness or reflective way of allocating cost the percentage distribution between the fixed and variable cost should
correspond to a percentage distribution between fixed and variable components in the tariff. If fixed costs are to be high, as the penetration of DER becomes higher the concept of fairness could be discussed. (Picciariello, et al., 2015) As the load in a grid normally is at its highest point during the winter and in the mornings and afternoons, a tariff design that allocate the costs to these times should be cost reflective (Lydén, et al., 2011).
Apart from above, the tariffs must be objective and according to the pre-works to the law, this means the cost is to be divided according to customer categorization in a cost reflective manner. There cannot be any subsidization between the customer groups. Although, they are eligible to differ between the groups but not within. As a consequence of that, the costs
derived from the geographical position of a customer cannot be accounted for. I.e. a customer within the same category must have the same tariff. (Ek & Hallgren, 2012a)
A way to allocate the associated costs to different tariff components for a DSO can be seen in table 2. Although this is not commonly done in Sweden as the DSOs usually transform the demand component into the volumetric or fixed component. The table describes how the revenue collected by the DSOs should equal the cost associated with them in respective tariff component. (Ek & Hallgren, 2012a; ei.se, 2015)
Table 2: Cost allocation. Remade by the authors. Souce: Ek & Hallgren (2012a)
Costs Tariff component
Grid losses, own grid (energy)
Grid losses, overlying grid (energy) Volumetric (SEK/kWh) Grid losses, overlying grid (load)
Fixed costs, overlying grid (load) Capacity costs
Demand (SEK/kW) Administration costs Fixed (SEK/year)
3.3
Pricing of natural monopolies
As described earlier in this chapter, the distribution market is a natural monopoly. And since the large amount of fixed capital investments there is a decreasing average cost function. In economic theory, under perfect competition a company produces until the price is equal to marginal cost (MC) and by that the social welfare is maximized. This is in economic terms often referred to the first best option. (Park, 1989) In the case of a natural monopoly this could lead to revenues not equalling the costs and thereby negative profits (Kopsakangas-Savolainen, 2002). This phenomenon can be seen in figure 7.
Figure 7: Relationship MC and AC in natural monopolies. Remade by Authors. Source: Similä, et al. (2011, p. 12)
Another problem with natural monopolies or in this case specifically distribution grid is the lumpiness of capacity. There is almost zero or a very low increase in MC, e.g. the cost of distributing one more unit of electricity as long there is no congestion in the grid. But in the long-term, when the system gets congested, the need to invest and install new capacity entails high costs and by that the terms lumpiness of capacity is described. (Park, 1989) Even using
Price Quantity Demand Pac Marginal Cost Average Cost Qac Qmc
the long run marginal cost (LRMC) cannot guarantee cost recovery because of the lumpiness of the grid development (Ortega, et al., 2008).
But since the natural monopolies are expected to at least break even, in the case of a DSO they are even expected to make a profit, there is a need for other pricing theories. Pricing methods are normally described and discussed in the literature as Ramsey pricing, two-part
pricing and cost causality method when it comes to natural monopolies. Ramsey pricing
implicates that setting a linear volumetric price and raise the MC by adding a price-mark over the LRMC in relation to the inverse price elasticity. The mark-ups should be applied to those who have the lowest price elasticities and a commonly used assumption is that those with low-income belongs to that group. Even though it is economic efficient, it might contradict the equity principle and be political impossible to implement. According to the literature, to improve the economic welfare a natural monopolist can introduce a two- or multi-part pricing scheme. That means moving from the linear Ramsey method to a non-linear pricing method. This is especially improving the welfare at capital intensive industries and in the case for a DSO it could mean having a fixed, volumetric and demand component. These theories have been long used in the industry as the theories dating from 19th century. The cost
causality method is due to interest because of the problems identified with classic economic
theories according to different MC-pricing. The idea is that it should reflect the customers’ use of the grid at every given time for each cost item. This yields an efficient allocation of the entire costs to all customer categories. This method does impose practical difficulties as there is a need to find a planning function for the grid. (Picciariello, et al., 2015; Brown, et al., 2015; Reneses & Ortega, 2014; Ek & Hallgren, 2012b) Apart from these, DSOs has usually used something called the accounting method of which the main objective is to retain all cost items in the accounts. This method is more of an ad hoc method, and has been the fundament for other methodologies such as the cost causality method. It can be described as what has the cost been before and then distributing them to different elements ad hoc. (Reneses & Ortega, 2014)
Normally to use these kind of theories, there is a need to know the cost function and price elasticities and that is as said before, a very complicated task (Reneses & Ortega, 2014; Picciariello, et al., 2015; Brown, et al., 2015).
3.4
Tariff designs
Electricity grids differ largely from a technical perspective thus there is a sense the tariff designs differ from each other as well. In Sweden the standard design of a tariff is made up by a fixed component which is to be paid periodically, and a volumetric component by
SEK/kWh. (Ek & Hallgren, 2012a) This means the users pay for the energy used, not the capacity or the power withdrawal from the grid. This might contradict the cost-causality principle as the power demand has a greater impact of the cost than energy consumption. (Honkapuro, et al., 2014) The fixed charge is usually divided into a customer categorization by the fuse size no matter of how much power they are using. A study in two electricity grids in Sweden has shown that the utilization factor of this type of categorization is very low
leading to high inefficiencies. (Helbrink, et al., 2015) The fuse size only determines the maximum power that the user can withdraw from the grid and not the actual amount. Although, in a finish study the fuse size categorization leads to the highest score in terms of impact on several parameters that needs to be taken into consideration (Honkapuro, et al., 2014). Some grid companies have put in place a demand component which take the
maximum power withdrawal as a billing ground expressed in SEK/kW.
The following two chapters describes tariff designs, components and their main purpose. They are divided into two categories; static and dynamic designs.
3.4.1
Static tariff designs
The components below are used in static designs, they are set in advance and both the customer and the DSO could calculate the amount billed or charged.
Fixed component
This is a fixed amount the customers pay a year and often broken down to monthly
payments. The size of the component varies greatly between different DSOs (Appendix 2). For some of the companies, the fixed component is the only component in the design (EURELECTRIC, 2013). The tariff is expressed as SEK/month or SEK/year.
Volumetric component
This is the most commonly used tariff in Sweden. The customers pay for the energy
consumption in the same sense they pay the electricity retailer. Most of the DSOs do not use any time variation, i.e. the customers pay the same price during the whole period. Some do and they are usually varying according to the peak hours of the day.
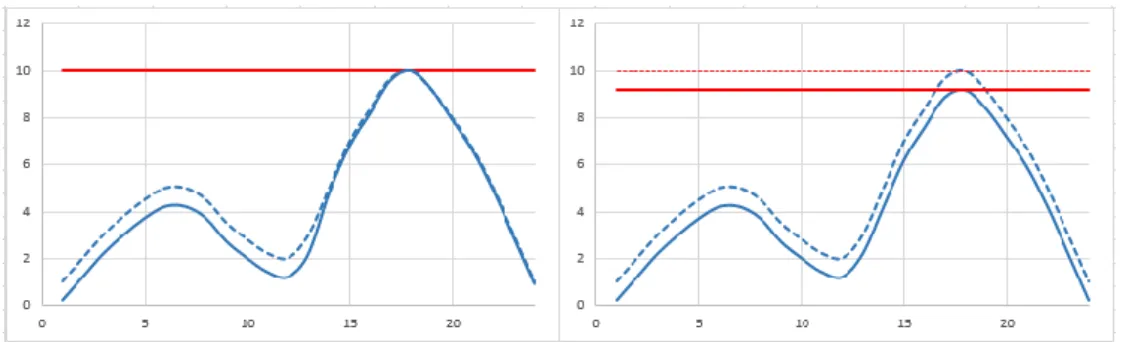
The main purpose of this component is to lower a customer’s energy consumption thus it will have a low effect on the costs for the DSO. The incentive to cut peaks are not strong enough even though it would be used in combination with a ToU component. This contradict some of the main principles described above like efficiency and cost-causality. (EURELECTRIC, 2013) The tariff is expressed as SEK/kWh or öre/kWh and presumed effect on the load curve is visualised in figure 8. The left load curve shows no load reduction but an energy
consumption reduction and the right a small load reduction as well.
Figure 8: Volumetric component. Energy reduction and load reduction (right) and with no load reduction (left), remade by the authors. Source: EURELECTRIC (2013, p 17)
Demand component
For customers of higher power needs, the demand component has been in operation for a long time. The component is based on maximum or average power withdrawal from the grid during a month or year. Readings of one to five power spikes constitutes the billing base. In Sweden the demand component is combined with both or one of the volumetric and the fixed component as described above.
The main purpose of this component is to cut or shift peaks as the customer pays an amount based on the peak power withdrawal. The level of SEK/kW will give the customer an
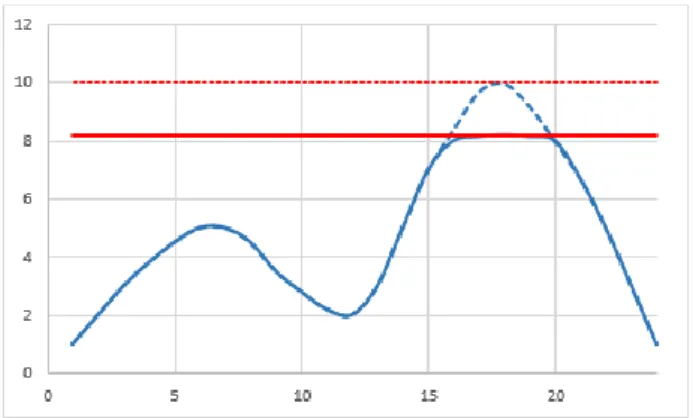
economic incentive based on the customer’s price elasticity. However, this component does not encourage a reduction in energy consumption and the reduction would probably be moderate. As the cost of a grid is dependent on the maximum power demand this yields cost reflectiveness and resource efficiency. Using it with a combination of peak and off peak price levels could lead to less losses as well. (EURELECTRIC, 2013) The component is expressed as SEK/kW and presumed effect on the load curve is visualised in figure 9.
Figure 9: Demand component. Peak shaving and thus energy reduction during that period. Remade by the authors. Source: EURELECTRIC (2013, p 17)
Time-of-Use component
This design makes a difference in time of the day or time of the year. It is usually described as off-peak or peak charges, charging the customers a larger amount on the volumetric or demand component during these hours or season of the year. In some sense this component can be seen as dynamic as the prices differ according to time, but at the same time the prices are determined in advance, labelling it at as a static component. (Faruqui & Sergici, 2011) A more dynamic form of this component is described in the dynamic part below labelled as CPP (EURELECTRIC, 2013).
The component is expressed in the same way as above components dependent of which used component in the design. E.g. if a demand component is in operation it could be 50 SEK/kW during peak and 25 SEK/kW during off-peak. It could also be used in combination with the volumetric component during peak hours. The time when ToU is set can differ between hours on days, months and parts of the year as well as the price level of these. For an example, in a report from Elinorr the thought of having different level on the demand component differs in respect by which month of the year (Rehnstedt, et al., 2014).
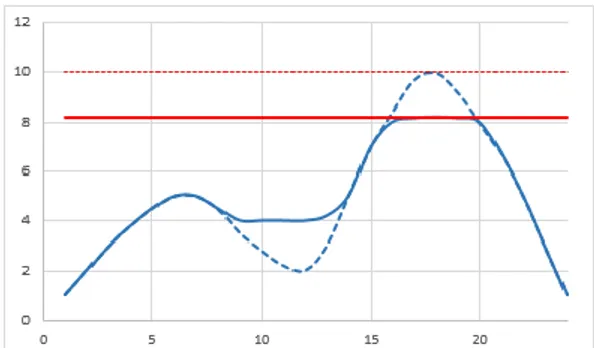
The main purpose of this type is to shift loads and possibly even a reduction in energy consumption and is visualised in figure 10. If used in combination with 2 or 3 components it might not answer to the simplicity principle. (EURELECTRIC, 2013; Ek & Hallgren, 2012a) Although, Svensk Energi does propose a three-part tariff design in an unpublished report, with a ToU on the volumetric component (Svensk Energi, u.d.).
Figure 10: ToU component. Peak load reduction with small energy reduction. Remade by the authors. Source: EURELECTRIC (2013, p 17)
3.4.2
Dynamic tariff designs
These tariff designs are labelled dynamic since the occurrence of operation cannot be planned or expressed in advance (at least not prior to one days’ notice). In Sweden, these type of tariff designs are not used although they are discussed in the regulators reports. (Ek & Hallgren, 2012a) Dynamic tariff designs are commonly used in the United States, but often in
wholesale markets. In Europe, various countries have dynamic rates both in operation as well as under demonstration. France have real-time pricing and critical peak pricing in operation and demonstration. (EURELECTRIC, 2013)
Dynamic tariffs are usually considered when discussing retail electricity pricing although they are applicable on distribution tariffs as well (Similä, Ruska & Hänninen, 2011). Generally dynamic rates are good for load shifting and especially larger customers. A short description of different dynamic designs follows.
Critical peak pricing
Critical peak pricing (CPP) is a way for the DSO to charge higher rates when there is a peak load in the distribution system. In contradiction to ToU tariffs the hours or times in
operation are not described in advance. The DSO are calling them at peak hours and the number of times the DSO is eligible to do this is determined beforehand, typically 50 to 100 hours a year. This can be used to reduce the costs for a DSO to the “overlaying grid”
companies. The price level then has to be so high that it really matters for the customers although they must have the option to override the system and use the amount of power they wish. This makes it difficult for a DSO to predict how the customers will react to the price signals and makes the revenue stream more uncertain. In France this is in operation in combination with volumetric designs of the tariff. (Similä, et al., 2011; Ek & Hallgren, 2012b) As the prices during peak hours is very high, the prices during all other hours are discounted (Wood & Faruqui, 2010).
Real-time pricing
Real-time pricing (RTP) is a tariff that varies by the hour. The price level might follow the electricity price, i.e. when the price of electricity is high the tariff gets higher. But that is not a definitely truth, as the price of the tariff is set only on the basis of the load magnitude or capacity constraints. Of the dynamic tariffs, this is as dynamic as it gets. (Similä, et al., 2011)
Peak time rebate
In some sense, peak time rebate (PTR) is equal to CPP. Instead of paying high prices during peak hours, customers get a rebate by reducing their usage during the peak hours. If a customer chooses not to lower its usage from the grid, the tariff stays the same. (Wood & Faruqui, 2010)
3.5
Impacts of tariff programs
A large variance in the impact on electricity consumption can be seen after the
implementation of a ToU and/or dynamic tariff design. Each market area and pricing is unique and hence the results differ from modest to substantial. The magnitude of the decrease in peak demand depend on a lot of variables such as enabling technologies, price difference, type of cooling or heating system, and geographical location. A survey of studies in the USA showed a trend of increased reduction with a dynamic model and enabling
technologies. The study showed that by using tech-devices both the ToU component and dynamic tariffs becomes more powerful in their impact on reduction on the peak demand. The survey covered experiments, pilots and real implementations on wholesale markets and none used a demand component in their tariff design. (Faruqui & Sergici, 2010) Though, enabling technologies are far from common today. A recent study partly conducted by the authors’ shows that for the industry to expand there is a need of collaboration between among other DSOs and companies for enabling technologies. (Andersson, et al., 2016) Dynamic models have shown to reduce peak demand more than static models. The mean reduction in peak demand with a CPP price model on a wholesale market is 17 percent. With a static design, there is still a reduction by the mean of four percentages. (Faruqui & Sergici, 2010) With an increase in the peak to off-peak price ratio the peak reduction gets larger, following the square root curve, which is one of the reasons behind the large variations in peak demand shaving (Faruqui, Sergici & Akaba, 2013). Enabling technologies increases the peak demand reduction substantially in both the static and dynamic price models and mean reduction was 26 and 36 percent respectively (Faruqui & Sergici, 2010).
The Swedish DSO, Sala-Heby, have experienced a decrease of 9.5% in mean maximum
demand in two years after implementation using a static design (Bartusch, et al., 2011). There is also evidence for long term effects with a demand based tariff design. Evaluating six years of data it can be seen that the relative decrease in the mean demand is consistent through the hours of a day except in the beginning of the off-peak hours in the evening when there is a sudden increase. Not only had the outdoor temperature differences between the years but
also behavioural changes gave a contribution to the shift in peak demand. (Bartusch & Alvehag, 2014) Measures taken to reduce peak demand was to run household appliance after peak time, such the dishwasher and the washing machine. The reduction of electricity usage during the summer indicates that the tariff had positive impacts on electricity usage and energy efficiency. (Bartusch & Alvehag, 2014; Bartusch, et al., 2011)
An Italian study shows that when introducing a volumetric ToU tariff design, there is a shift in demand from peak to off-peak in the morning hours and to some extent in the evening. The overall electricity usage increased during the study by 13% even though the maximum temperature difference was set to 4 °C. (Torriti, 2012) Comparing two areas in Sweden, one with a volumetric based tariff design and one with a demand and ToU based tariff design, and similar preconditions, it could be found that the difference in peak demand was between 1.2 and 2.3 %. The difference occurred between the morning and evening peak hours and solely in single-family houses. (Bartusch, Juslin, Persson-Fischier & Stenberg, 2014) Condominium and rental apartments had little to none reduction in peak demand under a demand based ToU tariff design in both Sala-Heby and Sollentuna areas, while single-family houses contributed to the demand response (Bartusch, et al., 2011; Bartusch & Alvehag, 2014; Bartusch, et al., 2014). Reviewing the customers’ knowledge about electricity and energy, a lot of customers in the Sala-Heby study did not understand the difference between watt and watthours which might contribute to a reluctance to accept change (Bartusch, et al., 2011). In the study involving the comparison between two areas, Saltsjö-Boo and Sollentuna, in Sweden it could be seen that only one third of the population knew they had a demand based tariff design with a ToU component (Bartusch, et al., 2014). Respondents to a questionnaire in both Sala-Heby and Sollentuna answered that they would decrease their electricity use not only because of economic incentives but also because of the environment (Bartusch, et al., 2011; Bartusch, et al., 2014).
4
PSYCHOLOGICAL FACTORS TO ELECTRICITY
CONSUMPTION
Lots of people report that they understand the importance of saving energy because they are concerned about the climate change. This concern does not however translate into action by reducing household’s electricity consumption. (Frederiks, Stenner & Hobman, 2015) In traditional economic theories there is a consensus that behaviour and decision-making are based on rational choices. There is a common assumption that greater information,
knowledge, and awareness will induce behaviour change. This assumption is however inconsistent with fundamental and well-known principles of human decision-making and behaviours. In a world full of information and were people are overwhelmed with choices, they come to rely on shortcuts in decision making. Saving time and energy even if it is economically sub-optimal for the individual is something that people do when they are faced with a complex choice. (Hobman, Frederiks, Stenner & Meikle, 2016) Human behaviour related to electricity use is therefore influenced by irrational tendencies and cognitive biases (Frederiks, et al., 2015). When people choose satisfice rather than optimize, the choice is considered to be irrational, which is the case for electricity consumption. Irrational choices considering electricity use can through behavioural economics and psychology to some extent be predictable. (Frederiks, et al., 2015; Hobman, et al., 2016)
Table 3: Barriers and economics-inspired solutions. Remade by the authors. Source: Hobman et al. (2016, p 457-458).
Barrier Description Solutions
Aversion to complexity Simpler decision rules, make worse
decisions Ensure simplicity, not too many choices Trust Trust as a decision-making rule, to
speed up information processes Information from trustworthy sources Status quo bias Resist change, not acting or
avoiding decisions Capitalize on salient lifecycles e.g. moving homes Loss aversion Focus on the losses instead of
potential gain Emphasize cost/losses when sticking to status quo, tariffs with a high reduction in off-peak
Risk aversion Certainty over risk Provide incentives instead of penalty charges
Time and spatial issues Short-sighted; prefer an
immediate smaller reward Immediate feedback, provide hints and tips, automated technologies, emphasize non-monetary benefits Normative and social influences Following the behaviour of others Examples of other customers that
have adopted a desirable behaviour, present types which benefits
Perceived fairness Averse to inequalities, seeking
fairness Provide hard evidence, ensure vulnerable customers are not unfairly disadvantaged
Some of the most influential pervasive biases to affect consumers’ electricity usage patterns are status-quo, loss and risk aversion, sunk-cost effects, temporal and spatial discounting, and availability bias (Frederiks, et al., 2015). Hobman et al (2016) suggest that the
behavioural aspects are critically important when designing and introducing new tariffs, and these can be seen in table 3 on the previous page. The behavioural aspects could also explain why consumer uptake and usage of cost-reflective pricing often falls short of expectations. There exists a large gap between material interests and peoples’ values, and their behaviour. People dislike losses more than they like gains, take mental shortcuts to cut through
complexity, evaluate things in relative instead of absolute terms and are influenced by the people that surrounds them. (Frederiks, et al., 2015)
4.1
Putting numbers on barriers
With new technology it is possible in a smart grid environment to remotely control the electricity consumption of households. In a study of the preferences in Swedish households, they were faced with three different hypothetical contracts. Two of the contracts involved the control of heating or domestic electricity, (dishwasher, laundry machine, dryer, towel
warmers and comfort floor heating), use on weekdays between 7 to 10 or 17 to 20. The third option involved a shutdown of both, between 7 and 20, in extreme cases with a notification one day ahead. The options in the extreme case was 3, 7 or 10 days per year. In all contracts it was also possible to choose an option to not be controlled, also called status-quo. The results of the study reveal that people require several hundreds of SEK in compensation for external control. Compensation for heating in the morning is not significant and could be explained by the reason that people go to work in the morning and hence are not affected by the
temperature fluctuations. The indoor temperature should reach its lowest level at 10 am at which time most people are at work. Evening compensation for heating is in the size of 643 SEK and could be derived to that people are home from work and the discomfort of having temperature variations. Respondents put a significant higher value on external control of domestic electricity which corresponds to 833 SEK and 1409 SEK for morning and evening hours respectively. It can be seen that respondents put more value on being controlled during evening hours. In the case for extreme occasions respondents required 44 SEK per day of control. The status-quo alternative showed to be significant and that people wanted 2788 SEK to even considered another alternative. This might be because people think the compensation is too small or the discomfort of external control is too large. When
investigating the socioeconomic factors involved in the choosing of the status-quo contract it can be seen that people living in apartments, age and household positively correlates. Higher education, and involvement in environmental and political organizations does however make the respondent less likely to choose the status-quo contract. The study identified that the possibility of someone being home in the evening hours are significantly higher and hence the discomfort of external control during the evening hours are expected to be higher. (Broberg & Persson, 2016)
4.2
Voluntary selecting of a dynamic tariff
Electricity consumers are open to dynamic pricing but prefer simple tariffs instead of complex and highly dynamic ones (Dütschke & Paetz, 2013). The consumption pattern does not play a role in the selection of a dynamic tariff such as CPP, but rather the ability for demand response is the deciding factor and hence a voluntary approach is preferred (Ericson, 2011; Barbara, 2010). Consumers who enters a ToU program voluntary or mandatory alters their electricity pattern in the same way. The difference between the two groups was the perceived usage patterns of domestic electricity appliances and ability to respond to the tariff rate. Those who volunteered thought that they used less electricity during peak hours than non-volunteers. (Baladi, Herrigas & Sweeney, 1998) Fearing that dynamic tariffs attract consumers who benefit from the program without adjusting their consumption significantly more than other consumers are common but unnecessary as they are a minority (Ericson, 2011).
Consumers are more interested in the price level (low, medium or high) rather than a specific number when trying to understand tariffs. They also prefer a fixed timetable, ToU, with a low price spread. In experiments using a load limit, participants refused to stay under it because they thought it constrained their life too much. (Dütschke & Paetz, 2013) When introducing a dynamic tariff, it should be transparent and predictable with little dynamics. More complex programs should be combined with supporting technologies and services such as displays, smart household appliances and demand automation to improve convenience. (Dütschke & Paetz, 2013; Ericson, 2011) Customers’ expectations in saving money from dynamic tariffs are higher than realized and therefor needs to be accompanied by information campaigns (Barbara, 2010; Dütschke & Paetz, 2013).
5
LITERATURE SUMMARY
Figure 11 illustrates a brief summary of the factors affecting the tariff design.
Figure 11: Literature summary.
DSO, EV and SM. The DSOs need to address future questions by a declining energy use but
with a constant or increasing peak demand. Introducing EV and an uncontrollable charging leads to higher peak demand during the hours of 17-19. With the introduction of smart meters, the demand could be measured more precisely and priced accordingly but also create a feeling of mistrust if used in the wrong way.
Tariff approaches, pricing/cost allocation and design. Approaches to the tariff design is the
first step for a DSO when designing their tariffs. In some ways they contradict each other and a DSO must therefore prioritize between them. A customer focused approach can contradict a cost reflective approach. Though, by taking a customer protective approach could lead to cost reflectiveness if the design gives the right incentives. Allocating cost according to tariff components which corresponds to the caused cost driver is a way to approach the tariff design by a cost reflective way. Though, when putting price on the tariff there is no clear methodology but efficient pricing of natural monopolies involves multiple parts. There are two type of designs, static and dynamic tariffs. Dynamic tariffs lead to higher reduction and shifting in peak load than static tariff design.
Psychological factors relating to electricity use. When designing a tariff, the DSO needs to
take multiple psychological factors into mind. The risk of not getting desirable effects are imminent if these are not addressed properly. Focus on monetary incentives solely could also lead to undesirable outcomes. A dynamic tariff should not be forced upon the customer and the form should not be too complex without enabling technologies.
6
METHODOLOGY
The purpose of this study is to examine possible tariff designs for a Swedish DSO to better reflect the individual’s future use of the grid when it comes to the expected effects of EV.
6.1
Research approach
A qualitative research approach has been chosen because of the complexity and lack of previous research of the phenomena (Reneses & Ortega, 2014; Creswell, 2009). Using a qualitative approach is well suited when questions of a how type have been formed. To get a deeper understanding of the issues regarding tariff design and the psychological factors affecting electricity use, words rather than numbers are of interest to describe the complexity. Although, by using the qualitative approach does not exclude quantitative data collection. (Eriksson & Kovalainen, 2008; Creswell, 2009) By using both interviews and figures of electricity consumption, using a two-phase data collection, a deeper understanding of the phenomena could be found (Creswell, 2009). Moreover, by using different sources and describing the case in full, the large amount of data needed for this kind of study have been collected. It thereby makes the study analytical generalized and because of that receives validity. (Blomqvist & Hallin, 2014; Yin, 1994)
When trying to understand the complexity of the present, case studies are a typical research design (Eisenhardt, 1989). The iterative process of the thesis is visualized in figure 12.