Arterioscler Thromb Vasc Biol is available at www.ahajournals.org/journal/atvb
Correspondence to: Johan Sundström, MD, PhD, Department of Medical Sciences, Uppsala University, Akademiska sjukhuset, Ing 40, 5 tr SE-751 85 Uppsala, Sweden. Email johan.sundstrom@medsci.uu.se
The Data Supplement is available with this article at https://www.ahajournals.org/doi/suppl/10.1161/ATVBAHA.120.314356. For Disclosures, see page e235.
© 2020 American Heart Association, Inc.
CLINICAL AND POPULATION STUDIES
Global Plasma Metabolomics to Identify Potential
Biomarkers of Blood Pressure Progression
Yi-Ting Lin, Samira Salihovic, Tove Fall, Ulf Hammar, Erik Ingelsson, Johan Ärnlöv, Lars Lind, Johan Sundström
OBJECTIVE:
The pathophysiology of hypertension remains incompletely understood. We investigated associations of circulating
metabolites with longitudinal blood pressure (BP) changes in the Prospective Investigation of the Vasculature in Uppsala
Seniors cohort and validated the findings in the Uppsala Longitudinal Study of Adult Men cohort.
APPROACH AND RESULTS:
Circulating metabolite levels were assessed with liquid- and gas-chromatography coupled to mass
spectrometry among persons without BP-lowering medication at baseline. We studied associations of baseline levels of metabolites
with changes in BP levels and the clinical BP stage between baseline and a follow-up examination 5 years later. In the discovery
cohort, we investigated 504 individuals that contributed with 757 observations of paired BP measurements. The mean baseline
systolic and diastolic BPs were 144 (19.7)/76 (9.7) mm Hg, and change in systolic and diastolic BPs were 3.7 (15.8)/−0.5 (8.6)
mm Hg over 5 years. The metabolites associated with diastolic BP change were ceramide, triacylglycerol, total glycerolipids, oleic
acid, and cholesterylester. No associations with longitudinal changes in systolic BP or BP stage were observed. Metabolites with
similar structures to the 5 top findings in the discovery cohort were investigated in the validation cohort. Diacylglycerol (36:2) and
monoacylglycerol (18:0), 2 glycerolipids, were associated with diastolic BP change in the validation cohort.
CONCLUSIONS:
Circulating baseline levels of ceramide, triacylglycerol, total glycerolipids, and oleic acid were positively
associated with longitudinal diastolic BP change, whereas cholesterylester levels were inversely associated with longitudinal
diastolic BP change. Two glycerolipids were validated in an independent cohort. These metabolites may point towards
pathophysiological pathways of hypertension.
GRAPHIC ABSTRACT:
A
graphic abstract
is available for this article.
Key Words:
blood pressure
◼
hypertension
◼
metabolomics
H
ypertension is the leading risk factor for premature
deaths worldwide,
1and specific causes for the high
blood pressure are found in <1 out of 10.
2Hence,
clarifying the pathophysiology in the hope of effective
prevention and treatment of hypertension is of utmost
importance. Circulating metabolites reflect both
endog-enous and exogendog-enous metabolic pathway activities and
can, therefore, provide a dynamic, coordinated
under-standing of disease pathophysiology. Dysregulation of
metabolites have been associated with hypertension in
several animal models, such as nephrectomized or
spon-taneously hypertensive rats.
3–6However, differences in
metabolomics studies between humans and rodents have
been reported.
7Differences in diet, essential nutrients, and
metabolic pathways can cause significant metabolomic
dif-ferences between species.
8Previous human studies using
metabolomics approaches to explore the pathophysiology
of hypertension have suggested several potential
path-ways, including inflammatory processes, oxidative stress,
lipid profile, and gut microflora.
9,10But previous studies
in the field are scarce,
11–14findings are inconsistent, and
most studies are limited by small sample sizes and
cross-sectional study designs. Only one longitudinal study has
reported on associations of lipid metabolites with risk of
See accompanying editorial on page 1801
CLINICAL AND POPULATION
STUDIES - AL
incident hypertension.
11We are unaware of any previous
studies that have investigated associations of circulating
metabolites with longitudinal blood pressure (BP) changes
in normotensive persons. We hypothesize that circulating
metabolites associated with such longitudinal BP changes
could reflect pathways involved in the pathophysiology of
hypertension. We, therefore, explored associations of the
metabolome with subsequent 5-year BP change in the
PIVUS (Prospective Investigation of the Vasculature in
Uppsala Seniors Study) cohort and validated in the Uppsala
Longitudinal Study of Adult Men (ULSAM) cohort.
MATERIALS AND METHODS
The data that support the findings of this study are available
from the corresponding author on reasonable request.
Study Sample
Discovery Cohort
The PIVUS cohort was used as the discovery cohort. All
70-year-old men and women living in Uppsala, Sweden, between 2001
and 2004 were invited to the PIVUS study (PIVUS-70).
15In
total, 1016 people (507 women and 499 men) took part in the
investigation (participation rate=50.1%). A second examination
cycle was performed in 2006 to 2009 when the participants
were 75 years old (PIVUS-75), and a third cycle in 2011 to
2014, when the participants were 80 years old (PIVUS-80).
Metabolomics analyses of plasma samples from the first 2
cycles, and BP measurements from all 3 cycles, were used in
this study to maximize statistical power.
Participants with heart failure, myocardial infarction, or
stroke history at baseline or follow-up were excluded from this
study. We also excluded those with any missing in BP
mea-surements at baseline or follow-up. Because antihypertensive
drugs have effects on plasma metabolomic profiles,
16partici-pants with antihypertensive treatment at the baseline of each
observation period were also excluded from this study.
In the observation periods between 70 and
PIVUS-75, there were 498 subjects with complete BP measurements
at both examinations, and 476 of them had metabolomics data
at baseline (PIVUS-70); in the observation periods between
PIVUS-75 and PIVUS-80, 263 had BP measurements at both
examinations, of which 259 had metabolomics data at baseline
(PIVUS-75). Hence, 253 persons were observed twice (one
observation period between PIVUS-70 and PIVUS-75 and
another between PIVUS-75 and PIVUS-80) and 251 subjects
were observed once (either from PIVUS-70 to PIVUS-75 or
from PIVUS-75 to PIVUS-80). In sum, 504 individuals
contrib-uted with 757 observation periods in this study (Figure 1).
All participants provided written informed consent, Uppsala
University’s ethics committee approved the study, and the study
was conducted in accordance with the Helsinki Declaration.
Validation Cohort
The ULSAM study was initiated in 1970. All 50-year-old men
born between 1920 and 1924 and living in Uppsala, Sweden
were invited to a health survey, focusing on identifying
cardio-vascular risk factors (described in detail at www.pubcare.uu.se/
ULSAM).
17The participants were, thereafter, invited to
examina-tions at age 60, 70, 77, 82, and 88 years. Plasma samples were
available for 1138 participants at 70 years of age (1991–1994).
The present study used the fourth examination cycle as the
baseline, when the participants were about 77 years old (1998–
2001). We used the fifth examination cycle (2003–2005) as a
follow-up examination when participants were ≈82 years old.
Blood samples for metabolomics profiling were frozen
imme-diately after separation of plasma and stored at −80°C until
analysis. Participants without complete BP records or receiving
antihypertensive treatment at baseline were excluded from the
study, resulting in 222 individuals included in the current study.
Baseline and Follow-Up Examinations
All participants were examined in the early morning after an
overnight fast without any medication or smoking. A
question-naire surveying smoking habits, previous medical history, and
current regular medication was completed by each participant.
Height, weight, and body mass index (weight [kg]/height
[m]
2), were measured under standardized conditions. Waist
Nonstandard Abbreviations and Acronyms
BP
blood pressure
COX-1 cyclooxygenase-1
DBP
diastolic blood pressure
iPLA2
calcium-independent phospholipase A2
LDL
low-density lipoprotein
PIVUS
Prospective Investigation of the
Vascula-ture in Uppsala Seniors Study
SBP
systolic blood pressure
TXAS
thromboxane synthase
ULSAM
Uppsala Longitudinal Study of Adult Men
Highlights
• We investigated associations of a large number of
metabolites, assessed using gas
chromatography-mass spectrometry and liquid chromatography-tandem
mass spectrometry, with blood pressure progression
in a population-based cohort and validated in another
independent cohort. This is the first study to
evalu-ate association of metabolites with longitudinal blood
pressure progression using global metabolomics.
• Higher circulating baseline levels of ceramide,
triac-ylglycerol, total glycerolipids, and oleic acid, and lower
cholesterylester levels, were associated with
longitu-dinal diastolic blood pressure increase. Two
glycero-lipids were validated in an independent cohort.
• We found novel associations of metabolites with
longitudinal blood pressure increase using a
com-bined nontargeted and targeted mass
spectrom-etry metabolomics approach in a population-based
cohort. Unravelling the cause of hypertension is
important given the immense public health burden.
CLINICAL AND POPULATION
STUDIES - AL
circumference was measured at the umbilical level. Fasting
blood glucose and lipids were measured by standard
tech-niques. Serum cystatin C was measured by latex-enhanced
reagent (N Latex Cystatin C, Dade Behring) with a Behring BN
ProSpec analyzer (Dade Behring). Estimated glomerular
filtra-tion rate was calculated from serum cystatin C concentrafiltra-tions
(milligrams per liter) by the formula: y=77.24×cystatin C
−1.2623.
18Diabetes mellitus was defined as P-glucose ≥7.0 mmol/L or
use of oral glucose-lowering agents or insulin.
In the PIVUS cohort, BP was measured to the nearest 1
mm Hg after at least 30 minutes of rest in a supine position,
and the average of 3 recordings was used. In the ULSAM
cohort, a nurse or physician measured BP twice in the right arm
to the nearest even number after a 10-minute rest in the supine
position, and the mean value was calculated. For patients
tak-ing any pharmaceutical BP-lowertak-ing treatment at follow-up,
BP values at follow-up were imputed by adding 10 mm Hg to
the actual systolic BP (SBP) and 5 mm Hg to the diastolic BP
(DBP) measurements at follow-up.
19Sensitivity analyses of
imputation by adding 15 mm Hg to SBP were also done. The
3 outcomes investigated were change in BP stage (defined
as JNC7 guideline BP categories, as in previous studies
20–22)
and change in continuous SBP and DBP between baseline and
follow-up.
Metabolomics Profiling
Metabolomics analyses in PIVUS were performed by
Metanomics GmbH (Berlin, Germany). Gas
chromatography-mass spectrometry (Agilent 6890 GC coupled to an Agilent
5973 MS-System, Agilent, Waldbronn, Germany) and liquid
chromatography-tandem mass spectrometry (Agilent 1100
high-performance liquid chromatography system [Agilent,
Waldbronn, Germany] coupled to an Applied Biosystems
API 4000 triple quadrupole mass spectrometer [Applied
Biosystems, Darmstadt, Germany]) were used for metabolic
profiling, as described in detail elsewhere.
23–25Proteins were
precipitated from plasma samples using 3 volumes of
ace-tonitrile, and polar and nonpolar fractions were separated by
adding water and a mixture of ethanol and dichloromethane
(2:1, v/v). For gas chromatography-mass spectrometry
anal-ysis, the nonpolar fraction was treated with methanol under
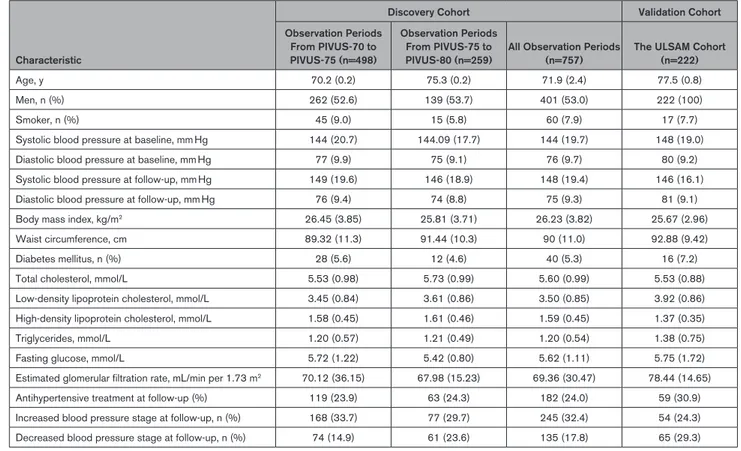
Figure 1.
Study design; 504 individuals contributed with 757 observations with paired blood pressure measurements in the
discovery cohort and 222 individuals in the validation cohort.
CLINICAL AND POPULATION
STUDIES - AL
acidic conditions to yield the fatty acid methyl esters derived
from both free fatty acids and hydrolyzed complex lipids. The
polar and nonpolar fractions were further derivatized with
O-methyl-hydroxylamine hydrochloride to convert oxo-groups
to O-methyl-oximes, and subsequently with a
N-methyl-N-(trimethylsilyl) trifluoroacetamide before analysis. For liquid
chromatography-tandem mass spectrometry analysis, both
fractions were reconstituted in appropriate solvent mixtures,
and high-performance liquid chromatography was performed
by gradient elution using methanol/water/formic acid on
reversed phase separation columns. Mass spectrometric
detection was performed with in targeted mode with
repeti-tive cycles of multiple reaction monitoring transitions for
pre-selected metabolites followed by nontargeted mode with a full
scan from a mass-to-charge ratio of 100 to 1000. The
instru-ment was operated in positive electrospray ionization mode
for metabolites in the nonpolar fraction (lipid fraction) and in
negative ionization mode for metabolites in the polar fraction.
Internal standards were added to increase precision, to quality
control the entire analytical process, and to monitor the
stabil-ity of the measurement. The internal standards used within this
study were either isotope-labeled compounds or chemicals
representing different chemical structures and polarities such
as amino acids, carbohydrates, cofactors, and lipids.
25Metabolite identification was done by comparing mass to
charge ratio (M/z), retention time, and fragmentation to
authen-tic standards. Metabolite normalization and quantification were
calculated by determining metabolite levels in each study
sample relative to metabolite concentrations in reference pool
samples that were formed from aliquots of all study samples. To
allow an experiment-comprehensive alignment of data sets, the
semi-quantitative data were further normalized to the median
of MxPool samples representing a pool of commercial human
EDTA plasma containing >2000 different metabolites of known
concentrations. A one-point calibration was used to quantify
those metabolites that are present in the MxPool. Both types of
pooled reference samples were run in parallel through the entire
process. Metabolites that could not be quantified by MxPool
method were analyzed semi-quantitatively. Quality control of the
metabolomics dataset at the laboratory site comprised quality
checks on peak, analyte, and sample level. Furthermore, quality
assessment of plasma samples was performed using the MxP
Biofluids Quality Control assay (Metanomics Health), only those
metabolites that met specific quality criteria were included in
further statistical analyses (Table I in the
Data Supplement
) A
total of 563 named metabolites and 638 unknown analytes
were detected at baseline. Of these, 955 had low detectability
and were excluded from further analysis. Metabolite
identifica-tion was done by comparison to authentic standards first. Then
several extra experiments were done to further elucidate
struc-ture, such as high-resolution measurements using Fourier
trans-form ion cyclotron resonance MS (Bruker Solarix), the addition
of salts, peak purification via fractionation, and MS experiments.
These procedures provided more information on metabolite
structures, such as atmospheric pressure chemical ionization.
25In total, 246 high-quality metabolites could be analyzed in the
present metabolomics data set (including quantitative results for
171 metabolites and semi-quantitative data for 75 metabolites).
Before statistical analysis, we excluded metabolites with >15%
samples below the limit of detection, and subjects with >5%
missing metabolites values were also excluded. We further
excluded a few metabolites that showed a strong bimodal
distri-bution at age 75, possibly related to batch effects undetected in
initial quality control. After quality control process, 220
metabo-lites remained and are listed in Table I in the
Data Supplement
.
To ensure the quality of the measurement, the comparison on
2 metabolites from the PIVUS cohort with those of established
clinical chemistry measurements was done and found a
moder-ate to high correlation (glucose, Spearman ρ=0.69, P<0.001;
creatinine, Spearman ρ=0.86, P<0.001).
Metabolomics analyses in ULSAM was performed using
ultra-performance liquid chromatography on a Waters Acquity
ultra-performance liquid chromatography system coupled to a
quadrupole time-of-flight mass spectrometer (Xevo G2 Q-TOF
MS; Waters Corporation, Milford, MA) platform at the Proteomics
and Metabolomics Facility of Colorado State University (Fort
Collins, CO), as previously described.
26,27Nonconsecutive
dupli-cate sample aliquots of 1 µL were injected onto an Acquity
ultra-performance liquid chromatography C8 column (1.8
µmol/L, 1.0×100 mm) analytical column held at 50°C using a
gradient from solvent A (95% water, 5% methanol, 0.1% formic
acid) to solvent B (95% methanol, 5% water, 0.1% formic acid).
Injections were made in 100% A, which was held for 0.1 minute,
ramped to 40% B in 0.9 minutes, to 70% B over 2 minutes,
and to 100% B over 8 minutes. The mobile phase was held at
100% B for 6 minutes, returned to starting conditions over 0.1
minutes, and allowed to re-equilibrate at for 5.9 minutes. The
flow rate was constant at 140 µL/min for the duration of the
run. The column was held at 50°C, while samples were held
at 10°C. Data acquisition in the positive electrospray ion mode
with a mass-to-charge ratio (m/z) range of 50 to 1200 at 5 Hz
was alternately performed in MS mode at a collision energy of
6 V and in indiscriminate MS/MS mode using higher collision
energy (15–30 V). Calibration was performed before sample
analysis via infusion of sodium formate solution, with mass
accuracy within 1 ppm. The capillary voltage was held at 2200
V, the source temp at 150°C, and the desolvation temperature
at 350°C at a nitrogen desolvation gas flow rate of 800 L/h.
The quadrupole was held at a collision energy of 6 volts. The
acquired raw data (chromatograms and mass spectra) were
taken further into a metabolomics data processing workflow by
XCMS package (Scripps Center for Metabolomics and Mass
Spectrometry, La Jolla, CA).
28The XCMS data processing
per-forms peak detection, alignment, grouping, and imputation of the
metabolic features characterized by a unique m/z and retention
time. In total, 10 162 features were detected and adjusted for
factors of external variability (plate/batch effect, analysis date,
retention, time drift, and sample collection) by ANOVA-type
standardization and log-transformation; by removal of spectra
with abnormal intensities and low inter-duplicate correlations
and retention times. For each feature, retention time, m/z, and
fragmentation patterns were compared with in-house and public
database reference libraries (>950 reference standards) and
matched according to Metabolomics Standard Initiative
guide-lines
29to annotate spectra to metabolite names.
Power Analysis
Because of the limited sample size in the present study, we
assessed the statistical power to detect associations using
1000 Monte Carlo simulations. We assumed that BP stage
progression would range between −3 and 3, with 1% in the
CLINICAL AND POPULATION
STUDIES - AL
outer categories, 4% in the categories −2 and 2 respectively,
20% in −1 and 1 and 50% in 0 category. The assumptions of
shifts between BP stages were based on the observed data.
We tested univariate associations of 220 metabolites, of which
1 was truly associated with the outcome by applying a
mixed-effects ordinal regression model with a Benjamini-Hochberg
correction for multiple testing, with a false discovery rate of
<5%.
30,31All metabolites were assumed to be normalized to a
standard normal distribution. For a sample size of 500
individu-als, with half of them having one and half of them 2 measures
of BP stage progression, we would have 80% power to detect
an odds ratio of 1.45 per SD. Using a standard threshold of
0.05, 4.9% of nonassociated metabolites were declared
signifi-cant. After false discovery rate-correction, there was on
aver-age 0.09 false positive findings per simulation (corresponding
to a false positive rate of 0.04% per metabolite).
Statistical Analysis
The study design is described in Figure 1.The mean (SD) and
count (percent) were presented in Table 1. Metabolite variables
were log
10-transformed to obtain an approximately normal
distribution.
The PIVUS cohort was used in the discovery phase, and the
ULSAM cohort was used for replication. In the discovery phase,
the associations between the 220 metabolites and BP change
over 5 years were investigated. Because we had more than one
observation per individual, we analyzed associations of baseline
metabolites in SD units with longitudinal BP change (BP
dif-ference between baseline and follow-up 5 years later) using
mixed ordered logistic regression for BP stage progression and
mixed linear regression for continuous SBP and DBP change.
We assumed fixed effects for metabolites, age, sex and
base-line SBP and DBP, and a random intercept for subject ID. In
the mixed-effects regression, we assumed an independent
cor-relation structure which allows a distinct variance for each
ran-dom effect of subject and all covariances are 0. This handled
the fact that some individuals contributed with 2 observations.
Volcano plots for ORs or β coefficients and corresponding P
values from the corresponding ordered logistic or linear mixed
models were presented.
Adjustment for multiple comparisons was performed,
con-sidering an false discovery rate <5% as metabolome-wide
significant for each outcome (longitudinal change in SBP and
DBP, and BP stage progression). False discovery rate was
calculated according to the original version of Benjamini and
Hochberg from 1995.
32The rationale for this significance
threshold was that we wanted to find a reasonable balance
between false positive and false negative findings. We ranked
the metabolites by ascending P value and provided
bootstrap-obtained CIs around the ranks to quantify the uncertainty of the
importance of each metabolite.
33To validate the findings from the discovery phase,
struc-turally similar metabolites as those found associated with BP
progression in PIVUS were investigated in the validation
sam-ple, using the same covariates with the exception of sex, as
ULSAM is all-male.
In a subsequent phase, we sought to investigate potential
causality of any findings using mixed models with multivariable
adjustment. The choice of variables for the adjusted models was
based on a causal diagram assisted by DAGitty,
34version 2.2,
software (www.dagitty.net; Figure I in the
Data Supplement
).
35Causal directed acyclic graphs are useful to help identify
suf-ficient and minimum covariates to produce bias-minimized
models and to provide an overview of the causal assumptions
made. The model included fixed effects for covariates age, sex,
baseline BPs, body mass index, waist circumference, smoking,
diabetes mellitus, LDL (low-density lipoprotein), fasting
glu-cose, estimated glomerular filtration rate, and physical activity,
all assessed at baseline. Covariates that play important roles in
BP tracking were chosen based on previous knowledge.
36The nature of the associations of the top metabolites with
DBP change were investigated using restricted cubic splines
with 3 knots. Sensitivity analyses of participants with and
with-out antihypertensive drug during follow-up were also done.
All the statistical methods were performed using Stata
(ver-sion 15, College Station, TX).
RESULTS
Baseline Characteristics
Baseline characteristics of the discovery and validation
cohorts are shown in Table 1. The mean SBP/DBP are
144 (20)/76 (10) at baseline and 148 (19)/75 (9) at
follow-up in the discovery cohort and 148 (19)/80 (9)
at baseline and 146 (16)/81 (9) at follow-up in the
vali-dation cohort. Distributions of the changes in SBP and
DBP are presented in Figure II in the
Data Supplement
.
Associations of Baseline Metabolites With
Longitudinal BP Change
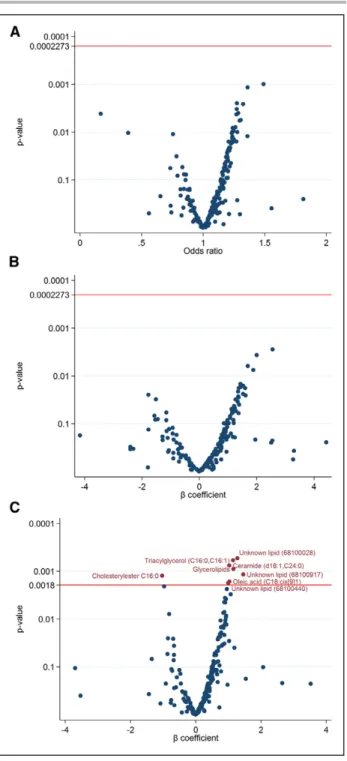
In the discovery phase, estimates of the associations of
the 220 metabolites with change in BP stage and
con-tinuous BP, and corresponding P values, are displayed in
Figure 2 and Tables II, III, and IV in the
Data Supplement
.
Among the 220 analyzed metabolites, no metabolite
was associated with BP stage progression or
continu-ous SBP change (Figure 2A and 2B). Levels of ceramide
(d18:1,C24:0), triacylglycerol (C16:0,C16:1), total
glyc-erolipids, and oleic acid (C18:cis[9]1) were positively
associated with continuous DBP change, and
choles-terylester C16:0 was negatively associated with DBP
change (Figure 2C). Sensitivity analyses with imputation
of 15 mm Hg to SBP for treated produced similar results.
Ranking of the associations (with 95%
bootstrap-obtained CIs) of metabolites with BP stage progression
(Figure IV in the
Data Supplement
), continuous SBP
(Fig-ure V in the
Data Supplement
), and DBP change (Figure
VI in the
Data Supplement
) are graphically presented in
the
Data Supplement
. The ceramide (d18:1,C24:0),
cho-lesterylester C16:0, triacylglycerol (C16:0,C16:1), total
glycerolipids, and oleic acid (C18:cis[9]1) were within
the top 10 hits, but with wide confidence intervals of the
ranking, as expected.
In the subsequent phase using mixed models with
multivariate adjustment, ceramide (d18:1,C24:0; β, 1.06
CLINICAL AND POPULATION
STUDIES - AL
[95% CI, 0.50–1.61]), triacylglycerol (C16:0,C16:1; β,
1.00 [95% CI, 0.43–1.57]), total glycerolipids (β, 0.95
[95% CI, 0.40–1.50]), and oleic acid (C18:cis[9]1; β,
0.92 [95% CI, 0.37–1.47]) were independently
asso-ciated with continuous DBP change (adjusting for
baseline age, sex, diastolic BP, body mass index, waist
circumference, smoking, diabetes mellitus, LDL, fasting
glucose, estimated glomerular filtration rate, and
physi-cal activity; Table 2). Cholesterylester (C16:0; β, −1.06
[95% CI, −1.65 to −0.47]) was independently
nega-tively associated with continuous DBP change in these
models.
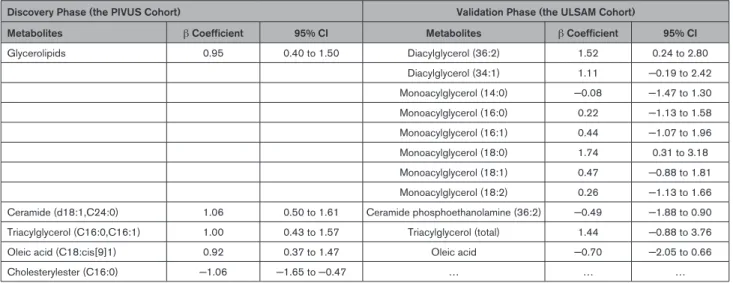
In the validation phase, 11 metabolites available in
the validation cohort that had similar structure to the 5
top findings in the discovery cohort were investigated.
Diacylglycerol (36:2; β, 1.52 [95% CI, 0.24–2.80]) and
monoacylglycerol (18:0; β, 1.74 [95% CI, 0.31–3.18), 2
glycerolipids, were significantly associated with diastolic
BP change (Table 2, Figures VII and VIII in the
Data
Supplement
).
In secondary analyses in the discovery cohort, cubic
spline models demonstrated chiefly linear association
of metabolites on diastolic BP among ceramide (d18:1,
C24:0), triacylglycerol (C16:0, C16:1), glycerolipids, and
cholesterylester (C16:0), except oleic acid (C18:cis[9]1;
Figure III in the
Data Supplement
). In sensitivity analyses,
the heterogeneity between participants with or without
antihypertensive treatment during follow-up was low (I
square=0, Figure IX in the
Data Supplement
).
DISCUSSION
Principal Observations
In this study, we investigated associations of a large
number of circulating metabolites with longitudinal BP
progression in a population-based cohort. Accounting for
multiple testing, and in mixed models with multivariable
adjustment, baseline levels of 4 metabolites (ceramide
[d18:1, C24:0], triacylglycerol [C16:0, C16:1], total
glyc-erolipids, and oleic acid [C18:cis[9]1]) were positively
associated with longitudinal change in DBP. One
metab-olite (cholesterylester C16:0) was negatively associated
with DBP change. In the validation study, diacylglycerol
(36:2) and monoacylglycerol (18:0), 2 glycerolipids, were
associated with diastolic BP change.
The Evidence for the Role of Lipidomics in
Hypertension
Observational studies have suggested that
dyslipid-emia, by way of endothelial dysfunction,
37may
con-tribute to the development of hypertension.
38,39In a
longitudinal analysis of the San Antonio Family Heart
Table 1.
Baseline Characteristics of 757 Observations of 504 Participants in the Discovery Cohort (Prospective Investigation of
the Vasculature in Uppsala Seniors) and Validation Cohort (Uppsala Longitudinal Study of Adult Men)
Characteristic
Discovery Cohort Validation Cohort Observation Periods From PIVUS-70 to PIVUS-75 (n=498) Observation Periods From PIVUS-75 to PIVUS-80 (n=259)
All Observation Periods (n=757)
The ULSAM Cohort (n=222)
Age, y 70.2 (0.2) 75.3 (0.2) 71.9 (2.4) 77.5 (0.8)
Men, n (%) 262 (52.6) 139 (53.7) 401 (53.0) 222 (100)
Smoker, n (%) 45 (9.0) 15 (5.8) 60 (7.9) 17 (7.7)
Systolic blood pressure at baseline, mm Hg 144 (20.7) 144.09 (17.7) 144 (19.7) 148 (19.0) Diastolic blood pressure at baseline, mm Hg 77 (9.9) 75 (9.1) 76 (9.7) 80 (9.2) Systolic blood pressure at follow-up, mm Hg 149 (19.6) 146 (18.9) 148 (19.4) 146 (16.1) Diastolic blood pressure at follow-up, mm Hg 76 (9.4) 74 (8.8) 75 (9.3) 81 (9.1) Body mass index, kg/m2 26.45 (3.85) 25.81 (3.71) 26.23 (3.82) 25.67 (2.96) Waist circumference, cm 89.32 (11.3) 91.44 (10.3) 90 (11.0) 92.88 (9.42)
Diabetes mellitus, n (%) 28 (5.6) 12 (4.6) 40 (5.3) 16 (7.2)
Total cholesterol, mmol/L 5.53 (0.98) 5.73 (0.99) 5.60 (0.99) 5.53 (0.88) Low-density lipoprotein cholesterol, mmol/L 3.45 (0.84) 3.61 (0.86) 3.50 (0.85) 3.92 (0.86) High-density lipoprotein cholesterol, mmol/L 1.58 (0.45) 1.61 (0.46) 1.59 (0.45) 1.37 (0.35)
Triglycerides, mmol/L 1.20 (0.57) 1.21 (0.49) 1.20 (0.54) 1.38 (0.75)
Fasting glucose, mmol/L 5.72 (1.22) 5.42 (0.80) 5.62 (1.11) 5.75 (1.72) Estimated glomerular filtration rate, mL/min per 1.73 m2 70.12 (36.15) 67.98 (15.23) 69.36 (30.47) 78.44 (14.65) Antihypertensive treatment at follow-up (%) 119 (23.9) 63 (24.3) 182 (24.0) 59 (30.9) Increased blood pressure stage at follow-up, n (%) 168 (33.7) 77 (29.7) 245 (32.4) 54 (24.3) Decreased blood pressure stage at follow-up, n (%) 74 (14.9) 61 (23.6) 135 (17.8) 65 (29.3)
PIVUS indicates Prospective Investigation of the Vasculature in Uppsala Seniors Study.
CLINICAL AND POPULATION
STUDIES - AL
Study, phosphatidylethanolamine 40:6, diacylglycerols
16:0/22:5 and 16:0/226 were associated with risk of
incident hypertension.
11In cross-sectional analyses, a
dicarboxylic long-chain fatty acid was associated with
BPs in the Twin UK study and replicated in the KORA
(Cooperative Health Research in the Region of
Augs-burg) and Hertfordshire studies,
13and 14 lipid species
were associated with BPs in the San Antonio Family
Heart Study.
11No study has addressed associations of
lipid metabolites with longitudinal change in
continu-ous BP change among untreated. In the present study,4
metabolites (ceramide, triacylglycerol, total glycerolipids,
and oleic acid) positively associated with longitudinal
change in DBP and confirmed the potential importance
of lipid metabolites in hypertension development.
Derangement of lipid metabolism is one of the key
characteristics of hypertension.
40–42Lipids are typically
subdivided into 8 categories: sphingolipids,
glycerolip-ids, fatty acyls, phospholipglycerolip-ids, sterol lipglycerolip-ids, prenol lipglycerolip-ids,
saccharolipids, and polyketides.
43,44In the present study,
representatives of 3 of these categories—sphingolipids
(ceramide), glycerolipids (triacylglycerol), and fatty acyls
(oleic acid, cholesterylester)—were associated with DBP
change. Associations of metabolites with DBP change
were found, but not with SBP change, although
metabo-lites associated with DBP change were also among the
highest ranked for associations with SBP change. Power
deficit may be one explanation for the insignificant SBP
results; and regression to the mean in repeated BP
mea-surements may affect SBP more than DBP due to higher
variability.
45–47Potential mechanistic underpinnings
include that DBP may be more affected by hormonal
pathways mediated by metabolites; and that
atheroscle-rosis and stiff arteries and arterioles explain increasingly
more of SBP with increasing age, drowning out other
pathways. The specific potential roles of 3 lipid
catego-ries are described below.
The Role of Sphingolipids (ie, Ceramide) in
Hypertension
Previous observational studies mostly correspond to our
finding of a positive association of ceramide with
longi-tudinal DBP change. Plasma ceramides C16:0, C22:0,
C24:0, and C24:1 were elevated in both
spontane-ously hypertensive rats and treatment-naïve patients
with stage 1 to 3 hypertension in one study.
48In the
PREDIMED trial (Prevención con Dieta Mediterránea),
a higher ceramide concentration was associated with
higher DBP in a cross-sectional setting.
49The sphingolipid system was suggested to be involved
in BP regulation in 2 experimental studies.
50,51The central
intermediate of the sphingolipid biosynthetic pathway is
ceramide. Ceramides can mediate vascular dysfunction
by inhibiting the endothelial nitric oxide synthase-serine/
threonine protein kinases-heat shock protein 90
signal-ing complex.
52Besides, ceramides lead to
endothelium-dependent arterial contraction by inducing the release of
thromboxane A2 via a iPLA2 (calcium-independent
phos-pholipase A2), COX-1 (cyclooxygenase-1), and TXAS
(thromboxane synthase) dependent pathway.
48In addition,
vascular ceramide levels are sensitive to antihypertensive
Figure 2.
The relationship between baseline metabolites and
blood pressure outcomes.
Volcano plot of associations of baseline metabolites with (A) blood
pressure stage progression, (B) systolic blood pressure change, and
(C) diastolic blood pressure change over 5 years (red line set false
discovery rate 5% corrected P value), using mixed ordered logistic
(for blood pressure stage progression) or mixed linear (for change in
continuous blood pressures) models, with fixed effects for age, sex,
and baseline blood pressures.
CLINICAL AND POPULATION
STUDIES - AL
therapy. Losartan lowers vascular ceramide levels and
improves endothelial function via inhibition of
ceramide-mediated endothelium-dependent vasoconstriction.
53Thus, sphingolipids contribute to endothelial dysfunction
by inhibiting endothelium-derived relaxing factors and
producing endothelium-derived contracting factors.
The Role of Glycerolipids (ie, Triacylglycerol) in
Hypertension
Insulin resistance may play an important role in the
asso-ciation of glycerolipids with hypertension. Lower
lysophos-phatidylcholines and higher triacylglycerols have been
suggested as a lipidomic profile of insulin resistance.
54,55Hence, the association of triacylglycerols with longitudinal
DBP change in our study may involve insulin resistance.
Insulin resistance has been proposed as a cause of
hyper-tension,
56–58and this relationship was independent of body
mass index.
21,59,60Studies suggested insulin resistance
was correlated to hypertension because of abnormalities
in vasodilatation, blood flow, the
renin-angiotensin-aldo-sterone system, and over-activity of the sympathetic
ner-vous system.
61Thus, insulin resistance may be considered
as a molecular marker of multiple metabolic abnormalities
frequently associated with hypertension.
The Role of Fatty Acyls (ie, Oleic Acid,
Cholesterylester) in Hypertension
Hypertensive obesity patients have elevated plasma
nonesterified fatty acids, including oleic acid.
62Circulat-ing oleic acid level has been observed to be higher in
patients with hypertension,
63positively associated with
DBP,
64and associated with circadian BP disturbances.
65The possible underlying pathological process suggested
by previous studies could be that oleic acid increases
the production of mitochondrial reactive oxygen species,
decreases the activity of endothelial nitric oxide synthesis
activity,
66and regulates the α and β adrenergic receptors
involved in controlling the central and peripheral BP.
67,68Studies investigating associations of cholesteryl esters
with hypertension are scarce. Cholesterol esters are
cho-lesterol molecules with long-chain fatty acids linked to
the hydroxyl group. Cholesterol esters accumulate in the
fatty lesions of atherosclerotic plaques and are major
constituents of the lipoprotein particles carried in blood
(HDL, LDL, VLDL).
69Cholesteryl esters are involved in
atherosclerosis,
70which is linked to arterial stiffness,
71known to increase systolic pressure (because of reduced
capacitance) and lower diastolic pressure (because of
less elastic recoil) in older age.
72These phenomena
cor-respond with our finding of inverse associations of
cir-culating cholesteryl esters with DBP change. In addition,
one small cohort study reported lower cholesteryl ester
levels in patients with hypertension,
73in support of our
findings.
Strengths and Limitations
Strengths of this study include the application of
metab-olomics to a well-defined population-based
longitudi-nal study with minimal loss to follow-up, correction for
multiple testing, and adjustment for potential
confound-ers. The investigated metabolites have been previously
validated, and we applied a predefined quality control
scheme for all metabolites. Moreover, the validation study
partially confirmed the results from the discovery cohort.
We also estimated the uncertainty of the ranking of all
metabolite associations.
Table 2.
Associations in the Discovery Cohort of Baseline Levels of 5 Metabolites With Change in Diastolic Blood Pressure
Between Baseline and Follow-Up 5 Years, and Associations of Structurally Similar Metabolites in the Validation Cohort
Discovery Phase (the PIVUS Cohort) Validation Phase (the ULSAM Cohort)
Metabolites β Coefficient 95% CI Metabolites β Coefficient 95% CI
Glycerolipids 0.95 0.40 to 1.50 Diacylglycerol (36:2) 1.52 0.24 to 2.80 Diacylglycerol (34:1) 1.11 −0.19 to 2.42 Monoacylglycerol (14:0) −0.08 −1.47 to 1.30 Monoacylglycerol (16:0) 0.22 −1.13 to 1.58 Monoacylglycerol (16:1) 0.44 −1.07 to 1.96 Monoacylglycerol (18:0) 1.74 0.31 to 3.18 Monoacylglycerol (18:1) 0.47 −0.88 to 1.81 Monoacylglycerol (18:2) 0.26 −1.13 to 1.66 Ceramide (d18:1,C24:0) 1.06 0.50 to 1.61 Ceramide phosphoethanolamine (36:2) −0.49 −1.88 to 0.90 Triacylglycerol (C16:0,C16:1) 1.00 0.43 to 1.57 Triacylglycerol (total) 1.44 −0.88 to 3.76 Oleic acid (C18:cis[9]1) 0.92 0.37 to 1.47 Oleic acid −0.70 −2.05 to 0.66
Cholesterylester (C16:0) −1.06 −1.65 to −0.47 … … …
β coefficients express the associations of baseline metabolites (per SD) with diastolic blood pressure change, using mixed linear regression including fixed effects for the metabolite and covariates age, sex, diastolic blood pressure, body mass index, waist circumference, smoking, diabetes mellitus, low-density lipoprotein, fasting glucose, estimated glomerular filtration rate, and physical activity, all assessed at baseline, and random intercept for subject ID, in the discovery phase. Linear regression controlling for the same confounders were used in the validation phase. PIVUS indicates Prospective Investigation of the Vasculature in Uppsala Seniors Study; and ULSAM, Uppsala Longitudinal Study of Adult Men.
CLINICAL AND POPULATION
STUDIES - AL
Several limitations need to be acknowledged. First, we
only included elderly people living in Sweden, so
general-izability to other populations and age groups is unknown.
We excluded persons with comorbidities and use of
antihypertensive drugs, which limits the generalizability
somewhat. Besides, participants whose data were used
in the analyses might be different from those whose data
were not included or who dropped out. We do not know
whether this missingness is informative or not. Second,
a healthy cohort effect may be in play because only
par-ticipants surviving without myocardial infarction or stroke
during follow-up were included, and their BP tracking
may differ from those who died. Third, some potential
confounders, such as baseline BPs, may also partly be
on the causal pathway to BP progression (Figure V in
the
Data Supplement
). Fourth, glycerolipids were the
only metabolites that could be validated in the replication
cohort. The replication efforts were limited by low
statis-tical power due to a small sample, and the fact that the
validation sample was all-male. Finally, no proper
analy-sis of causality using Mendelian randomization could be
done because of lack of appropriate instruments for the
investigated metabolites and lack of large studies of BP
progression. Although previous studies provide some
support for the biological plausibility of our findings, more
proof of causality are necessary.
Conclusions
A comprehensive metabolomic approach can help to
elu-cidate the molecular mechanisms underpinning
hyper-tension. We discovered 4 metabolites (ceramide [d18:1,
C24:0], triacylglycerol, glycerolipids, and oleic acid
[C18:cis[9]1]) that were directly associated with
subse-quent longitudinal DBP change in a population-based
cohort, and one (cholesterylester C16:0) inversely
associ-ated with DBP change. Two glycerolipid associations were
validated in an independent cohort. These metabolites
could point towards pathophysiological pathways of
hyper-tension; elucidating those pathways may lead to
under-standing of potentially treatable causes of hypertension.
ARTICLE INFORMATION
Received January 1, 2020; accepted April 29, 2020.
Affiliations
From the Department of Medical Sciences, Uppsala University, Sweden (Y.-T.L., S.S., T.F., U.H., E.I., L.L., J.S.); Department of Family Medicine, Kaohsiung Medical University Hospital (Y.-T.L.) and Faculty of Medicine, College of Medicine (Y.-T.L.), Kaohsiung Medical University, Taiwan; School of Medical Sciences (S.S.) and School of Science and Technology (S.S.), Örebro University, Sweden; Division of Cardiovascular Medicine, Department of Medicine (E.I.), Stanford Cardiovascular Institute (E.I.), and Stanford Diabetes Research Center (E.I.), Stanford University School of Medicine, CA; Division of Family Medicine and Primary Care, Depart-ment of Neurobiology, Care Science and Society, Karolinska Institutet, Huddinge, Sweden (J.Ä.); School of Health and Social Studies, Dalarna University, Falun, Sweden (J.Ä.); and The George Institute for Global Health, University of New South Wales, Sydney, NSW, Australia (J.S.).
Acknowledgments
J. Sundström and Y.-T. Lin are the guarantors of this work, had full access to all the data, and take full responsibility for the integrity of the data and the accuracy of data analysis.
Disclosures
The company Metanomics Health GmbH had no influence over design, analysis, or interpretation of data in the present study and did not provide any funding for the study. J. Sundström is on an advisory board for Itrim. The other authors report no conflicts.
REFERENCE
1. Forouzanfar MH, Liu P, Roth GA, Ng M, Biryukov S, Marczak L, Alexander L, Estep K, Hassen Abate K, Akinyemiju TF, et al. Global Burden of Hyperten-sion and Systolic Blood Pressure of at Least 110 to 115 mm Hg, 1990-2015. JAMA. 2017;317:165–182. doi: 10.1001/jama.2016.19043 2. Chen S. Essential hypertension: perspectives and future directions. J
Hyper-tens. 2012;30:42–45. doi: 10.1097/HJH.0b013e32834ee23c
3. Hanifa MA, Skott M, Maltesen RG, Rasmussen BS, Nielsen S, Frøkiær J, Ring T, Wimmer R. Tissue, urine and blood metabolite signatures of chronic kidney disease in the 5/6 nephrectomy rat model. Metabolomics. 2019;15:112. doi: 10.1007/s11306-019-1569-3
4. Feng YL, Cao G, Chen DQ, Vaziri ND, Chen L, Zhang J, Wang M, Guo Y, Zhao YY. Microbiome-metabolomics reveals gut microbiota asso-ciated with glycine-conjugated metabolites and polyamine metabolism in chronic kidney disease. Cell Mol Life Sci. 2019;76:4961–4978. doi: 10.1007/s00018-019-03155-9
5. Zhang ZH, Chen H, Vaziri ND, Mao JR, Zhang L, Bai X, Zhao YY. Metab-olomic Signatures of Chronic Kidney Disease of Diverse Etiologies in the Rats and Humans. J Proteome Res. 2016;15:3802–3812. doi: 10.1021/acs.jproteome.6b00583
6. Liu X, Wang Y, Gao R, Xing Y, Li X, Wang Z. Serum metabolomic response to exercise training in spontaneously hypertensive rats. J Am Soc Hypertens. 2017;11:428–436. doi: 10.1016/j.jash.2017.05.003
7. James EL, Parkinson EK. Serum metabolomics in animal models and human disease. Curr Opin Clin Nutr Metab Care. 2015;18:478–483. doi: 10.1097/MCO.0000000000000200
8. Jiye A, Huang Q, Wang G, Zha W, Yan B, Ren H, Gu S, Zhang Y, Zhang Q, Shao F, et al. Global analysis of metabolites in rat and human urine based on gas chromatography/time-of-flight mass spectrometry. Anal Biochem. 2008;379:20–26. doi: 10.1016/j.ab.2008.04.025
9. Tzoulaki I, Iliou A, Mikros E, Elliott P. An Overview of Metabolic Phenotyp-ing in Blood Pressure Research. Curr Hypertens Rep. 2018;20:78. doi: 10.1007/s11906-018-0877-8
10. Nikolic SB, Sharman JE, Adams MJ, Edwards LM. Metabolomics in hypertension. J Hypertens. 2014;32:1159–1169. doi: 10.1097/HJH. 0000000000000168
11. Kulkarni H, Meikle PJ, Mamtani M, Weir JM, Barlow CK, Jowett JB, Bellis C, Dyer TD, Johnson MP, Rainwater DL, et al. Plasma lipi-domic profile signature of hypertension in Mexican American families: specific role of diacylglycerols. Hypertension. 2013;62:621–626. doi: 10.1161/HYPERTENSIONAHA.113.01396
12. Zheng Y, Yu B, Alexander D, Mosley TH, Heiss G, Nettleton JA, Boerwinkle E. Metabolomics and incident hypertension among blacks: the atheroscle-rosis risk in communities study. Hypertension. 2013;62:398–403. doi: 10.1161/HYPERTENSIONAHA.113.01166
13. Menni C, Graham D, Kastenmüller G, Alharbi NH, Alsanosi SM, McBride M, Mangino M, Titcombe P, Shin SY, Psatha M, et al. Metabolo-mic identification of a novel pathway of blood pressure regulation involv-ing hexadecanedioate. Hypertension. 2015;66:422–429. doi: 10.1161/ HYPERTENSIONAHA.115.05544
14. Dietrich S, Floegel A, Weikert C, Prehn C, Adamski J, Pischon T, Boeing H, Drogan D. Identification of Serum Metabolites Associated With Incident Hypertension in the European Prospective Investigation into Can-cer and Nutrition-Potsdam Study. Hypertension. 2016;68:471–477. doi: 10.1161/HYPERTENSIONAHA.116.07292
15. Lind L, Fors N, Hall J, Marttala K, Stenborg A. A comparison of three dif-ferent methods to evaluate endothelium-dependent vasodilation in the elderly: the Prospective Investigation of the Vasculature in Uppsala Seniors (PIVUS) study. Arterioscler Thromb Vasc Biol. 2005;25:2368–2375. doi: 10.1161/01.ATV.0000184769.22061.da
CLINICAL AND POPULATION
STUDIES - AL
16. Hiltunen TP, Rimpelä JM, Mohney RP, Stirdivant SM, Kontula KK. Effects of four different antihypertensive drugs on plasma metabolomic profiles in patients with essential hypertension. PLoS One. 2017;12:e0187729. doi: 10.1371/journal.pone.0187729
17. Hedstrand H. A study of middle-aged men with particular reference to risk factors for cardiovascular disease. Ups J Med Sci Suppl. 1975;19:1–61. 18. Larsson A, Malm J, Grubb A, Hansson LO. Calculation of glomerular filtration
rate expressed in mL/min from plasma cystatin C values in mg/L. Scand J Clin Lab Invest. 2004;64:25–30. doi: 10.1080/00365510410003723 19. Tobin MD, Sheehan NA, Scurrah KJ, Burton PR. Adjusting for treatment
effects in studies of quantitative traits: antihypertensive therapy and systolic blood pressure. Stat Med. 2005;24:2911–2935. doi: 10.1002/sim.2165 20. Lytsy P, Lind L, Sundström J. Endothelial function and risk of
hyperten-sion and blood pressure progreshyperten-sion: the prospective investigation of the vasculature in Uppsala seniors. J Hypertens. 2013;31:936–939. doi: 10.1097/HJH.0b013e32835ed5a0
21. Lytsy P, Ingelsson E, Lind L, Arnlöv J, Sundström J. Interplay of over-weight and insulin resistance on hypertension development. J Hypertens. 2014;32:834–839. doi: 10.1097/HJH.0000000000000081
22. Nishimura RA, Otto CM, Bonow RO, Carabello BA, Erwin JP III, Fleisher LA, Jneid H, Mack MJ, McLeod CJ, O’Gara PT, et al. 2017 AHA/ACC Focused Update of the 2014 AHA/ACC Guideline for the Management of Patients With Valvular Heart Disease: A Report of the American College of Cardiol-ogy/American Heart Association Task Force on Clinical Practice Guidelines. J Am Coll Cardiol. 2017;70:252–289. doi: 10.1016/j.jacc.2017.03.011 23. Kamlage B, Maldonado SG, Bethan B, Peter E, Schmitz O, Liebenberg V,
Schatz P. Quality markers addressing preanalytical variations of blood and plasma processing identified by broad and targeted metabolite profiling. Clin Chem. 2014;60:399–412. doi: 10.1373/clinchem.2013.211979 24. Wagner-Golbs A, Neuber S, Kamlage B, Christiansen N, Bethan B,
Rennefahrt U, Schatz P, Lind L. Effects of long-term storage at -80 degrees c on the human plasma metabolome. Metabolites. 2019;9:99. doi: 10.3390/ metabo9050099
25. Kamlage B, Neuber S, Bethan B, Gonzalez Maldonado S, Wagner-Golbs A, Peter E, Schmitz O, Schatz P. Impact of prolonged blood incubation and extended serum storage at room temperature on the human serum metabo-lome. Metabolites. 2018;8:6
26. Fall T, Salihovic S, Brandmaier S, Nowak C, Ganna A, Gustafsson S, Broeckling CD, Prenni JE, Kastenmüller G, Peters A, et al. Non-targeted metabolomics combined with genetic analyses identifies bile acid synthesis and phospholipid metabolism as being associated with incident type 2 diabe-tes. Diabetologia. 2016;59:2114–2124. doi: 10.1007/s00125-016-4041-1 27. Nowak C, Salihovic S, Ganna A, Brandmaier S, Tukiainen T, Broeckling CD,
Magnusson PK, Prenni JE, Wang-Sattler R, Peters A, et al. Effect of Insulin Resistance on Monounsaturated Fatty Acid Levels: A Multi-cohort Non-targeted Metabolomics and Mendelian Randomization Study. PLoS Genet. 2016;12:e1006379. doi: 10.1371/journal.pgen.1006379
28. Smith CA, Want EJ, O’Maille G, Abagyan R, Siuzdak G. XCMS: process-ing mass spectrometry data for metabolite profilprocess-ing usprocess-ing nonlinear peak alignment, matching, and identification. Anal Chem. 2006;78:779–787. doi: 10.1021/ac051437y
29. Sumner LW, Amberg A, Barrett D, Beale MH, Beger R, Daykin CA, Fan TW, Fiehn O, Goodacre R, Griffin JL, et al. Proposed minimum reporting stan-dards for chemical analysis Chemical Analysis Working Group (CAWG) Metabolomics Standards Initiative (MSI). Metabolomics. 2007;3:211–221. doi: 10.1007/s11306-007-0082-2
30. Laird NM, Ware JH. Random-effects models for longitudinal data. Biomet-rics. 1982;38:963–974.
31. Bruyndonckx R, Hens N, Aerts M. Simulation-based evaluation of the linear-mixed model in the presence of an increasing proportion of singletons. Biom J. 2018;60:49–65. doi: 10.1002/bimj.201700025
32. Benjamini Yoav HY. Controlling the false discovery rate: A practical and powerful approach to multiple testing. Journal of the Royal Statistical Society. Series B (Methodological). 1995;57(1):12
33. Harrell FE. Regression modeling strategies: With applications to linear models, logistic regression, and survival analysis. New York: Springer; 2001. 34. Greenland S, Pearl J, Robins JM. Causal diagrams for epidemiologic
research. Epidemiology. 1999;10:37–48.
35. Textor J, van der Zander B, Gilthorpe MS, Liskiewicz M, Ellison GT. Robust causal inference using directed acyclic graphs: the R package ‘dagitty’. Int J Epidemiol. 2016;45:1887–1894. doi: 10.1093/ije/dyw341
36. Sundström J, Sullivan L, D’Agostino RB, Levy D, Kannel WB, Vasan RS. Relations of serum uric acid to longitudinal blood pressure
tracking and hypertension incidence. Hypertension. 2005;45:28–33. doi: 10.1161/01.HYP.0000150784.92944.9a
37. Nickenig G. Central role of the AT(1)-receptor in atherosclerosis. J Hum Hypertens. 2002;16(Suppl 3):S26–S33. doi: 10.1038/sj.jhh.1001436 38. Graessler J, Schwudke D, Schwarz PE, Herzog R, Shevchenko A,
Bornstein SR. Top-down lipidomics reveals ether lipid deficiency in blood plasma of hypertensive patients. PLoS One. 2009;4:e6261. doi: 10.1371/journal. pone.0006261
39. Halperin RO, Sesso HD, Ma J, Buring JE, Stampfer MJ, Gaziano JM. Dyslipidemia and the risk of incident hypertension in men. Hypertension. 2006;47:45–50. doi: 10.1161/01.HYP.0000196306.42418.0e 40. Allemann Y, Horber FF, Colombo M, Ferrari P, Shaw S, Jaeger P, Weidmann P.
Insulin sensitivity and body fat distribution in normotensive offspring of hypertensive parents. Lancet. 1993;341:327–331. doi: 10.1016/0140- 6736(93)90135-4
41. Ferrari P, Weidmann P, Shaw S, Giachino D, Riesen W, Allemann Y, Heynen G. Altered insulin sensitivity, hyperinsulinemia, and dyslipidemia in individuals with a hypertensive parent. Am J Med. 1991;91:589–596. doi: 10.1016/0002-9343(91)90211-f
42. Yanai H, Tomono Y, Ito K, Furutani N, Yoshida H, Tada N. The underlying mechanisms for development of hypertension in the metabolic syndrome. Nutr J. 2008;7:10. doi: 10.1186/1475-2891-7-10
43. Fahy E, Subramaniam S, Brown HA, Glass CK, Merrill AH Jr, Murphy RC, Raetz CR, Russell DW, Seyama Y, Shaw W, et al. A compre-hensive classification system for lipids. J Lipid Res. 2005;46:839–861. doi: 10.1194/jlr.E400004-JLR200
44. Fahy E, Subramaniam S, Murphy RC, Nishijima M, Raetz CR, Shimizu T, Spener F, van Meer G, Wakelam MJ, Dennis EA. Update of the LIPID MAPS comprehensive classification system for lipids. J Lipid Res. 2009;50(Suppl) :S9–14. doi: 10.1194/jlr.R800095-JLR200
45. Pocock SJ, Bakris G, Bhatt DL, Brar S, Fahy M, Gersh BJ. Regres-sion to the Mean in SYMPLICITY HTN-3: Implications for Design and Reporting of Future Trials. J Am Coll Cardiol. 2016;68:2016–2025. doi: 10.1016/j.jacc.2016.07.775
46. Moore MN, Atkins ER, Salam A, Callisaya ML, Hare JL, Marwick TH, Nelson MR, Wright L, Sharman JE, Rodgers A. Regression to the mean of repeated ambulatory blood pressure monitoring in five studies. J Hypertens. 2019;37:24–29. doi: 10.1097/HJH.0000000000001977
47. Howard JP, Cole GD, Sievert H, Bhatt DL, Papademetriou V, Kandzari DE, Davies JE, Francis DP. Unintentional overestimation of an expected antihy-pertensive effect in drug and device trials: mechanisms and solutions. Int J Cardiol. 2014;172:29–35. doi: 10.1016/j.ijcard.2013.12.183
48. Spijkers LJ, van den Akker RF, Janssen BJ, Debets JJ, De Mey JG, Stroes ES, van den Born BJ, Wijesinghe DS, Chalfant CE, MacAleese L, et al. Hypertension is associated with marked alterations in sphingolipid biology: a potential role for ceramide. PLoS One. 2011;6:e21817. doi: 10.1371/journal.pone.0021817
49. Wang DD, Toledo E, Hruby A, Rosner BA, Willett WC, Sun Q, Razquin C, Zheng Y, Ruiz-Canela M, Guasch-Ferré M, et al. Plasma Ceramides, Medi-terranean Diet, and Incident Cardiovascular Disease in the PREDIMED Trial (Prevención con Dieta Mediterránea). Circulation. 2017;135:2028–2040. doi: 10.1161/CIRCULATIONAHA.116.024261
50. Fenger M, Linneberg A, Jørgensen T, Madsbad S, Søbye K, Eugen-Olsen J, Jeppesen J. Genetics of the ceramide/sphingosine-1-phosphate rheostat in blood pressure regulation and hypertension. BMC Genet. 2011;12:44. doi: 10.1186/1471-2156-12-44
51. Yogi A, Callera GE, Aranha AB, Antunes TT, Graham D, McBride M, Dominiczak A, Touyz RM. Sphingosine-1-phosphate-induced inflammation involves receptor tyrosine kinase transactivation in vascular cells: upregu-lation in hypertension. Hypertension. 2011;57:809–818. doi: 10.1161/ HYPERTENSIONAHA.110.162719
52. Jiang XC, Goldberg IJ, Park TS. Sphingolipids and cardiovascular diseases: lipoprotein metabolism, atherosclerosis and cardiomyopathy. Adv Exp Med Biol. 2011;721:19–39. doi: 10.1007/978-1-4614-0650-1_2
53. Spijkers LJ, Janssen BJ, Nelissen J, Meens MJ, Wijesinghe D, Chalfant CE, De Mey JG, Alewijnse AE, Peters SL. Antihypertensive treatment differ-entially affects vascular sphingolipid biology in spontaneously hypertensive rats. PLoS One. 2011;6:e29222. doi: 10.1371/journal.pone.0029222 54. Frangioudakis G, Diakanastasis B, Liao BQ, Saville JT, Hoffman NJ,
Mitchell TW, Schmitz-Peiffer C. Ceramide accumulation in L6 skeletal muscle cells due to increased activity of ceramide synthase isoforms has opposing effects on insulin action to those caused by palmitate treatment. Diabetologia. 2013;56:2697–2701. doi: 10.1007/s00125- 013-3035-5
CLINICAL AND POPULATION
STUDIES - AL
55. Frangioudakis G, Garrard J, Raddatz K, Nadler JL, Mitchell TW, Schmitz- Peiffer C. Saturated- and n-6 polyunsaturated-fat diets each induce ceramide accumulation in mouse skeletal muscle: reversal and improve-ment of glucose tolerance by lipid metabolism inhibitors. Endocrinology. 2010;151:4187–4196. doi: 10.1210/en.2010-0250
56. Sung KC, Lim S, Rosenson RS. Hyperinsulinemia and homeostasis model assessment of insulin resistance as predictors of hypertension: a 5-year follow-up study of Korean sample. Am J Hypertens. 2011;24:1041–1045. doi: 10.1038/ajh.2011.89
57. Zhou MS, Wang A, Yu H. Link between insulin resistance and hyperten-sion: What is the evidence from evolutionary biology? Diabetol Metab Syndr. 2014;6:12. doi: 10.1186/1758-5996-6-12
58. Skarfors ET, Lithell HO, Selinus I. Risk factors for the development of hyper-tension: a 10-year longitudinal study in middle-aged men. J Hypertens. 1991;9:217–223. doi: 10.1097/00004872-199103000-00004 59. Haffner SM, Miettinen H, Gaskill SP, Stern MP. Metabolic
precur-sors of hypertension. The San Antonio Heart Study. Arch Intern Med. 1996;156:1994–2001.
60. Sinaiko AR, Steinberger J, Moran A, Hong CP, Prineas RJ, Jacobs DR Jr. Influence of insulin resistance and body mass index at age 13 on systolic blood pressure, triglycerides, and high-density lipo-protein cholesterol at age 19. Hypertension. 2006;48:730–736. doi: 10.1161/01.HYP.0000237863.24000.50
61. Ormazabal V, Nair S, Elfeky O, Aguayo C, Salomon C, Zuñiga FA. Association between insulin resistance and the development of car-diovascular disease. Cardiovasc Diabetol. 2018;17:122. doi: 10.1186/s12933- 018-0762-4
62. Greene EL, Lu G, Zhang D, Egan BM. Signaling events mediat-ing the additive effects of oleic acid and angiotensin II on vascular smooth muscle cell migration. Hypertension. 2001;37:308–312. doi: 10.1161/01.hyp.37.2.308
63. Liu Y, Chen T, Qiu Y, Cheng Y, Cao Y, Zhao A, Jia W. An ultrasonication-assisted extraction and derivatization protocol for GC/TOFMS-based metabolite profiling. Anal Bioanal Chem. 2011;400:1405–1417. doi: 10.1007/s00216-011-4880-z
64. Kim SR, Jeon SY, Lee SM. The association of cardiovascular risk factors with saturated fatty acids and fatty acid desaturase indices in erythro-cyte in middle-aged Korean adults. Lipids Health Dis. 2015;14:133. doi: 10.1186/s12944-015-0135-x
65. Yang M, Yu Z, Deng S, Chen X, Chen L, Guo Z, Zheng H, Chen L, Cai D, Wen B, et al. A Targeted Metabolomics MRM-MS Study on Identifying Potential Hypertension Biomarkers in Human Plasma and Evaluating Acu-puncture Effects. Sci Rep. 2016;6:25871. doi: 10.1038/srep25871 66. Gremmels H, Bevers LM, Fledderus JO, Braam B, van Zonneveld AJ,
Verhaar MC, Joles JA. Oleic acid increases mitochondrial reactive oxygen species production and decreases endothelial nitric oxide synthase activ-ity in cultured endothelial cells. Eur J Pharmacol. 2015;751:67–72. doi: 10.1016/j.ejphar.2015.01.005
67. Yang Q, Alemany R, Casas J, Kitajka K, Lanier SM, Escribá PV. Influence of the membrane lipid structure on signal processing via G protein-coupled recep-tors. Mol Pharmacol. 2005;68:210–217. doi: 10.1124/mol.105.011692 68. Funari SS, Barceló F, Escribá PV. Effects of oleic acid and its
conge-ners, elaidic and stearic acids, on the structural properties of phospha-tidylethanolamine membranes. J Lipid Res. 2003;44:567–575. doi: 10.1194/jlr.M200356-JLR200
69. Information. NCfB. 17:0 cholesteryl ester, cid=24779605. PubChem Database. Accessed August 8, 2019. https://pubchem.ncbi.nlm.nih.gov/ compound/17_0-Cholesteryl-ester.
70. Ghosh S, Zhao B, Bie J, Song J. Macrophage cholesteryl ester mobi-lization and atherosclerosis. Vascul Pharmacol. 2010;52:1–10. doi: 10.1016/j.vph.2009.10.002
71. van Popele NM, Grobbee DE, Bots ML, Asmar R, Topouchian J, Reneman RS, Hoeks AP, van der Kuip DA, Hofman A, Witteman JC. Asso-ciation between arterial stiffness and atherosclerosis: the Rotterdam Study. Stroke. 2001;32:454–460. doi: 10.1161/01.str.32.2.454
72. Gavish B, Izzo JL Jr. Arterial Stiffness: Going a Step Beyond. Am J Hyper-tens. 2016;29:1223–1233. doi: 10.1093/ajh/hpw061
73. Hu C, Kong H, Qu F, Li Y, Yu Z, Gao P, Peng S, Xu G. Application of plasma lipidomics in studying the response of patients with essential hypertension to antihypertensive drug therapy. Mol Biosyst. 2011;7:3271–3279. doi: 10.1039/c1mb05342f