Egoistic vs. Altruistic
Incentives in
Promoting Growth
- From Developing Nation‟s Perspective
Subject: BACHELOR THESIS IN ECONOMICS
Authors: Mikaela Jerenvik, 860408-5061
Zandra Belstad, 841024-8903 Head Supervisor: Professor Börje Johansson Deputy Supervisor: Ph. D. Candidate James Dzansi
Date: Jönköping, June 2010
J
ÖNKÖPING
I
NTERNATIONAL
B
USINESS
S
CHOOL
Bachelor’s Thesis in Economics
Title: Egoistic vs. Altruistic Incentives in Promoting Growth – From Developing Nations‟ Perspective.
Authors: Mikaela Jerenvik and Zandra Belstad
Head Supervisor: Professor Börje Johansson Deputy Supervisor: Ph. D. Candidate James Dzansi
Date: Jönköping, June 2010
Jönköping International Business School
Abstract
Developing countries are dependent upon foreign capital since they lack adequate domestic means to save and invest in order to grow and develop. This thesis aims to evaluate the role of foreign capital inflows in enhancing economic growth in a sample of 90 developing countries between the years 1991 and 2006. Even though FDI is recognized as the most attractive key in economic development strategies, numerous international help organizations call for increased ODA flows since many developing countries do not seem to benefit from FDI. This study will closely look into the issue where FDI and ODA are incorporated into the same model to identify the different effects they bring upon economic growth. Is capital given by the altruistic intention to assist developing nations in the form of ODA more beneficial than capital given through FDI by Multi-National Corporations (MNC) with their egoistic profit-seeking incentives, in the matter of enhancing economic growth? The obtained results from our cross-sectional OLS-regression are coherent with previous studies where FDI promotes economic growth, while ODA has a negative impact. This implies that FDI do actually play a more important role in developing countries than ODA in increasing growth in GDP per capita.
Keywords: Economic growth; Foreign Direct Investment; Official Development Assistance; developing countries; economic development
1
Contents
1 INTRODUCTION ... 4 1.1 Introduction ... 4 1.2 Purpose ... 4 1.3 Methodology ... 5 1.4 Limitations ... 5 1.5 Outline ... 5 2 THEORETICAL FRAMEWORK ... 52.1 Foreign Capital Inflows‟ impact on Economic growth ... 5
2.2 Growth Theory ... 6
2.3 Literature Review of Foreign Capital Inflows ... 8
2.3.1 Foreign Direct Investment ... 8
2.3.2 Official Development Assistance ... 11
3 METHODOLOGY & DATA... 14
3.1 Global Trends of Foreign Capital Inflows ... 14
3.2 Definition of Variables ... 16
3.3 Regression analysis... 18
3.3.1 Regression results ... 19
4 DISCUSSION ... 21
5 CONCLUSIONS ... 23
6 RECOMMENDATIONS FOR FURTHER RESEARCH ... 24
7 REFERENCES ... 25
2
Figures
Figure 1. Poverty Trap ... 6
Figure 2. Solow Growth Model: Effects of Increased Savings ... 7
Figure 3. Achievement of 0.7% Target ... 12
Figure 4. Net ODA disbursements ... 15
Figure 5. Total Net Foreign Capital Inflows by type of flow, 1990 – 2005 ... 15
Figure 6. FCI and Growth Trends in Developing Countries in per capita values ... 16
Tables
Table 1. Contingency Table: FDI - GDP ... 17Table 2. Contingency Table: ODA - GDP ... 17
Table 3. Dependent Variable: GDP per capita growth 1991 - 2006 ... 19
Table 4. Dependent Variable: GDP per capita growth 1991 – 1998 ... 20
3
List of abbreviations
DAC Development Assistance Committee
FCI Foreign Capital Inflows
FDI Foreign Direct Investment
GDP Gross Domestic Product
GFCF Gross Fixed Capital Formation
GNI Gross National Income
IMF International Monetary Fund
LDC Least Developed Countries
M&A Mergers and Acquisitions
MDG Millennium Development Goals
MNC Multinational Corporations
ODA Official Development Assistance
OECD Organization for Economic Co-Operation and Development
OLS Ordinary Least Squares
R&D Research and Development
TFP Total Factor Productivity
UN United Nations
UNCTAD United Nations Conference on Trade and Development
4
1 INTRODUCTION
1.1 Introduction
The fight against extreme poverty and how to achieve the Millennium Development Goals are regular topics on the global community‟s agenda and sustained growth is identified as the necessary condition in spurring development for the poor countries. However, underdevelopment is perpetuated of vicious circles that prevent economies from growing; low productivity levels leading to low income per capita levels which leaves no available funds to invest in new capital and improve productivity. Economic development is an extremely complex issue and there is no universal formula to solve the issue of why some countries continually grow while others remain poor.
Economists and policymakers argue that investment is the key to economic growth and development. Unfortunately, herein originates the problem for poor countries. Due to their low propensity to save, hence invest, they are dependent upon the inflow of foreign capital to fill their financial and economic gaps. Capital has been flowing from rich to poor nations for centuries and the research about its importance and efficiency remains contentious and the issue needs to be frequently evaluated.
Even though Foreign Direct Investment (FDI) has been recognized as the single most important form of capital inflow for developing countries, the majority of FDI is allocated to only a few developing countries while others, especially Least Developed Countries (LDC), seem to be left outside with only a fraction of FDI as foreign capital inflow. This makes them instead dependent upon other sources of foreign capital such as Official Development Assistance (ODA). It is often expressed that aid is not a helpful measure for the poor. However, global help-organizations continue to push for even more aid, since for the poorest of the poor it remains the outmost important source of foreign capital and is critical in their achievement of the MDGs.
The research in the area of both forms of foreign capital is extensive with various pros and cons from respected researchers on each side. Both inflows are directed at investments and capacity building in developing communities, but what kind of foreign capital is really giving the desired results? Perhaps both forms of capital are necessary but at different stages? Furthermore, is it possible that the situation of foreign capital allocation has evolved into a decision making activity where FDI is picking the winners and ODA is picking the losers?
1.2 Purpose
This thesis analyzes the role of Foreign Capital Inflows in promoting economic growth in the developing world. In particular it investigates the impacts of the two major sources of FCI namely Foreign Direct Investment and Official Development Assistance on GDP per capita growth in a sample of developing countries. Consequently, this study aims to determine what kind of external capital these countries enjoy the highest effect in GDP per capita growth from. Therefore, this thesis sets out to answer the following question – is capital given by the
altruistic intention to assist developing nations in the form of ODA more beneficial in promoting economic growth than capital given through FDI by Multi-National Corporations (MNC) with their egoistic profit-seeking incentives?
5
1.3 Methodology
The literature regarding the impacts of Foreign Capital Inflows on economic growth in developing countries is extensive. However, we noticed a lack of studies that analyse both FDI and ODA in the same model, hence comparing their impact within the same setting. Since FDI and ODA are the two major sources of external capital we believe such a comparison is necessary. Scholarly discussions and research will be reviewed and an empirical analysis, using Ordinary Least Squares (OLS) as the econometric regression technique, will be carried out in order to achieve this.
1.4 Limitations
The world‟s economies are complex in their own specific nature and each of them needs specific remedies when they are ill. Consequently, it is extremely difficult to take all possible factors affecting economic growth into consideration in one single paper. Our initial objective was to include variables for other indicators, such as trade, economic freedom, human capital, technology, economic stability, savings and consumption, but many countries lacked sufficient data so we chose to exclude these variables to make our sample as large as possible. The purpose of this thesis is thus limited to only analyze the impacts on the economic growth of the receipt country from the two major sources of international financial flows; FDI and ODA. However, we are aware of that economic growth occurs due to several factors in an economy and not solely because of inflow of foreign capital. It is not our intention to solve the complex issue of global development and determine what policies and panaceas that will ultimately eradicate poverty, only to supplement the existing research for further clarity in the policy making for both developing and developed nations.
1.5 Outline
The first section is an introduction of this paper along with its purpose, limitations and a brief explanation of its contents. The following section brings forward a discussion about the theoretical background information concerning growth theories and Foreign Capital Inflows in line with various scholars‟ opinions and findings. In the third section we will present our empirical analysis and results, which subsequently are discussed in the fourth section. Finally, in the last two sections one can find our conclusions and recommendations for further research.
2 THEORETICAL FRAMEWORK
In this section the importance of economic growth is presented and the most essential theories of why economies grow and develop are identified. Moreover, FDI and ODA are thoroughly examined and discussed along with their association to economic growth.
2.1 Foreign Capital Inflows’ impact on Economic growth
Capital has long been argued by neo-classical economists to be the main engine of growth, with capital accumulation as the key element. It will bring about higher productivity and efficiency and hence economic growth. Unfortunately, developing countries suffer from inadequate means to investment in capital. This leads to the general perception that vicious circles of poverty are perpetuated by lack of capital, see figure 1. One way to break the circles is by raising national savings and thereby increasing the capital stock which will lead to enhanced productivity and improved livelihoods. In order to increase savings, higher income is essential. Therefore, higher income through the inflow of foreign capital such as FDI and ODA could lead to higher savings and capital growth hence a step out of the poverty trap (Sachs, 2005).
6 Figure 1. Poverty Trap
Chenery and Strout (1966) developed a two-gap approach for the role of FCI; the financing gap between domestic savings and required investments, and the gap between imports and exports, referred to as the foreign exchange gap. Onyemelukwe (2005) later extended this model and included two additional gaps that foreign capital can potentially fill, focusing especially on FDI. He argued that FDI can fill the gap between targeted government tax revenues and locally raised taxes. Thus, by taxing MNC profits and participating financially in their local operations, poor countries can mobilize public financial resources for other development projects. The other gap is between management and technology skills, transferred from MNCs to local companies through learning by doing and imitation techniques. The latter gap is also attributable to ODA projects which bring advancements in both technology and human capital. By filling these gaps by foreign capital inflows as complement to domestic resources, developing nations can enjoy economic growth and hence the possibility to develop into a healthy and sustainable economy.
2.2 Growth Theory
Economic growth has been an area of study for economists over many decades and one of the first to study development economics was Adam Smith. He outlined that by increasing the inputs of labor, the productivity capacity and economic growth will be enhanced. Ricardo later developed a theory of comparative advantages and specialization, implying that successful international production should be allocated where most productive (Case, 1999). This hypothesis was elaborated further by Heckscher-Ohlin, by linking comparative advantages to factor endowments in order to fully utilize countries relative abundance of input factors in production. In the mid 1940‟s Harrod and Domar developed a model in where a nation‟s growth rate is determined by the savings rate and the capital-output ratio. Hence, in order to achieve economic growth, the nation must save and invest a significant proportion of their GDP. The difference between required investments and domestic savings is called the
financing gap and since developing countries are assumed to not be able to fill this gap
themselves, they are dependent upon foreign capital inflows in terms of FDI or ODA. This model has been widely criticised, but it is still used by IMF and the World Bank to measure foreign resource requirements to allocate aid efficiently. Solow questioned Harrod and Domar‟s model of fixed proportions in input-factors and therefore extended their model into a new theory where savings and investments still were the basics to achieve economic progress, but also included the important aspect of factor productivity. Furthermore, the Solow model states that high savings are equal to a large capital stock and output and the other way around; low savings leads to diminutive capital stock and output (Mankiw, 2003). This makes the Solow model an appropriate method for our thesis and we will now further explicate it.
7
y = Output per capita k = Capital per capita s = Savings rate
n = Population growth rate d = Depreciation rate Solow Growth Model
Neo-classical theory of economic growth incorporates the idea of a process of convergence. This means that if all countries had the same technology, savings rate and population growth all will end up at the same growth rates in the long run. Solow‟s hypothesis thus provides the possibility of catching up for developing nations, and the model remains the justification for aid and investment flows to the less developed countries in order to direct them towards their steady state. Solow argues that poor countries will experience more rapid economic growth than developed economies since they have lower capital stocks per capita which imply higher rates of return.
Solow’s exogenous production function:
In Solow‟s production function, displayed in equation (2.1), is output a function of inputs in production where L represents labor, K equals capital and A corresponds to the current level of technology in the country. Solow argued that any changes in A represent the Total Factor Productivity (TFP) which corresponds to the change in output that cannot be explained by changes in labor and capital. Hence, a higher A means higher output, but it is not determined within the model and only an exogenous factor of production. TFP can grow for various reasons, such as increased knowledge, innovation, or government policies, thus anything that changes the relation between measured inputs and outputs (Mankiw, 2003). When a nation reaches its steady state it will not experience further growth if it does not introduce new technology leading to increased productivity. In this thesis ODA and FDI are incorporated into the Solow model since both flows contribute to all factors of production. Not only by the direct transfer of additional funds but also through enhanced technology and human capital which promote higher TFP.
.
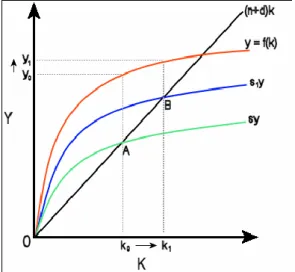
Figure 2. Solow Growth Model: Effects of Increased Savings
The underlying assumptions of the Solow model are constant returns to scale and diminishing returns to capital, which implies that a country will eventually reach a steady-state where output and capital grows only along with the population rate. This is represented by the flattening of the curve y=f(K). In figure 2 Solow‟s theory of why savings increase output is illustrated. If a country manages to save and invest more than capital depreciates the nation will experience capital accumulation. Consequently, savings rates below the rate of depreciation will lead to a decline in the capital stock. Moreover, the savings rate must exceed
8
the growth in population in order to experience a growth per capita (Sachs, 2005). Therefore, the line (n+d)k accounts for both the population growth rate and depreciation rate in order to obtain the true level of necessary savings. Thus, when the savings rate intersects with this line, the nation has reached its steady-state, illustrated by point A in the graph. At this point, the output per capita is Y1. If the nation manages to raise its level of savings, sy,will shift
upwards to s1y, where it exceeds the depreciation rate and there will be capital accumulation
and increased output. This process continues until a new steady state is reached, illustrated by point B. Consequently, the output is higher after increased savings. However, although savings clearly bring increases in output, this is only an increase in the level of output, hence not affecting the growth rate due to a temporary increase before ending up in a new steady state. Nevertheless, even though the long-run growth rate is not affected, the output per capita is increased and the economy is better off (Barro & Sala-i-Martin, 2004).
Growth Accounting
A central part of economic theory is the growth accounting equation, a technique developed by Solow in 1957 in order to in detail examine the individual contribution of each of the factors of production in explaining economic growth (Clunies-Ross, 2009). The growth rate of Gross Domestic Product (GDP) is broken down into different components associated with changes in factor inputs; capital and labor. The growth in output is thus illustrated by the weighted average of the growth rates of inputs (Mankiw, 2003, Barro & Sala-i-Martin, 2004).
Solow’s Growth Accounting production function:
The first factor on the right-hand side in equation (2.2) represents capital‟s contribution to economic growth where α equals capital‟s share of total output. The second factor is hence labour‟s contribution to growth and labour‟s share of output is illustrated by (1- α) in the equation. Furthermore, output is influenced by the current level of technology in the country, represented by the third factor in the growth accounting equation. Moreover, in addition to the key conditioning variables in explaining economic growth the model can also display the contribution of various shift variables, such as openness to trade, education, political freedom etc. (Rao & Rao, 2005). In our thesis we want to know the contribution and effect of Foreign Capital Inflows. Consequently, we use FDI and ODA as shift variables, since they affect all the key variables of inputs in the production function through not only higher propensity to save and invest but also through the transfer of new technology as well as improved human capital.
2.3 Literature Review of Foreign Capital Inflows
Following section will provide fundamental background information about Foreign Capital Inflows and their impact on economic growth according to previous scholarly findings. 2.3.1 Foreign Direct Investment
Foreign Direct Investments do not only contribute with additional capital but is also an important source of technology transfer and advancements. Through new innovation stronger capacity building becomes plausible. Due to these characteristics, FDI is argued to contribute even more to economic growth than domestic investments (Borensztein et. al., 1997).
9 Definition
The International Monetary Fund‟s report Balance of Payment 5th Edition and the
Organization for Economic Co-operation and Development‟s (OECD) Benchmark definition
of Foreign Direct Investment, define Foreign Direct Investment as „an international investment that reflects the objective of a resident entity in one economy obtaining a lasting interest in an enterprise or project in another economy’ (IMF, 1993, OECD, 1999). The
aspect of lasting interest signifies a long-term relationship between the direct investor and the targeted enterprise outside the home-economy. Furthermore, the definition of FDI includes the presence of a significant degree of influence by the direct investor on the management of the enterprise. OECD and IMF recommend that an ownership of 10 per cent or more of the ordinary shares or voting stock in the enterprise establish the existence of an efficient direct investment relationship, hence it does not require absolute control by the foreign investor. DeMello (1997) argued that the definition of FDI should be extended to include non-equity co-operation, where the foreign investor should supply the domestic enterprise with both tangible and intangible assets such as licensing, leasing, production-sharing agreements and R&D cooperation. FDI is argued to contribute more to the recipient country‟s economy and growth than other more pure financial investments such as portfolio investments, due to the managerial participation in the enterprise. Moreover, a direct investment is more difficult to liquidate and is therefore regarded as a deeper commitment of the MNC to the host country and hence makes FDI a less volatile investment opportunity (Clunies-Ross et al, 2009). Modes and determinants
Generally there are two different ways of investing in another country than your own, namely vertical and horizontal. Horizontal, or market-seeking, FDI takes place when there are high costs of exporting to foreign markets, such as transportation costs or trade barriers. By duplicating home country production in other countries these costs can be avoided. MNCs are also looking for efficiency when locating abroad. Since input prices are in general less expensive in developing countries, some stages in MNC‟s production chain will be outsourced to the most profitable locations. This type of direct investment is called vertical (Protsenko, 2003). Furthermore, entering a foreign market can be done in several ways. The most dominant entry mode of FDI in recent years is thorough the acquisition of an existing foreign firm, denoted as Mergers & Acquisitions or Brownfield investment, which are usually undertaken at the vertical level. Another choice is to make a Greenfield investment, where the investor constructs entire new facilities, more often at the horizontal level. Additionally, it is possible to enter a joint-venture project with a local enterprise where the MNC contribute with new techniques or innovation (Graham & Spaulding, 2005; Herzing et.al., 2008). Greenfield investment is mostly preferred by the host country since it increases the capital stock of the receiving country, while M&A is mostly preferred by MNCs since the costs of Greenfield investments are generally higher (Young-Han, 2009).
John Dunning (1980) developed an eclectic theory about the incentives and determinants of international investments, called the OLI-paradigm, which became the most widely used investment theory. Dunning divided the incentives for MNCs into three categories. First, the firm must have some kind of competitive Ownership-advantage in terms of a specific knowledge or technology. Secondly, MNC‟s choice is based on Location-advantages, meaning the best possible location according to the host country‟s characteristics, such as available infrastructure, trade policies and other social factors. In addition to this,
Internationalization of production is an attractive reason due to the presence of high
transaction costs and trade barriers between the home country and foreign markets (Dunning, 1980; 2008).
10 Previous Studies
Recent years of research have put FDI in central position of development strategies as a key to financing and is argued by policymakers and scholars all over the world to boost economic growth in poor nations. Due to its nature of being less volatile and providing more externalities than other capital flows, it has become the favorite capital inflow of developing countries (Ozturk, 2007) Some identified potential benefits that FDI brings are the direct effects of providing employment, immediate inflow of capital and integration into the global economy, but also long-term effects of knowledge and technology spill-over. Moreover, FDI is argued to improve local productivity in the host country, since it induces demand by the MNCs for local products as inputs which creates both forward- and backward linkages to local firms and generates a „crowding-in effect‟(Clunies-Ross et.al., 2009). Jones and Wren (2006) explored that FDI also has the indirect impact of increasing competition, since indigenous firms are forced to enhance efficiency in order to not get pushed out of the market. This can be done through local imitations of MNC‟s production techniques or through hiring MNC trained workers. Moreover, a study by Bosworth et. al. (1999) found that FDI enhances economic growth through increasing domestic savings and capital accumulation. The study also concludes, due to the finding of an almost one-to-one relationship between FDI and increase in domestic investment, that a majority of the resource transfer goes into new investments and not to consumption.
The numerous discussions and empirical studies over the last decades about FDI provide overall a potential positive relation between FDI and economic growth. However, it is far from being a consensus in the matter and the only consent detected is that the issue is far more complex than anyone seem to believe. Nonetheless, a comprehensive analysis of the impacts of FDI is very difficult, since MNCs come in many different shapes and host countries differ widely in the level of development, administrative capacity and political attitudes etc. Ozturk (2007) identified another near consensus in the literature about FDI dating back to 1986, that a country must have reached a minimum level of technology, education and infrastructure to enjoy the benefits that FDI provides. The majority of the scholars favor FDI as a growth-enhancing tool through multiple channels such as capital transformation and accumulation, technology and human capital in terms of knowledge and management spillovers. In addition, a majority concludes that there are certain policy requirements for attracting and benefiting from FDI. Hence, the discussion about the necessary requirements is immense. Nunnenkamp and Spatz (2003) mention factors such as the quality of local labor and institutional quality as crucial requirements for developing nations‟ capacity to absorb the benefits of FDI, while Hermes and Lensink (2003) and Alfaro et. al. (2004; 2009) argue that the capacity is limited by local financial markets and institutions and well-functional financial environments will make MNCs keener on investing. Additionally, the host country can maximize the benefits of FDI by reducing transactions costs and ensure the efficient allocation of capital where the projects yield the highest returns. DeMello (1997) emphasizes technological conditions in the receiving country as the most crucial prerequisite and argues that the larger the technological gap between the countries, the smaller contribution from FDI to economic growth. He further declares that technology and knowledge transfer brought forward by FDI will have long-lasting effects on economic development. However, even if technology is the outmost important aspect of FDI it is very hard to measure and quantify (DeMello, 1997). Moreover, Balasubramanyam et al. (1996) found trade openness and free market forces to be essential in acquiring positive growth effects of FDI. This incurs both international and domestic competition and thereby also foster investments in R&D and human capital. These findings were supported by Borensztein et. al. (1998) who found positive correlation between FDI and
11
economic growth exclusively in those countries with adequate human capital and qualified labor force.
Examining the relationship between FDI and economic growth on the microeconomic level show somewhat different results. Aitken and Harrison‟s (1999) study on the firm-level in a single developing country1, did not find any signs of positive technology spillovers from MNCs to natively owned firms. In contrast, Haskel et. al. (2002) found significant positive spillover effects, however only for developed countries. This finding supports the earlier stated hypothesis that a majority of the developing countries have not reached that minimum level of development to fully benefit from foreign investments.
Negative Aspects
Developing countries must in their quest for foreign investors also be aware of the potential harms upon their economy. Herzing et. al. (2008) identified that FDI may instead of increasing positive competition rather inflict closure of domestic production due to the forceful competition from stronger foreign enterprises. In addition, Onyemelukwe (2005) discuss further that foreign capital inflow may in fact lower domestic savings and investment rates by stifling domestic competition through exclusive agreements with host governments which inhibits the expansion of native enterprises. He further argues that FDI may divert already scarce resources from vital food production to the manufacturing of exclusive goods demanded only by the privileged parts of the population. Furthermore, UNCTAD reports that developing nations put too much focus on FDI and the support from foreign enterprises so the essentials of boosting self-sustainment and domestic investments are losing focus. In addition, OECD pronounces the concern that if the MNC‟s profits are repatriated instead of reinvested the host country‟s balance of payment will be adversely affected. Moreover, the potential long-term spillovers, argued to be generated by FDI upon the local communities, will not take place if the positive forward- and backward linkages to domestic enterprises and employment are absent. Moreover, the OECD has identified a general perception among host country governments that a great dependence upon foreign companies implies a threat to their political and economic sovereignty (Hill, 2004).
The correlation between FDI and economic growth remains elusive, since the majority of the developing countries will not be able to take advantage of the technologies or know-how transferred through FDI. DeMello (1997) argues that even though FDI is beneficial and growth enhancing in theory, real life empirics show somewhat different. Hence, due to the contradictory findings, OECD (2002) concluded in their evaluation of FDI that the benefits of FDI are indeed numerous, but unfortunately they are not guaranteed and do not happen automatically. In order to make a country more capable to enjoy the benefits from FDI the receiving country must provide an enabling business atmosphere where both domestic and foreign investments are encouraged as well as incentives for innovation and improvements in skills.
2.3.2 Official Development Assistance
ODA is argued by the critics to foster dependency much due to that corruption in developing countries with poor institutional quality is often mere reality. Consequently, this paper deals with the question regarding why major global organizations such as the IMF, World Bank, United Nations (UN) and the OECD countries continue to encourage increased donations of ODA.
12 Definition
The definition of ODA used in this thesis is founded on the Development Assistance Committee (DAC) and the OECD‟s description, where ODA is defined as flows of official financing and technical cooperation aimed to encourage sustainable development in developing countries. The flows are classified as ODA only if the receiving countries are on the Part I of the DAC list, generally the Least Developed Countries (LDC) and the countries included in this thesis. Furthermore, to be accounted as ODA the financial support must be undertaken by the official sector and requires a grant element of at least 25 percent of the total financial flow (OECD, 2003). The grant component represents transfers made in cash, goods and services for which the receiving country does not have to make any disbursements (Schabbel, 2007). ODA is generally divided into Bilateral and Multilateral flows. Bilateral flows occur when the aid are provided directly by the donor country to a developing country, while Multilateral aid are provided to the recipient country through an international organisation. In this thesis we ODA will represent both multilateral- and bilateral aid. Finally, it is important to underline that loans and grants for military objectives are not included in ODA.
Previous Studies
ODA‟s primary aim is to provide economic, financial and technical assistance to less-developed countries so they can help themselves out of poverty. In year 1970 the UN General Assembly signed the resolution International Development Strategy for the Second United
Nations Development Decade where the 0.7 percent target was voted through. The target
refers to the commitment of devoting 0.7% of rich countries gross national income (GNI) to ODA, which was further restated in the UN Millennium Development Project as a key factor in meeting the Millennium Development Goals by 2015. The UN expresses its confidence that such achievement encompasses a vital part of the progress in the fight against poverty. Although a substantial increase in ODA disbursement recent years, most donors are not on track to meet this 0.7 percent target (see figure 3) (UN, 2008).
Figure 3 Achievement of 0.7% Target. (Source: OECD, Development Statistics Online, 30 March 2009)
The scholarly literature describing ODA‟s impact on economic growth and development has gone through many phases during the past decades. The earlier economists described aid as an exogenous increase to the capital stock of the developing countries. The assumption that ODA has a positive effect on economic growth was logically accepted and not deeply investigated
13
before the 1960‟s. It was assumed by pro-aid economists such as Rostein-Rodan that for each dollar donated in the form of aid would result in an increase of one dollar in total savings and investments for the recipient country (Hansen & Tarp, 2000). Burnside and Dollar (2000) found a positive correlation between ODA and economic growth when incorporating an aid-policy interaction term in the regression, suggesting that ODA increases economic growth. However, the study concludes that the positive effect is conditional on the presence of good fiscal, monetary and trade policies. Hansen and Tarp (2000) also identified a positive relationship between aid and growth. Their findings confirm the results from Burnside and Dollar‟s study that growth is enhanced through increased investments and savings. Although, their findings are not dependent upon policy requirements.
Long-term progress in poverty alleviation is argued to depend on increases in total output, which is supported by Dollar and Kraay (2002). Their empirical analysis found that the bottom quintile representing the average income of the poorest 20% of the population increased proportionately with average incomes. This implies a strong correlation between the income of the poor and average incomes and hence not a trickle-down effect. Correspondingly, Papanek (1973) proved aid‟s positive correlation with growth according to his findings that aid has a larger significant impact on growth than domestic savings or any other foreign flows to LDC‟s. This finding was later reaffirmed by Mohey-ud-din (2006) through a country-study of Pakistan where ODA was found to have a stronger impact on economic growth than FDI.
Chenery and Carter (1973) examined the impact of ODA on the economic development performance of developing countries and based their studies on the two-gap approach (saving- and trade-gap) developed by Chenery and Strout in 1966, which puts forwards that ODA spur economic growth in recipient countries in the form of supplementary domestic capital (Pronk, 2001; Salisu, 2007). Furthermore, one of the most distinguished pro-aid activists, Jeffrey Sachs, encourages increased rates of ODA by underlining its achievement such as the green revolution, the global eradication of smallpox and the spread of literacy (Sachs, 2005). He strongly supports the 0.7 target as he is confident that developing countries need a „big push‟ out of poverty thus an entrance to the “Cycle of Prosperity”. With this financial assistance there will be a possibility to invest in education, healthcare, infrastructure and technology which will lead to an economic growth hence a decrease of poverty. Sachs argues that the effect on economic growth is not visible because there are not enough funds and therefore encourages the international community to increase their disbursements. To prove his argument Sachs founded in collaboration with the UN a small-scale project called the Millennium Villages. This project successfully demonstrates that when given the financial support, to invest in the previous mentioned sectors, poor nations can pull themselves out of poverty and develop into more sustainable economies. The World Bank reported a positive change in developing countries between 2000 and 2004 with observed improvements in global child mortality, life expectancy and literacy rates (World Bank, 2004). Furthermore, Dacy (1975) found that the effects of ODA on growth is dependent upon three factors; (1) the initial poverty rate in the receipt country, reflected on the domestic saving ratio, (2) additional increase of the government's consumption counted in percentage of received ODA and (3) the time period of aid donations. Dacy concludes that ODA almost always will contribute to increased income in a long-term perspective.
Negative Aspects
Numerous scholarly analyses on aid‟s effect upon economic growth are discouraging and show that ODA rather hinders development than fosters it. ODA has been criticised by a number of economists for being an incorrect method of spurring economic growth and fight
14
poverty in developing countries. Bauer (1981) argues that the donating countries do not have adequate knowledge about the most appropriate investment areas for the developing economy. Therefore, it is fairly common that ODA is devoted to defective projects in the receiving countries, left with the consequences of scarce resources and further failure in economic growth. The doubt regarding the inefficiency of aid allocation is shared by Schabbel (2007), who believes that improved coordination of ODA is essential before flows can be increased.
Another well-known economist who doubts ODA's positive effect on economic growth is William Easterly. He demonstrates that the rule of law, democracy and independent financial institutions are more important than ODA or any other financial inflow in order to enhance economic growth in developing countries (Easterly, 2001, 2003). Furthermore, the opponents to increased flow of ODA argue that it has adverse effects on corruption, meaning that government officials deliberately keep productivity low to continually receive aid (Knack, 2001; Easterly & Pfutze, 2008). Moreover, ODA is argued to stifle domestic economic activity by prioritizing donor projects or enterprises. However, there are ways to avoid this, according to Porter (2007). He emphasizes the importance of all nations to focus on improving incomes, jobs and distributing wealth more evenly in order to develop a viable and competitive economy, since sustainable macroeconomic, political and social conditions depend on a competitive environment. This implies that aid agencies must enhance their attention to competitiveness relative to any other agendas and base aid allocation on the receiving nation‟s assessments and not upon donor priorities.
3 METHODOLOGY & DATA
In this section we will present historical geographic patterns and developments of the allocation of Foreign Capital Inflows, both in general and in our sample group. In addition, here is our empirical analysis presented and explained along with our data set.
3.1 Global Trends of Foreign Capital Inflows
Even though cross-border investment has been on the MNCs agenda for centuries, FDI started to gain focus in the 1960s. In the early stages capital mostly flowed between developed countries, majorly from the USA to Europe. In the late 1980s FDI started to increase rapidly, and also developing nations began to attract foreign investors along with the general appreciation of FDI as an efficient tool in achieving economic development (Clunies-Ross et. al., 2009).
As mentioned previously in this study, countries have different capacities to attract FDI and the share of FDI to individual countries is vastly skewed. Flows are concentrated among a small numbers of countries, such as the emerging markets of Latin America and South Asia. In 2005 FDI inflows increased in all countries; however 17 out of 170 countries absorbed 86% of all FDI to developing nations. The main recipients were China, Singapore, Mexico and Brazil, which received 48% of total flows to developing nations. This thus implies that the report of an increased shared of FDI going into developing countries is misperceived. Sub-Saharan Africa have had difficulties in attracting foreign capital, due to the common perception of poor public services, high tax rates and closed trade regimes.
Figure 4 shows the aggregate ODA net disbursement from all DAC members from 1960 to 2008. It was not until the 1980‟s as the ODA started to increase and reached a high point during this decade. In year 2000 – when the Millennium Development Goals were adopted, an increase in ODA can be notified. This could demonstrate the dedication to the commitment of the MDG‟s by the member states (UNTDR, 2008). Furthermore, an interesting point of
15
observation is that the financial crisis that struck the world in the end of the 2000 did not have a negative effect on the disbursement of ODA.
Figure 4. Net ODA disbursements, current USD million dollars. (Source: OECD)
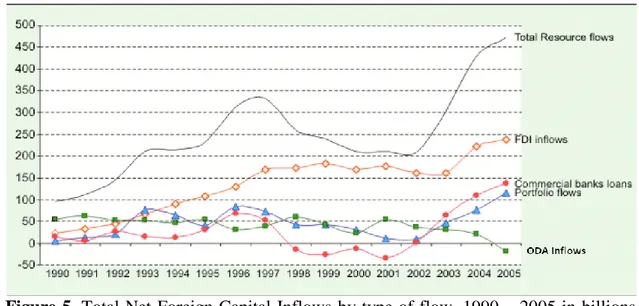
According to the OECD, ODA has ascended by 255 percent from 1960 to 2006 with a yearly increase of 2.8 percent. However, this raise is relatively small when put into comparison with FDI, which has increased by 2175 percent between 1970 and 2006 and an approximate yearly increase of 9 percent. The large increase in FDI in the early 90‟s can be interpreted as the emerging global interest of outsourcing to other more efficient locations than the home economy, and which gained further importance in the beginning of year 2000 and onwards. As figure 5 illustrates, FDI passed ODA as the main source of foreign capital inflow for developing countries in the early 90‟s and still outflows ODA with a great margin.
Figure 5. Total Net Foreign Capital Inflows by type of flow, 1990 – 2005 in billions of US dollars. (Source: UNCTAD, World Investments Report, based on World Bank 2006)
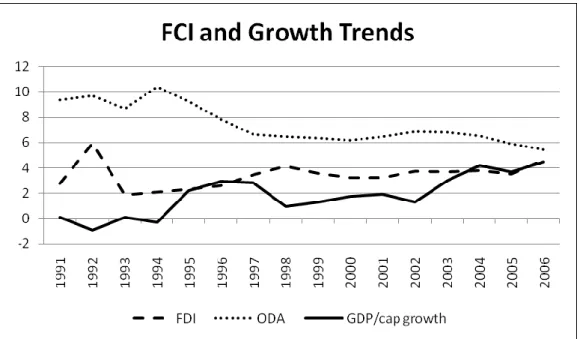
Although, these figures differ broadly across regions, especially in Sub-Saharan Africa (SSA) where the majority of the LDC‟s are located and ODA remains the most important inflow of capital (Frot & Santiso, 2008). In order to account for the size of the economy and population we consider per capita figures to more accurately represent development rather than total values. Therefore, we constructed a diagram to show the historical development of FCI in our sample countries, displayed in Figure 6 with capital flows and GDP in per capita values. Here one can clearly observe that developing countries actually receive higher shares of ODA than
16
FDI, but that recent trends show a decline in ODA and increase in FDI. The growth in GDP per capita seems to be more adhering to the pattern of increased flow of FDI, especially in recent years.
.
Figure 6. FCI and Growth Trends in Developing Countries (net inflows per capita, current $US)
3.2 Definition of Variables
The empirical research will be carried out by constructing an econometric regression model in order to analyse the relationship between Foreign Capital Inflows and the growth rates of Gross Domestic Product per capita. All of the observed countries have inflows of both forms of capital. Economic growth is generally measured in GDP and we will analyze the growth in annual GDP per capita. This measure will hence account for the size of the economy and represent the welfare of an average person in the economy.
As mentioned in the theoretical section, economic growth is caused by growth in inputs of labour and capital. We consider Gross Fixed Capital Formation (GFCF) a suitable measure for capital and that employment will reasonably represent labour. The growth rates of GFCF is calculated in constant local currency and includes land improvements, machinery, equipment purchases, infrastructure investments, construction of schools, offices, hospitals, private residential dwellings and industrial buildings. Data on FDI, ODA, GDP per capita growth and GFCF growth is collected from World Development Indicators 2008, which is the primary World Bank database for development data and is collected from officially recognized sources. Employment growth rates are collected from International Labour Organization and calculated in percentage of total population aged 15 and over. ODA and FDI are displayed as net inflows in the receiving country as a share of GDP.
The countries included in our analysis are those classified by the World Bank as low, lower-middle and upper-lower-middle income countries, divided according to 2008 gross national income per capita calculated using the World Bank Atlas Method. We started out with a larger sample, but were forced to exclude many states due to lack of data on several of our control variables. The entry year for our data is 1991 since comprehensive data on FDI was not available before this year.
17
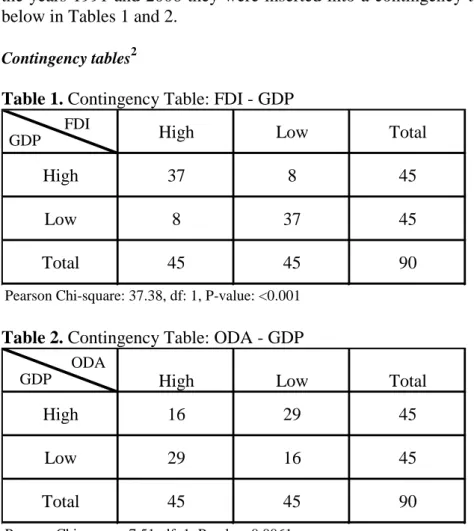
However, before moving on to the regression analysis a fundamental investigation of whether a relationship could be detected between our variables of interest is presented. Since without any visible patterns of correlation there would be no need for further exploration. Therefore, we chose to inquire the presence of a relationship between FDI and GDP growth as well as between ODA and GDP growth by constructing contingency tables. We collected data on total stocks in FDI and ODA as well as total GDP and divided them with total population in the respective countries and years. After calculating average values for each country between the years 1991 and 2006 they were inserted into a contingency table. The result is displayed below in Tables 1 and 2.
Contingency tables2
Table 1. Contingency Table: FDI - GDP GDP
FDI
High Low Total
High 37 8 45
Low 8 37 45
Total 45 45 90
Pearson Chi-square: 37.38, df: 1, P-value: <0.001 Table 2. Contingency Table: ODA - GDP
GDP
ODA
High Low Total
High 16 29 45
Low 29 16 45
Total 45 45 90
Pearson Chi-square: 7.51, df: 1, P-value: 0.0061
Both contingency tables of FCI and GDP clearly show where foreign capital flows are allocated and the significant Pearson‟s tests confirm that the relationship is not due by chance. Since our test statistic for the Pearson chi-square is below the critical probability level of 0.05 and significant at the 0.01 level for both tables we can reject the null hypothesis that no relationship exists and hence with strong confidence determine that there is such relationship between our variables as displayed in the tables.
From Table 1 one can clearly identify a positive relationship between FDI and GDP. The countries receiving high inflows of FDI also are the ones with high output per capita. Consequently, the FDI levels are low where the GDP per capita is low. The opposite pattern could be detected in Table 2 representing ODA per capita relatively to GDP per capita. The table displays a clear negative relationship between the two variables, thus the countries
2
18
suffering from low GDP per capita receive the highest amounts of ODA per capita. Accordingly, those countries with high GDP per capita have low levels of ODA.
However, even if the tables show that there seems to be a relationship between both forms of FCI and GDP, one cannot determine whether there is a matter of causation or correlation. Consequently, the tables do not tell the direction of the relationship, thus if low GDP causes low FDI inflows or if high ODA causes low GDP. It could hence be that large amounts of ODA are allocated where the GDP is low, and not the actual cause of it. Likewise, is high GDP an important determinant for FDI rather than that the investment actually promote high GDP? This is often referred to as a chicken and egg problem – one cannot conclude what comes first.
3.3 Regression analysis
An Ordinary Least Squares (OLS) regression model is used to determine the relationship between explanatory variables and their impact upon a dependent variable. In our analysis cross-sectional data between 1991 and 2006 is used, calculated in average values in order to avoid large fluctuations. The relationship between our variables can be fortified based on the β-value in our regression model. The null hypothesis, H0: β=0, implies that the foreign capital
inflow has no impact upon economic growth and the alternative hypothesis HA: β≠0 implies a
potential relationship. Hence, if the obtained result significantly differs from zero, we can reject the null hypothesis that there is no relationship between our variables. If β has a positive sign, the contribution is positive and vice versa. We support the alternative hypothesis, that both FDI and ODA will have significant and positive impacts on economic growth in our sample group.
The basic OLS regression equation used in our analysis takes the following form:
The dependent variable Y represents the average growth in real gross domestic product per capita, α denotes the constant factor and the remaining factors determine the slope of the relationship. Capital and labour are expressed in growth terms since they illustrate the dynamics of economic growth where growth in explanatory variables spurs growth in GDP according to Solow‟s growth accounting framework explicated in the previous section. Moreover, FDI and ODA are added as shift variables, expressed by S in equation 3.1, since they are regarded as supplementary factors affecting economic growth. We also include ε as an error term representing the effect on economic growth that the model cannot explain.
(3.1) (3.2)
19
3.3.1 Regression results
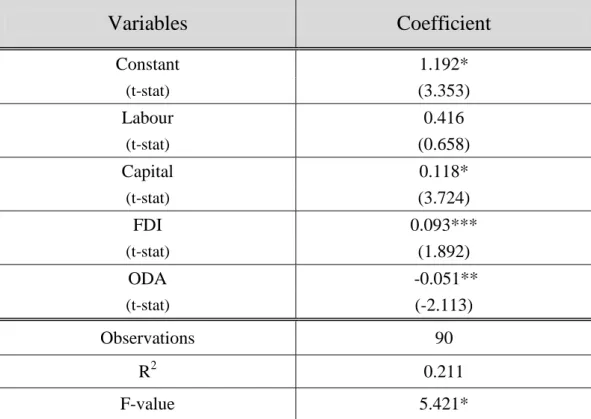
Table 3. Dependent Variable: GDP per capita growth 1991 - 20063
Variables
Coefficient
Constant 1.192* (t-stat) (3.353) Labour 0.416 (t-stat) (0.658) Capital 0.118* (t-stat) (3.724) FDI 0.093*** (t-stat) (1.892) ODA -0.051** (t-stat) (-2.113) Observations 90 R2 0.211 F-value 5.421*The regression results in table 3, with t-values displayed in parenthesis, shows that FDI has a positive impact on economic growth since the computed t-value for FDI is significant at the 10% level. The obtained coefficient implies that the GDP per capita will increase by 0,093 units per every unit increase in FDI. Moreover, ODA is found to negatively affect economic growth, where one unit increase in ODA causes a decline of 0,051 units per capita GDP. The results of ODA can be confirmed at the 5% significance level. Hence, this implies that we can, with very strong confidence, reject the null hypothesis that no relationship exists between either form of FCI and GDP per capita. Our variable for capital shows, at the 1% significance level, a strong positive contribution to economic growth, while employment is positive but insignificant. The obtained R2-value of the regression model shows that about 21% of the growth in GDP per capita is explained by our model.
We also ran the regression on different time periods, in order to investigate if there has been a change in FCIs‟ impacts over the passage of time. Therefore, the years were divided into two different time periods spanning for 8 years, between 1991-1998 and 1999-2006.
3
20
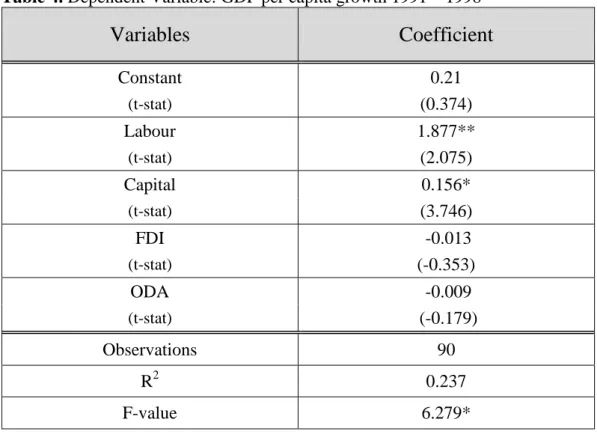
Table 4. Dependent Variable: GDP per capita growth 1991 – 19984
Variables
Coefficient
Constant 0.21 (t-stat) (0.374) Labour 1.877** (t-stat) (2.075) Capital 0.156* (t-stat) (3.746) FDI -0.013 (t-stat) (-0.353) ODA -0.009 (t-stat) (-0.179) Observations 90 R2 0.237 F-value 6.279*Table 5. Dependent Variable: GDP per capita growth 1999 – 20064
Variables
Coefficient
Constant 1.362* (t-stat) (0.413) Labour 0.238 (t-stat) (0.449) Capital 0.148* (t-stat) (5.397) FDI 0.271* (t-stat) (3.677) ODA 0.087** (t-stat) (-2.587) Observations 90 R2 0.4 F-value 13.973***In the first time period, table 4, both types of foreign capital have a negative effect, however the results are not significant. Only the key variables of capital and labour significantly and positively affected growth. However, in the second time period, FDI has a positive impact
4
21
while ODA remains negative, now both statistically significant; FDI at 1% significance level and ODA at 5%. This illustrates that in the second time period between 1999 and 2006 FCI had a more evident role, especially FDI, which can be supported by the global trend of increased flow of FDI to this part of the world recent years displayed in figure 5 and 6. Moreover, there is a possibility that the impact of ODA and FDI upon economic growth in the earlier time period were absent and insignificantly negative since both forms of FCI amounted to very small shares of GDP at that time.
We also wanted to investigate if regional and economic disparities matter in the relationship between Foreign Capital Inflows and growth. Therefore, we included dummies with an interaction term between subgroups and their respective inflow of foreign capital in order to investigate if any of the subgroups differed from the overall sample and affected the outcome of the original regression. The subgroups of interests were Asia, Sub-Saharan Africa and the LDCs. However, only in the regression including the interaction term for Asian countries, we found a noteworthy increase in the R2-value, showing that our selected variables now explain 47% of the growth in GDP per capita compared to the original R2-value of 21%. Nevertheless, the dummies representing FCI to different subgroups were generally insignificant and therefore we decided to not include them in our analysis.
4 DISCUSSION
The results attained by our contingency tables support the scholarly hypothesis that the poorest of the poor have difficulties in attracting or encouraging FDI and that ODA seems to be a more important source of foreign capital in filling their domestic gaps. However, the apparent negative correlation between GDP per capita and ODA per capita can very much be present due to the argument mentioned previously that they receive large amounts of assistance because they experience low growth and not the other way around. Consequently, it could be a matter of causation rather than correlation between our variables. The equivalent assumption holds for FDI, since the contingency table does not verify the direction of the relationship. Hence, we cannot conclude only by looking at the contingency table if it is FDI that causes high GDP per capita growth or if it is high level of GDP per capita that attracts high inflows of FDI. This dilemma is discussed by Chowdhury and Garonna (2007) who argue that the negative correlation between economic growth and ODA is due to the tendency of increased aid flows to countries experiencing low growth rates caused by an economic shock. Consequently, growth has not declined because of aid - aid is received due to low growth. This argument could explain much of the figures showing their negative relationship in a regression analysis. This is further supported and displayed by the diagram in figure 6 showing the trends of FCI and economic growth where ODA and GDP per capita growth do not follow the same pattern.
We found in our regression analysis a strong relationship between FDI and GDP per capita growth. The result was robust and statistically significant and is therefore assumed to be true in relation to our sample group. This adds further evidence to the debate regarding FDI‟s positive effects upon economic growth and its role as an important source of external funding for developing countries. In contrast to many previous studies we found a strong relationship with GDP per capita growth, without assuming a minimum level of economic development. Hence, the arguments of necessary prerequisites such as openness to trade (Balasubramanyam et al. 1996), technology (DeMello, 1997), adequate human capital (Borensztein, 1998) and sound financial institutions (Hermes and Lensink, 2003; Alfaro et. al., 2004; 2009) alleged to be crucial in order to achieve growth from FDI cannot be supported by our results. Nevertheless, by this we do not claim that these variables are futile in supplementing FDI,
22
only that they are not crucial for FDI‟s positive contribution to economic growth. Consequently, if these mentioned factors are present there will probably be a more supporting environment which increases the nation‟s capacity to reap all the benefits that FDI can provide to the domestic economy.
Our hypothesis that both forms of FCI would have significant and positive impacts on growth in developing countries was proved false in our empirical analysis, since only FDI came out positive. Hence, this finding adds another example of negative relation between economic growth and ODA. But why does the result come out negative? There may be problems either in assuring efficient allocation or simply just a failure in promoting its positive impacts upon other indicators than solely economic growth. In addition, one cannot exclude Sach‟s argument of inadequate amounts of ODA disbursements.
It is argued that if ODA can be assured to be put into efficient and sustainable investments and not into mere consumption, ODA can still be a very important tool in the development of the poor nations. Dahlgaard and Hansen elucidate in their report that ODA is often invested in human and social resources, such as education and infrastructure, which holds a potential to increase economic growth. This though implies that the effects will most likely emerge very slowly over a long period of time (Dahlgaard & Hansen, 2010). Moreover, this type of „hidden‟ economic growth can especially be found in the health sector, to which major amounts of ODA is allocated. Investments in health potentially induce a positive indirect effect on economic growth in the perspective of the condition and survival of the population and labor force.
Regardless the type of external capital flow, it requires careful analysis to ensure efficient allocation, in line with Schabbel‟s (2007) arguments. It is crucial that the supplementary resources are directed to priority areas from the domestic perspective and towards the sectors most efficient, so that the contribution to GDP is actually beneficial for the domestic population‟s welfare. This does not only regard ODA but also FDI. Because when MNCs with their profit-seeking objectives only uses their investments to exploit resources in the host country, for example in the oil and mineral sector, there will probably be a visible effect upon GDP per capita growth but this does not imply increased livelihoods for the entire population. The population would rather be better off by investments in their priority areas such as the agricultural or manufacturing sector. Hence, careful use and investigation of domestic priorities and characteristics are crucial to be able to enjoy positive impact - regardless the choice of foreign capital source.
OECD (2002) articulates that neither FDI nor ODA will alone solve the problem of economic development and eradicate poverty in the world. However, it is an essential supplement to domestic resources rather than a primary source of finance. Furthermore, even though both forms of capital may contribute significantly to capacity building in terms of human capital formation, the transfer of state-of-the-art technologies, enterprise restructuring and increased competition, at the end of the day it is still the host country authorities that must undertake the fundamental efforts in raising education levels, investing in infrastructure and improve the health of domestic business sectors. Consequently, the benign effects of FCI remain contingent upon appropriate policy actions by the relevant national authorities.
Even if our analysis shows that FDI is positively correlated to economic growth in developing countries and ODA is not, it is worth mentioning that our obtained results can be due to a possible selection bias. It is frequently argued that both FDI and ODA are very sensitive to
23
the choice of estimators and control variables. Moreover, this is a cross-sectional study with average values on 90 countries. The analysis and the result may be somewhat different if a time-series analysis is conducted, in either a larger sample of countries or in-depth on one specific country. Furthermore, the obtained various insignificant results is potentially due to the small shares of ODA and FDI that is allocated to developing countries, since it is only a supplementary source of financing, and neither form of FCI is the main determinant of economic growth.
5 CONCLUSIONS
In coherence with previous studies, we found that FDI is a more efficient form of Foreign Capital Inflow in promoting economic growth in GDP per capita than ODA. Consequently, according to our analysis we can conclude that FDI holds a key position in developing countries. Moreover, we can conclude that ODA has a negative effect upon the per capita growth rates in developing countries, but we cannot by this conclude that ODA is not good in promoting development whatsoever, since it requires further exploration on its effect on other development indicators. Hence, even if our regression model strongly confirms a negative effect of ODA upon economic growth, we cannot exclude the fact that the obtained result can be from possible bias in the selection of variables and sample countries in the model. Moreover, as mentioned in the discussion, the negative correlation obtained from the regression analysis could also be due to that ODA is mostly allocated to the most deprived areas in the world. Consequently, this means that ODA is high where the situation is the worst and does not imply that ODA affects economic growth negatively. Therefore, based on these arguments, ODA cannot be completely discarded as a necessary capital flow for developing nations. It may still be very crucial in helping the poorest of the poor in areas such as health, education, child mortality etc., hence offer advantages that for various reasons cannot be seen or measured in an analysis of growth in GDP per capita.
Based on recent scholarly research and our own empirical analysis we infer that both FDI and ODA might be crucial in fostering economic development, but in different stages. Due to ferocious circles of extreme poverty, developing countries lack the ability to even reach the very first steps on the prosperity ladder. We believe in line with other studies that ODA may be crucial in the early stages to break out of the poverty trap, before they can be able to reap any benefits of globalization and foreign investments. Subsequently, all focus must be placed on developing a self-sufficient and sustainable economy without reliance upon external assistance. This is what we consider to be a strong foundation to attain the required minimum level of basic economic, social and political factors in order to reap all the benefit that FDI may bring upon a nation. Therefore, we believe in FDI‟s role in enhancing economic growth and advice the global community to further encourage cross-border investments. However, ODA should not be ignored as a “hidden” growth enhancer through other channels than GDP per capita.
Finally, we want to end this thesis with some additional concluding remarks. We believe that that the only thing that really saves developing nations from extreme poverty is to create incentives for development - in all levels and sectors. Thus, we must not forget the most important part of all, what development is really about - it is about helping poor nations help themselves. It is not a sustainable long-run beneficial solution to give them capital, in line with the famous saying; give a man a fish and you feed him for a day – teach a man how to
24
sources of foreign capital inflows are egoistic or altruistic it is the domestic incentives that matter in the long run.
6 RECOMMENDATIONS FOR FURTHER RESEARCH
We have during working with this thesis found that this is a very interesting yet complex issue, in line with our predecessors and many aspects remains inadequately explored. For further investigation we suggest to analyze closely whether there is matter of a causal relationship between FDI and growth. Is it FDI that induces growth or is it growth itself that attracts FDI? Moreover, we would recommend exploring the actual reasons for receiving aid, and closely look at the different trends of economic growth due to country specifics. These individual scenarios are not included in a regression analysis and thus very hard to quantify and measure from only looking at overall statistics. Furthermore, we believe that even though average cross-section analysis show the general relationship between our variables, we believe that it can be practical to use time-series data to more in detail account for downturns or swings in economic development over the passage of time. Variables for other indicators may also be very helpful in finding more robust results. Finally, we would find it interesting to further investigate the relationship between FDI and ODA; are they complements or substitutes? Is it possible to identify that certain minimum level where the transition from ODA to FDI takes place?