http://www.diva-portal.org
This is the published version of a paper presented at 24th ISPE International Conference on
Transdisciplinary Engineering, Singapore, 10 July to 14 July, 2017..
Citation for the original published paper: Johansson, J. (2017)
Analysing Engineering Knowledge in CAD-models and Spread Sheets using Graph Theory and Filtering.
In: 24th ISPE International Conference on Transdisciplinary Engineering (TE2017):
Transdisciplinary Engineering: A Paradigm Shift (pp. 629-638). IOS Press
Advances in Transdisciplinary Engineering https://doi.org/10.3233/978-1-61499-779-5-629
N.B. When citing this work, cite the original published paper.
Open Access
Permanent link to this version:
Analysing Engineering Knowledge in
CAD-models and Spread Sheets using
Graph Theory and Filtering
Joel JOHANSSONa,1aProduct Development, School of Engineering, Jönköping University, Sweden
Abstract. As the era of Knowledge Based Engineering (KBE) and design
automation has evolved a big effort has been put to automate CAD-models to quick and accurately respond to changes of customer specifications. The automated knowledge in these KBE-systems is represented as sets of rules, sets that are continuously growing. Parallel to KBE-systems knowledge is also automated in spread sheets (were the cells can be viewed as rules in a KBE-system). These spread sheets also tend to grow in number and complexity. The vision of reusing corporate knowledge through automating it in computer systems are now threaten by the fact that the complexity makes it hard to grasp and manage what was automated. Complexity management and graph theory are scientific fields addressing these types of problems. This paper describes how engineering knowledge stored in CAD-models and spread sheets can be analysed through the application of graph theory, visualization and filtering. Information models of CAD-models and spread sheets are developed and applied to a real industrial case to generate and analyse the content.
Keywords. Knowledge Based Engineering, Knowledge Engineering, Graph
Theory, Complexity Management, Graph Visualization
Introduction
In the era of information and knowledge management mass customization has been a strong driving force to automation of engineering processes. Big effort has been put to automate CAD-models to quick and accurately respond to changes of specifications. This change has caused manufacturing companies to not only focus on developing single products but product families with wide and flexible design spaces. The automated knowledge is stored in KBE-systems (Knowledge Based Engineering) and is represented as sets of rules, sets that are growing in size and complexity as the mass customization evolves. We also see that engineering knowledge is automated in spread sheets (the cells can be viewed as rules in a KBE-system). These spread sheets too tend to grow in number and complexity. The vision of reusing corporate knowledge through automating it in computer systems are now threaten by the fact that the complexity makes it hard to grasp and manage what was automated.
Two other trends during the information era have led to development of theories and tools that can be applied within engineering design and product development. These two trends are social networks and geographic information systems. Along with the development and utilization of these big infrastructures in the society also methods and tools for graph visualization and filtering have emerged that can be utilized by within engineering design with little effort but with big potential.
Visualization of interdependencies of elements in CAD-models has been target as a research subject. Kozlova et. al. reviewed how graph visualization can be used for CAD-models of architectures [1] they also developed prototypes for interactive graph visualization. The focus of that work was the visualization of the graphs and functions. Tsygankov et. al. [2] studied how to semantically represent the building process of CAD assemblies containing multi-body components. Camba et. al. [3] developed methods to travers CAD-models of components to identify and visualize dependencies between features. Marchenko et.al. [4] developed a tool to represent CAD-models as graphs in CATIA, that work considered how the elements of the CAD-models were connected not only as parent/child relations but also through mathematical formulas.
This paper focus on what types of relations exist within CAD-models (features, components and assemblies) and in spread sheets connected to them. Also, it describes how engineering knowledge stored in CAD-models and spread sheets can be analysed through the application of graph theory, visualization and filtering. The paper is organised as follows: First the information models for CAD-models and spread sheets are introduced and graph theory in connection with these information models is presented. The theory is then applied to a real case which is a CAD-model that was automated using spread sheets as design tables that grew out of control.
1. Dissecting the constituents of engineering knowledge
In this study, we focus on CAD-models that are controlled by spread sheets. The original reason to connect spread sheets to CAD-models was to define family tables, i.e. sets of similar components derived from a single parametric CAD-model. That is an efficient way of handling parametric design of for instance fasteners, washers or other components. Things are getting more complex when adapting such an approach to assemblies of components. The increase in difficulty is due to the introduced combinatorial complexity of the assembled components. To handle the complexity, and for other reasons, it has become common to use the cells in the spread sheet not only to specify the values for each member of the design family but also to add mathematical relations within the spread sheets to change the values in the family table.
We will take a close look at these two types of engineering content, CAD-models and spread sheets, to see how they are constituted and how they are connected to make a foundation to further studies in knowledge and complexity management.
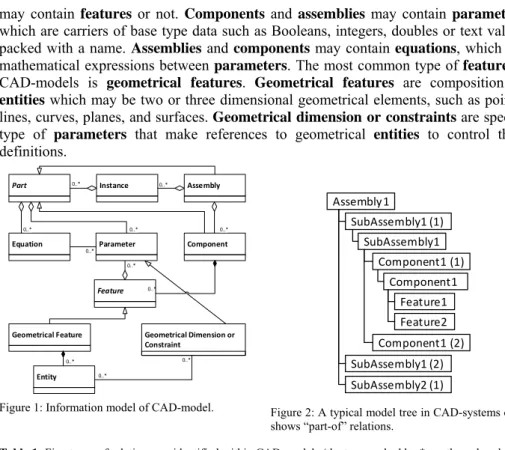
The information model of a CAD-model can be constituted in many ways and differs between CAD-systems (therefore neutral CAD-formats are needed). In Figure 1 a schematic information model is shown where the most fundamental components are drawn. An assembly, is as seen in the figure, composed of instances of parts which can either be components or assemblies of instances (the terminology differs somewhat between what is a part and what is a component, here a component is a piece made from one material, a part can be either one component or a composition of components). Components are made up from at least one feature while assemblies
may contain features or not. Components and assemblies may contain parameters which are carriers of base type data such as Booleans, integers, doubles or text values packed with a name. Assemblies and components may contain equations, which are mathematical expressions between parameters. The most common type of feature in CAD-models is geometrical features. Geometrical features are composition of entities which may be two or three dimensional geometrical elements, such as points, lines, curves, planes, and surfaces. Geometrical dimension or constraints are special type of parameters that make references to geometrical entities to control their definitions.
Figure 1: Information model of CAD-model. Figure 2: A typical model tree in CAD-systems only shows “part-of” relations.
Table 1: Five types of relations are identified within CAD-models (the two marked by * are the only relation
types that are undirected). Connected constituents are defined in Figure 1and Figure 3.
Relation type Connected constituents Realized by
Part-of Entity → Feature Feature entities Part-of Feature → Component Component features Part-of Component → Assembly Assembly instances Part-of Cell→WorkSheet WorkSheet Part-of WorkSheet→WorkBook WorkBook Kind-of Instance → Part Instance Connection Entity → Feature References in feature Mathematical Parameter → Parameter, Cell → Cell Expressions in equation, Formula
Connection* Entity ↔ Entity, Part ↔ Part Geometrical constraints Spatial* Entity ↔ Entity Location
There are several types of relations in a CAD-model. As seen from Figure 1, components are related to assemblies as “part-of” relations. Features, parameters and equations are also “part-of” components, and entities are “part-of” features. These relations are easy to understand and are often visualized in the CAD-system through a “model tree”. A typical model tree is shown in Figure 2 which contains a top assembly (Assembly1) having three instances of parts (2 SubAssembly1 and 1 SubAssembly2). SubAssembly1 in turn is composed of two instances of Component1 which is made up from Feature1 and Feature2 (only few CAD-systems show the instances in the model tree).
There are other relations in the CAD-model than these “part-of” relations, relations not that obvious but interesting to engineers when developing and maintaining the models. One such relation is references between geometrical entities through
Component Geometrical Feature Parameter Entity 0..* Part Instance Feature 0..* 0..* Geometrical Dimension or Constraint 0..* 0..* Assembly 0..* 0..* Equation 0..* 0..* 0..* 0..* Assembly1 SubAssembly1 (1) SubAssembly1 Component1 (1) Component1 Feature1 Feature2 Component1 (2) SubAssembly1 (2) SubAssembly2 (1)
geometrical dimension or constraints. For instance, if creating a feature with references to an already existing feature there is an ordering relation, referred to as parent/child relation. Deleting the first feature will cancelling the other one. It is possible in most CAD-systems to add logics to the CAD-model through equations. The equations may refer to geometrical dimensions that in turn change the size or even topology of the geometry of the CAD-model. Such relations are here called mathematical relations (these relations could also be viewed as parent/child relations if they are unary expressions). The relations are modelled as edges in the graphs per Table 1.
Spread sheets are frequently used within engineering design to store and manage information regarding the product and is indeed a part of the product model. Spread sheets may be connected to CAD-models as design tables or as a part of the geometrical build process as an “analysis” features. The reason for adding spread sheets as a part of the product model is the flexibility to model information yet overview the information provided by spread sheet applications. The central concept in spread sheet applications is the cell. In Figure 3In Figure 3 a schematic information model of a spread sheet is draw.
Cells resides, as seen in the figure, in worksheets and worksheets resides in workbooks. A cell may contain a formula that refers to other cells. Formulas act as functions with several input cells but with one output only, which is displayed in the cell containing the formula. When connected to a CAD-model we can view these functions as rules in a KBE-system according to the definition of KBE in [5], the inference engine is then realized by the spread sheet
application. Figure 3: Information model of spread sheet. A graph G(N, E) is a set of nodes (N) and edges (E). The nodes represent entities of interest and the edges represent how they are connected as tuples of two nodes first one is the source node and last one is the target node [6]. When two nodes are connected through an edge they are said to be neighbours. The nodes represent entities of interest and the edges represent how they are connected as tuples of two nodes first one is the source node and last one is the target node. Edges can be directed or undirected [6]. When two nodes are connected through an edge they are said to be neighbours. The degree of a node is defined as the number of neighbours it has, i.e. how many edges are pointing in and out from it. In-degree refers to how many neighbours a node depends on and out-degree how many neighbours are depending on it.
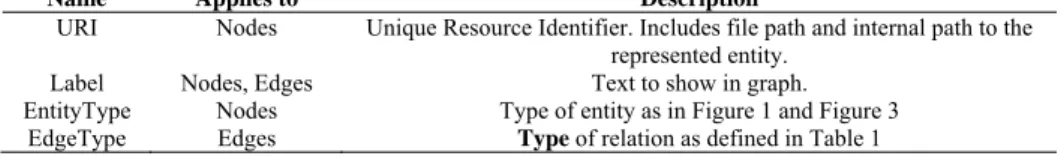
To add meaning to the graph it is useful to add attributes to nodes and edges. Attributes were added to the nodes and edges in this paper are listed in Error! Reference source not found.. Table 2. The EdgeType attribute is what separates the graphs presented in the paper from the model-trees in CAD-systems. With this attribute, it is possible to model how the entities are connected. When reviewing the class diagrams in Figure 1 and Figure 3 five different types of couplings are found, these are listed in Table 1. The values in the first column of that table is used as possible values of the EdgeType attribute and as labels for the edges.
Workbook Worksheet Cell 1 1..* 1 1..* Formula 0..* 0..* 1 0..1
To understand huge graphs, it is necessary to filter their vast content and two combinations of filters are suggested here. The first set of filters is the combination of retrieving nodes of types “Geometrical Dimension”, “Parameter” and “Cell” (i.e. nodes representing entities that control the design) and of degree 0. The entities represented by the retrieved nodes of such filter are the entry points for the CAD-model, changing any of their values impacts the design. We call these values design parameters.
With edge filtering, it is possible to filter different structures (or nets) of the CAD-model. Filtering edges on “External connections” yields the interfaces between the CAD-model and design tables. Adding edges of types “Mathematical” gives the entire set of logics for the CAD-model, which is the second suggested set of filters. The nodes resulting from that filter represents the logical part of the product model.
Table 2: Four attributes were added to develop the graphs in this paper.
Name Applies to Description
URI Nodes Unique Resource Identifier. Includes file path and internal path to the represented entity.
Label Nodes, Edges Text to show in graph. EntityType Nodes Type of entity as in Figure 1 and Figure 3
EdgeType Edges Type of relation as defined in Table 1
2. Putting the parts together
To get a seamless overview of the engineering content CAD-models and design tables as connected spread sheets can be analysed to render graphs using the theory in the previous section. There are two algorithms used to do the analysis, the first one travers the CAD-model and its sub-models to extract the nodes and edges. The second algorithm analyses any spread sheet connected to the CAD-models or referred to in spread sheet to extract nodes and edges within them and in connection to the CAD-model.
We make a simple example to demonstrate the output from these algorithms. Let say we have a CAD-model containing a box with a hole through it. The model-tree is of course simple containing two extruded sketches, one to make the box and one to make the hole. The two sketches are shown in the model tree. The CAD-model is controlled by a design table so that height, width and length are controlled by the cells in in a connected spread sheet. Two configurations (or product instances) are defined. The values for the first configuration is in turn controlled by a cell in another spread sheet.
Applying the algorithms to the simple box-with-hole example yields a graph with 22 nodes and 28 edges. The graph is visualized in Figure 4 with the Yifan Hu layout algorithm [7]. There are seemingly duplicate nodes (for instance two D1) this is because of using short names on the nodes (Label attribute). The nodes are unique with the URI attribute identifying them. It is possible to retrace the URI from the Part-Of connections, we then see that both Sketch1 and Sketch2 have a dimension D1. For cells in spread sheet one must review the URI attribute to see the entity-location.
Figure 4: Graph illustrating the relations in the CAD-model, design table and in between. 22 Nodes and 28 relations.
Applying the filters to retrieve design parameters results in 7 design parameters: the nodes D1, D2 and D3 (green) to the left and B1, B2, B3 and the other B3 (blue) to the right in Figure 4. This is interesting as it indicates that every value in a design table indeed is a design parameter. In the box-with-hole example the number of design parameters is reduced by the formulas for the Default configuration controlled by B3 in the other sheet. Applying the filter to retrieve the logics behind the example yields a graph showing how the 7 design parameters are interconnected with mathematical expressions.
3. Real Case Example
To verify the concepts presented in the previous sections a prototype software was developed and applied to a real-life example. The company where the software was tested develops and manufactures heated runner systems for injection moulding of plastic materials and is the same company as described in [8]. To verify the concepts presented in the previous sections the algorithms applied to a real-life example. The company where the software was tested develops and manufactures heated runner systems for injection moulding of plastic materials and is the same company as described in [8].
One reason to analyse the CAD-models at the company was that the product is a product suitable for design automation. Every produced hot runner system is unique. Even if unique there are standard procedures to render the final product. This led to the automation of the CAD-models through interconnected spread sheets as design tables. Due to the combinatorial complexity of the product mathematical equations were added as equations in the CAD-models as well as in the spread sheets. This approach made the CAD-system instable so that when adding several instances of the in-gates it eventually crashed after long time (sometimes up to 40 minutes) of crunching. It didn’t always crash so the engineers tended to wait and hope for it to go through. The crashing problems were eliminated when reforming the CAD-models as described in [8], the graph shown at end of the paper may give a clue of why the model became so difficult to handle.
The prototype software took 2 minutes to generate the entire graph as presented in Figure 5. The output from the routine is a file containing the graph in Graph Modelling Language (.GraphML) which is a general, XML-based language, to store graphs in a standardized way [9]. To visualize the graphs several freely available software
applications were tested (the pictures in this paper were generated using Gephi [10] with the Yifan Hu [7] and Force Atlas 2 [11] layout routines). The graph contains 3932 nodes (47% formula, 28% geometrical dimension, 17% feature, 2.9% instance, 2.2% cell, 0.7% Component, 0.6% Assembly, 0.2% parameter) connected in 11321 relations.
Figure 5: (Left) CAD-model that comes in 17 billion variants. (Right) CAD-model and interconnected spread sheets. 3938 nodes connected in 11321 relations. The firework shapes are from spread sheets, and the top part is from the CAD-model (all nodes are connected).
The CAD-model targeted consists of five sub-parts of which only one is an assembly (which in turn consist of three components). In total, we are talking about 7 components in two assemblies which seems very little to make a CAD-system to collapse. What makes it so difficult is the vast number of variants for each component (stored in the same model). Another problem lays in the application of the product which is to operate in much higher temperature than it is produced which resulted in several temperature configurations for each component. The top-level assembly contained 42 equations controlling features on all levels.
The spread sheets connected to the CAD-model as design tables included all possible combinations of the components. The combinations where added using formulas in the spread sheet so that when changing certain cell values then parts of the design table were changed (this method works for ETO-products). In total the design table contained 1248 cells and there were additionally 46 cells with data and formulas to adjust the values in the design table.
The prototype software took 2 minutes to generate the entire graph as presented in Figure 5. The output from the routine is a file containing the graph in Graph Modelling Language (.GraphML) which is a general, XML-based language, to store graphs in a standardized way [9]. To visualize the graphs several freely available software applications were tested (the pictures in this paper were generated using Gephi [10] with the Yifan Hu [7] and Force Atlas 2 [11] layout routines). The graph contains 3932
nodes (47% formula, 28% geometrical dimension, 17% feature, 2.9% instance, 2.2% cell, 0.7% component, 0.6% assembly, 0.2% parameter) connected in 11321 relations.
When applying the filters, there are 1165 entry points of which the majority are of Geometrical Dimension type further filtering shows that there are 12 parameters and 86 cells. These entities should be managed and the information regarding them should be made easy to retrieve to engineers. The logical model consists of 1248 external connection and 6990 mathematical connections.
4. Discussion
As seen in this paper it is possible to penetrate CAD-models and spread sheet to extract and visualize graphs. The method is not limited to CAD-models or spread sheet but could be applied to FEA-models, Manufacturing models or other types of models of the product if there are APIs or a deep understanding of the information models. Question is what can be achieved by these graphs?
It was possible to identify how design tables are connected to the CAD-model. Filtering techniques were applied to retrieve all entry points for the CAD-model and to visualize the product structure and the structure of the logical entities.
The combinatorial complexity of products when starting to automate CAD-models is often underestimated, as mentioned in [8] there are stunningly 17 574 796 800 possible and impossible combinations of components for the in-gate model. The combinatorial complexity of products when starting to automate CAD-models is often underestimated, as mentioned in [8] there are stunningly 17 574 796 800 possible and impossible combinations of components for the in-gate model. Even if seemingly large that figure is small when talking about combinatorics. Due to this complexity, it is necessary to help engineers to manage the design content and to see what impacts their decisions have in this aspect.
The graphs must be filtered to make sense in the context of the decision to be taken. The two filters mentioned in this paper are general and useful for all models of this kind but the filtering is individual and context based so it is necessary to provide engineers with filtering possibilities rather than fixed filters. Filtering possibility is tightly connected to the attributes added to the nodes and edges, so that more attributes gives more filtering possibilities. A higher granularity of Mathematical relations would make it possible filter in the 6990 connection in the case example. Attributes can be organized in categories.
If making the graph contextual, filtered, and embedded into the CAD-system as a different view of the CAD-model the graphs could be used throughout the entire product life-cycle. In the conceptual phases and in design phase the graphs would serve as visual feed-back to engineers. It would guide them to develop more lean and re-useable models of the product knowledge. If the product is already developed the graphs could be used during modularization project (graph clustering) or in carry over project between product generations. The graphs would in such cases serve as a foundation for recapturing the knowledge. When maintaining the product models the graphs would provide functionality for change propagation analysis.
During the penetration of the product models it would be possible to store comments and formulas (content) as additional attributes to nodes. If doing so the network would conform well with the connectivistic view on what knowledge is [12].
If doing so the network would conform well with the connectivistic view on what knowledge is [12].
5. Conclusion
This paper is a starting point of applying the connectivistic view of knowledge [12] to knowledge based engineering. It was shown that by scanning the elements within a knowledge base in a KBE system it is possible to visualize and navigate its content through graphs. It was also shown that it is necessary to enable individualized and contextualized filtering of the vast amount of information. We dissected CAD-models and spread sheets to develop information models to serve as a foundation for graph visualization. Five types of relations between the constituents were identified: “Part-Of”, “Kind-“Part-Of”, “Connection”, “Mathematical” and “Spatial”. Two algorithms were developed to travers CAD-models and spread sheets to retrieve graphs representing the information stored within them. Two filters were used to filter the resulting graphs to identify design parameters and the logical model of the product model at hand. These steps are taken to enable manufacturing companies to master the complexity of their product families.
Acknowledgement
The author expresses his gratitude towards the participating company in the study as well as The Knowledge Foundation who partly funds the project.
References
[1] K. Kozlova, M. Roham, L. Sheikholeslami, and R.F. Woodbury, Graph visualization in computer-aided design: an exploration of alternative representations for GenerativeComponentsTM Symbolic
View, in: Circuit Bending, Break. Mending CAADRIA, CAADRIA, Newcastle, Australia, 2011. [2] D. Tsygankov, A. Pokhilko, A. Sidorichev, and S. Ryabov, The design process data representation
based on semantic features generalization, in: Adv. Transdiscipl. Eng., 2016: pp. 127–132. [3] J.D. Camba, and M. Contero, Improved representation of dependencies in feature-based parametric
CAD models using acyclic digraphs, in: GRAPP 2015 - 10th Int. Conf. Comput. Graph. Theory Appl. VISIGRAPP, Proc., 2015: pp. 16–25.
[4] M. Marchenko, B.-A. Behrens, G. Wrobel, R. Scheffler, and M. Pleßow, A New Method of Visualization and Documentation of Parametric Information of 3D CAD Models, Comput. Aided.
Des. Appl. 8 (2011) 435–448.
[5] G. La Rocca, Knowledge based engineering: Between AI and CAD. Review of a language based technology to support engineering design, Adv. Eng. Informatics. 26 (2012) 159–179.
[6] R. Diestel, Graph theory, 2. ed. ., Springer, New York, 2000.
[7] Y. Hu, Efficient, High-Quality Force-Directed Graph Drawing, Math. Journal. 10 (2005) 37. [8] J. Johansson, Howtomation© suite: A novel tool for flexible design automation, in: Adv.
Transdiscipl. Eng., 2015: pp. 327–336.
[9] GraphML Team, The GraphML File Format, (2016). http://graphml.graphdrawing.org/ (accessed February 16, 2017).
[10] Gephi.org, The Open Graph Viz Platform, (n.d.). https://gephi.org/ (accessed February 16, 2017). [11] M. Jacomy, T. Venturini, S. Heymann, and M. Bastian, ForceAtlas2, a Continuous Graph Layout
Algorithm for Handy Network Visualization Designed for the Gephi Software, PLoS One. 9 (2014). [12] G. Siemens, Knowing knowledge, Milton Keynes, Winnipeg, Canada, 2006.