http://www.diva-portal.org
This is the published version of a paper published in Scientific Reports.
Citation for the original published paper (version of record):
Ahlqvist, V H., Persson, M., Ortega, F B., Tynelius, P., Magnusson, C. et al. (2019)
Birth weight and grip strength in young Swedish males: a longitudinal matched sibling
analysis and across all body mass index ranges
Scientific Reports, 9: 9719
https://doi.org/10.1038/s41598-019-46200-0
Access to the published version may require subscription.
N.B. When citing this work, cite the original published paper.
Permanent link to this version:
Birth weight and grip strength
in young swedish males: a
longitudinal matched sibling
analysis and across all body mass
index ranges
Viktor H. Ahlqvist
1, Margareta persson
2, Francisco B. ortega
3,4, per tynelius
1,5,
Cecilia Magnusson
1,5& Daniel Berglind
1,5Low birth weight is associated with a lower grip strength later in life. However, associations between birth weight among infants born at-term and factors driving associations between birth weight and grip strength are largely unknown. A cohort of 144,369 young men born at-term, including 10,791 individuals who had at least one male sibling/s, were followed until conscription where they performed a grip strength test. We used linear and non-linear regression analyses in the full cohort, and fixed-effects regression analyses in the sibling cohort, to address confounding by factors that are shared between siblings. After adjustment, each unit increase in birth weight z-score was associated with increases of 17.7 (95% CI, 17.2–18.2) and 13.4 (10.1–16.6) newton grip strength, which converts to approximately 1.8 and 1.4 kilogram-force in the full and within-families cohorts, respectively. The associations did not vary with young adulthood BMI. Birth weight, within the at-term range, is robustly positively associated with grip strength in young adulthood among men across all BMI categories and associations appears to be mainly driven by factors that are not shared between siblings. These findings underline the importance of recognizing the influence of low birth weight, also within the at-term-range, on young adulthood muscle strength.
Low birth weight1, preterm and early term births2 are associated with an increased all-cause mortality risk,
impli-cating that a compromised fetal environment may have long-lasting health consequences. Birth weight is not only determined by the prenatal environment, but also by genetic influences. Hence, associations between birth weight and later health outcomes may be a consequence of a compromised environment in utero or genetic factors that affect both birth weight and later health outcomes. Therefore, family studies are needed to provide further evi-dence of the extent to which the associations between birth weight and later health outcomes are explained by genetical factors and other family shared environmental factors. Gestational age is, in addition to birth weight, an important determinant of adult health3,4. It is becoming increasingly evident that infants born at-term (i.e. week
37–41) form a heterogeneous group5. Indeed, birth weight within the at-term range is associated with later health
outcomes6,7. By using births within the at-term range, confounding by gestational age and/or prematurity can
be ruled out. In all, these findings warrant further explorations of long‐term health markers associated to birth weight among infants born at-term.
One such important and modifiable health marker is grip strength which is associated with a wide range of health outcomes later in life, including all-cause mortality rates equivalent to that of well-established risk factors such as elevated blood pressure or body mass index (BMI)8–10. Furthermore, higher grip strength has
1Department of Public Health Sciences, Karolinska institutet, Solna, Sweden. 2Umeå University, Department of
nursing, Umeå, Sweden. 3PROfitH “PROmoting fitness and Health through physical activity” research group,
Department of Physical education and Sports, faculty of Sport Sciences, University of Granada, Granada, Spain.
4Department of Biosciences and nutrition, Karolinska institutet, Solna, Sweden. 5centre for epidemiology and
community Medicine, Stockholm county council, Stockholm, Sweden. correspondence and requests for materials should be addressed to D.B. (email: daniel.berglind@ki.se)
Received: 20 March 2019 Accepted: 24 June 2019 Published: xx xx xxxx
www.nature.com/scientificreports
www.nature.com/scientificreports/
been demonstrated to attenuate the increased mortality associated with an elevated BMI11, suggesting that grip
strength has important health benefits across all BMI categories. There is a strong correlation (i.e. >0.8) between grip strength and total muscle strength in young males12, which makes grip strength an appropriate general
indicator for overall muscle strength13. Muscle strength is the capacity to carry out work against a resistance,
depending on several factors (e.g. muscle mass, neuromuscular function etc.). Studies have suggested that the major factor influencing the observed inverse association between grip strength and mortality is not attributable to the muscle mass per se, but to muscle strength as a marker of muscle quality14. Overall, current evidence from
epidemiological observational studies indicate that low birth weight, across all gestational ages, is associated with lower grip strength, even after adjusting for potential confounding factors15. However, most previous studies on
the topic have been confined to small sample sizes, grip strength comparisons between preterm birth and term‐ born controls being used as a homogenous comparator and/or unable to control whether such associations are explained by shared and/or non-shared familial factors15.
Therefore, the aim of this study was to investigate the association between birth weight, within the at-term range, and grip strength in young males. We further investigate whether any such association is explained by factors shared between siblings, and if associations differ with BMI in young adulthood.
Methods
study design.
This prospective cohort study used unique personal identification numbers, assigned to each Swedish resident at birth, for record linkage of four different Swedish population-based registers: (i) the Medical Birth Register (MBR) containing validated data on >99% of all births in Sweden16, (ii) the Swedish Military ServiceConscription Registry, (iii) the Population and Housing Censuses from 1970 and 1990 and (iv) the Multigenerational Register. The study was approved by the Regional Ethical Review Board, Stockholm (Dnr: 2016/1445-31/1).
study population.
All men born at-term in Sweden 1973–1976 (n = 171,987) and who conscripted for mil-itary service in 1991–1994 (n = 155,236) were eligible for inclusion in the study. In that time period, conscription was mandatory by law, and young adults were relieved from conscription only due to confinement or if they suffered from severe medical condition. The study period was chosen to match the availability of perinatal expo-sure data from the MBR (available from 1973) and outcome grip strength data from the conscription registry. Exclusion criteria included incomplete data (n = 10,867) including those who did not perform the grip test at conscription (n = 10,773), or extreme values (n = 68) for weight (≤40 or ≥150 kg), height (≤150 or ≥210 cm) and BMI (≤15 or ≥60 kg/m2) at conscription, as previously described17. Derivation of the analytical sample ispresented in a flowchart in Fig. 1. In total, 144,369 (93%) young adults performed the grip test and were therefore included in the final analytical sample. The within-families cohort included 10,791 individuals who had one or more matchable male sibling/s.
exposures.
All perinatal variables were derived from the MBR16. At-term births were defined as birthsbetween 37–41 weeks6 and the date of the last menstrual period was used to estimate gestational age18. Birth
weight was measured in grams, and extreme values <300 g and >7,000 g were excluded. Gestational age specific birth weight z-scores were estimated using the total study population as the reference. For a baby born at 40 weeks, one SD corresponds to approximately 455 grams.
Outcome – grip strength.
Grip strength was measured in Newton’s (N), using standard well-validated and daily calibrated isometric dynamometer test19, where 9.8 N equals one kilogram force. Each dynamometer test wasper-formed, using the dominant hand, three times and the maximum value recorded for analysis. However, if the last value in the last trial was higher than the previous trials, testing was repeated until strength values stopped increasing.
Confounders and covariates.
Standardized scales and stadiometers were used to measure weight and height at conscription, respectively20. BMI (kg/m2) was classified according to World Health Organization (WHO)categories: underweight (BMI <18.5), normal weight (BMI 18.5–24.9), overweight (BMI 25–29.9) and obese (BMI ≥30)21. Parental education, where the highest education achieved by any of the parents was used as a
meas-ure of household socioeconomic position, was derived from the Population and Housing Censuses. Information regarding conscription center (six centers) and age at conscription were retrieved from the Conscription Registry. The MBR was used for information on further potential confounders, such as maternal diabetes, maternal hyper-tension, birth by caesarean section, maternal parity and maternal age at birth.
statistical analyses.
First, we descriptively present our cohort by dichotomizing the exposure and out-come by their respective median into four groups: (i) high grip strength/high birth weight z-score, (ii) high grip strength/low birth weight z-score, (iii) low grip strength/high birth weight z-score and (iv) low grip strength/low birth weight z-score (Table 1 and Supplementary Table 1). Second, we used linear regression models to analyze the associations between z-score birth weight, within the at-term range, and grip strength. Third, to control for shared factors (fixed effects) by full brothers within families (approximately 50% shared genetic factors) we used fixed-effects regression models (Table 2). Fourth, we stratified our crude and fully adjusted models on previously described BMI categories at conscription (Table 3). Additionally, we examined if there was any statistical inter-action between continuous BMI and z-score birth weight in the association with grip-strength (data not shown). Associations in our models are presented as crude estimates and adjusted for maternal diabetes (yes/no), maternal hypertension (yes/no), caesarean section (yes/no), parity (categorical), maternal age (continuous), high-est parental education (categorical) and conscription office (categorical). We further employed rhigh-estricted cubic splines with five knots at: 5, 27.5, 50, 72.5 and 95 percentiles, to assess departure from linearity (Fig. 2). All anal-yses were performed using Stata 14.0 (Stata Corp, College Station, TX, USA).sensitivity analyses.
We conducted a sensitivity analysis where we stratified the linear association between z-score birth weight, within the at-term range, and grip strength by quartiles of height in centimeter (cm) (Supplementary Table 2). The quartiles were constructed at the 25, 50 and 75 percentiles which resulted in the groups: ≤175 cm, 176–180 cm, 181–184 cm, and ≥185 cm.Compliance with ethical standards.
The study was approved by the Regional Ethical Review Board, Stockholm (Dnr: 2016/1445-31/1). The requirement to obtain informed consent was waived by the Regional Ethical Review Board, Stockholm (Dnr: 2016/1445-31/1). All research was performed in accordance with rele-vant guidelines/regulations.Results
Descriptive statistics.
Table 1 presents descriptive data for the 144,369 individuals in the full cohort accord-ing to five categories: (i) full-cohort, (ii) high grip strength/high birth weight z-score, (iii) high grip strength/ low birth weight z-score, (iv) low grip strength/high birth weight z-score and (v) low grip strength/low birth weight z-score at conscription. A similar description for the within-families cohort is presented in Supplementary Table 1. In general, most covariates such as maternal diabetes, maternal hypertension, highest parental education etc. were fairly equally distributed between the five categories, whereas birth by caesarian section was slightly elevated in the low grip strength/low birth weight z-score group.Birth weight, within the at-term range, and grip strength.
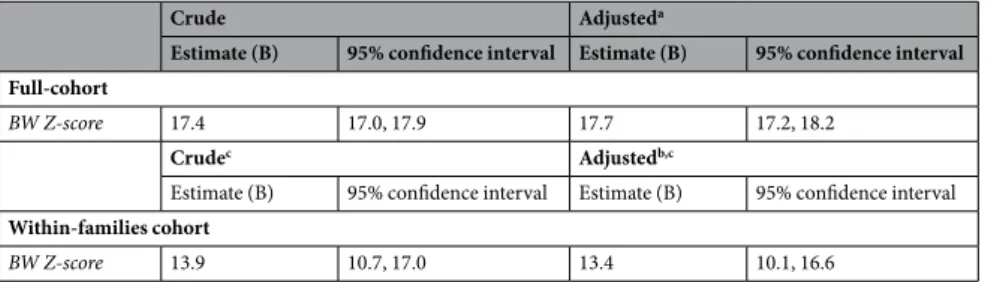
Table 2 presents the crude and adjusted associations between birth weight z-score and grip strength (N), both for the full- and for the within-family cohort. Higher birth weight, within the at-term range, was associated with higher grip strength, with slightly weaker associations in the within-families cohort (24% reduction). In the fully adjusted model, each unit increase in birth weight z-score (1 SD) was associated with increases of 17.7 (95% CI, 17.3–18.2) and 13.4 (10.1–16.6) in N (equal to approximately 1.8 and 1.4 kilogram-force) in the full- and within-families cohort, respectively.www.nature.com/scientificreports
www.nature.com/scientificreports/
Figure 2 illustrates adjusted associations, estimated with restricted cubic spline models, between birth weight z-scores and grip strength (N) for both the full- and within-families cohorts. Association are in general linear in both cohorts. The detected statistical deviation from linearity (p < 0.05) can largely be explained by the large number of observations.
Table 3 presents both the crude and adjusted association between birth weight z-score, within the at-term range, and grip strength (N), stratified by four BMI categories: underweight (BMI <18.5), normal weight (BMI 18.5–24.9), overweight (BMI 25–29.9) and obese (BMI >30). Although some diminution in the underweight category, we observed consistent positive associations between birth weight z-score, within the at-term range, and grip strength across all categories of BMI. As expected, we observed no interaction between continuous BMI and z-score birth weight in the association with grip-strength (data not shown).
sensitivity analysis.
Supplementary Table 2 presents the linear association between birth weight z-score, within the at-term range, and grip strength, stratified by quartiles of height (cm) at conscription. Although some attenuation across the whole range of height, we observed a consistent positive association between birth weight z-score, within the at-term range, and grip strength regardless of the quartile of height.Discussion
This total population-based study of 144,369 males showed that higher birth weight, within the at-term range (i.e. week 37 to 41), was prospectively and positively associated with grip strength in young adulthood (17–22 years) across all categories of BMI. Moreover, our within-sibling analysis, indicates that this association appears to be mainly driven by factors that are not shared between siblings. Consequently, the present study provides novel evidence to this emerging field. To the best of our knowledge, this is the first study that has examined associations
Characteristic Full cohort
High grip strength and High birth weighta
High grip strength and Low birth weighta
Low grip strength and High birth weighta
Low grip strength and Low birth weighta
N = 144,369 N = 41,535 N = 32,723 N = 30,801 N = 39,310
Gestational age (weeks), mean (SD) 39.6 (1.1) 39.6 (1.1) 39.6 (1.1) 39.6 (1.1) 39.6 (1.1)
Birth weight (g), mean (SD) 3,573.9 (486.4) 3,953.0 (347.5) 3,245.3 (300.1) 3,901.4 (329.0) 3,190.2 (329.6)
Handgrip strength (N), mean (SD) 614.3 (97.4) 693.6 (70.2) 681.2 (63.4) 540.6 (51.1) 532.7 (54.3)
BMI (kg/m²) at conscription, mean (SD) 22.1 (3.0) 22.9 (3.0) 22.6 (3.0) 21.6 (2.9) 21.3 (2.9)
Height (cm) at conscription, mean (SD) 179.7 (6.5) 182.5 (6.1) 179.7 (6.0) 179.6 (6.1) 176.7 (6.1)
Age at conscription, mean (SD) 18.3 (0.4) 18.3 (0.4) 18.3 (0.4) 18.3 (0.4) 18.3 (0.4)
Maternal age at birth, mean (SD) 26.8 (4.8) 27.1 (4.8) 26.3 (4.7) 27.4 (4.9) 26.5 (4.8)
Maternal parity, median (IQR) 2.0 (1.0, 2.0) 2.0 (1.0, 2.0) 1.0 (1.0, 2.0) 2.0 (1.0, 2.0) 2.0 (1.0, 2.0)
Maternal diabetes mellitus at pregnancy, n (%) 382 (0.3%) 134 (0.3%) 46 (0.1%) 110 (0.4%) 92 (0.2%)
Birth by cesarean section, n (%) 9,556 (6.6%) 2,384 (5.7%) 2,119 (6.5%) 1,929 (6.3%) 3,124 (7.9%)
Maternal hypertension at pregnancy, n (%) 60 (<1%) 16 (<1%) 15 (<1%) 12 (<1%) 17 (<1%)
Parental highest level of education, n (%)
Primary education ≤10 years 22,470 (15.6%) 6,430 (15.5%) 5,240 (16.0%) 4,689 (15.2%) 6,111 (15.5%) Secondary education ≤2-years 47,849 (33.1%) 13,796 (33.2%) 11,174 (34.1%) 9,801 (31.8%) 13,078 (33.3%) Secondary education >2 years 23,991 (16.6%) 6,722 (16.2%) 5,438 (16.6%) 5,144 (16.7%) 6,687 (17.0%) University level 50,059 (34.7%) 14,587 (35.1%) 10,871 (33.2%) 11,167 (36.3%) 13,434 (34.2%)
Table 1. Characteristics of the Full Cohort by Birth Weight (Z-score) and Grip Strength (Newton), Swedish
Males Born At-term Between 1973–1976. Abbreviations: SD indicates standard deviation; IQR indicates inter-quartile range. aGestational age specific birth weight z-scores estimated using the total study population as the
reference.
Crude Adjusteda
Estimate (B) 95% confidence interval Estimate (B) 95% confidence interval Full-cohort
BW Z-score 17.4 17.0, 17.9 17.7 17.2, 18.2
Crudec Adjustedb,c
Estimate (B) 95% confidence interval Estimate (B) 95% confidence interval
Within-families cohort
BW Z-score 13.9 10.7, 17.0 13.4 10.1, 16.6
Table 2. Associations between birth weight z-score and grip strength (Newton) in young Swedish males born
at-term between 1973–1976. Abbreviations: BW indicates Birth Weight. aAdjusted for: parity, maternal age,
maternal diabetes, maternal hypertension, cesarean section, conscription office and highest parental education.
of variations in the levels of grip strength, across all BMI categories, in young adulthood across different birth weights within the at-term range, using family-based analysis which provides a unique opportunity to explore whether this association is mainly driven by factors that are shared or non-shared between siblings. Although this study cannot disentangle causal pathways, grip strength may to some extent be determined already in utero.
Explanations for the protective and lifelong effect that birth weight, within the at-term range, seems to have on grip strength could be that the number of mammalian muscle fibers is determined at or soon after birth22 and
influenced by nutritional status during critical periods of early development23. This is supported by animal24 and
human studies25,26 showing a reduced muscle fiber composition in those with low birth weight. Postnatal muscle
growth (e.g. via strength exercise) occurs by growth of each muscle fiber, which to some extent can compensate a deficit in fiber number27. However, individuals born with fewer muscle fibers will be at considerable disadvantage
in terms of muscle strength later in life. In addition, low birth weight is associated with abnormal development that triggers adaptations in tissues and organs, eventually resulting in permanent muscle related physiological alterations28, which my result in long-lasting impairments in muscle strength29.
Meta-analysis data shows that grip strength has a strong genetic component with an estimated heritability of approximately 50%30. Likewise, a common genetic cause of both low birth weight and low grip strength cannot be
excluded. However, results from our within-sibling analysis, where shared influences between siblings such as genetic factors, parental socioeconomic influences etc. are held constant, only differed marginally from analyses based on the full cohort. This provides some support to the hypothesis that shared factors between siblings most likely only explain part of the observed associations between birth weight, within the at-term range, and grip strength These findings support the notion that a poor intrauterine nutrition leading to a low birth weight for gestational age is programming grip strength later in life. However, twin-pair analyses are needed to further detangle the genetic and in utero effects that may explain the association between birth weight, within the at-term range, and later grip strength.
n
Crude Adjusteda
Estimate (B) 95% confidence interval Estimate (B) 95% confidence interval BW Z-score
Underweight (BMI <18.5) 8,980 11.4 9.6, 13.2 11.2 9.4, 13.0 Normal weight (BMI 18.5–24.9) 115,623 15.7 15.1, 16.2 15.9 15.4, 16.4 Overweight (BMI 25–29.9) 15,663 17.2 15.7, 18.8 17.4 15.8, 19.0 Obese (BMI ≥30) 3,484 18.8 15.4, 22.1 18.5 15.1, 21.9
Table 3. Linear associations between birth weight z-score and grip strength (Newton) stratified by body mass
index categories at conscription in young Swedish males born at-term between 1973–1976. Abbreviations: BMI indicates Body Mass Index; BW indicates Birth Weight. aAdjusted for: parity, maternal age, maternal diabetes,
maternal hypertension, cesarean section, conscription office and highest parental education.
Figure 2. Adjusted associations, estimated with restricted cubic spline models, between birth weight z-scores
and grip strength (Newton) for (A) the full-cohort, and (B) the within-families cohort (B) (95% confidence interval dashed).
www.nature.com/scientificreports
www.nature.com/scientificreports/
The observed associations between birth weight, within the at-term range, and grip strength may partly be explained by differences in upbringing between children born adequate and small for gestational age. For example, parents may choose to restrict low birth weight children’s participation in strength promoting physical activity because of perceptions of fragility31. Consequently, varying levels of engagement in strength promoting
physical activity among the study population may to some extent explain observed association between birth weight, within the at-term range, and grip strength in young adulthood. Our finding that birth weight, within the at-term-range, is associated with grip strength in young adulthood across all BMI categories suggests that this association is not simply explained by a skeletal size effect, since larger persons tend to have larger muscles. This is further supported by our sensitivity analysis showing a consistent positive association between birth weight z-score, within the at-term range, and grip strength regardless of the quartile of height.
The study of early determinants of grip strength is of special interest since low grip strength in adolescence is strongly associated with a wide range of negative health outcomes later in life, including increased all-cause mor-tality rates equivalent to that for well-established risk factors such as elevated blood pressure or BMI8. Previous
data has shown that higher grip strength essentially attenuates the negative effects from elevated BMI on mortal-ity in men11. The weakest men (lowest fifth) in the most obese group has shown to have a 39% increased mortality
risk (HR, 1.39; 95% CI, 1.14–1.68) and this risk was negligible among the strongest men (highest fifth) in the same most obese group (HR, 1.02; 95% CI, 0.84–1.25). Consequently, findings from this study showing that birth weight, even within at-term deliveries, is associated with grip strength in young adulthood across all categories of BMI, may be of public health interest.
The 17.7 unit increase in grip strength (N) for each SD increase in birth weight z-score reported in this study, translates into approximately a two kilogram stronger grip strength. This may have clinically important impli-cations. For example, data from the U.K. Biobank study in over 400,000 adults aged 40–69 years has shown that every three kilogram increment in grip strength was associated with approximately 8% lower mortality32. Since
approximately 15% of all live births are low birth weight births33, which are associated with lifelong health
conse-quences34,35, preventing low birth weights, even within the at-term range, may have long-term effects on markers
of health such as grip strength. It is of importance to state that not all low preterm or low birth weights can or should be prevented, for example spontaneously occurring births. However, recent trends towards shorter ges-tational lengths within the at‐term range can to some extent be attributed to the increases in the rates of planned cesarean deliveries36, which is a modifiable factor.
Studies investigating the associations between birth weight or gestational age and grip strength have been con-fined to grip strength comparisons between preterm births, not taking gestational age into account, and at-term born being used as homogenous comparator15. For example, a meta-analysis, including 17 studies and 21,344
individuals aged 5 to 86 years, showed that an extra kilogram of birth weight was associated with a 0.9 kilogram increase (95% C, 0.58, 1.2) in grip strength. However, none of the included studies did control for shared factors in within-sibling analyses and/or investigate the associations between birth weight, within the at-term range, and grip strength and/or whether associations varied with BMI. Thus far, only one small cohort study has demon-strated that within a twin-pair the heavier twin at birth has greater grip strength in adult life compared with the lighter sibling. In addition, the twin-pair analyses showed that associations between birth weight and adult grip strength were stronger in dizygotic than monozygotic twin-pairs, suggesting a potential influence of genetic fac-tors, acting on both birth weight and adult grip strength37. Similarly, we found evidence for a stronger association
between birth weight, within the at-term range, and grip strength in young adulthood in all included men com-pared with the within-sibling analysis including men who had one or more matchable male sibling/s.
The strengths of this study lies in the large sample size and accompanying statistical power. Furthermore, strengths include the population-based design and the long-term follow-up, where prospectively collected data at birth could be linked to grip strength at ages 17–22. We were also able to adjust for perinatal and other major determinants (e.g. birth delivery, parental education, parity etc.) of grip strength and the within-sibling analysis enabled us to disentangle whether associations were mainly driven by factors shared or non-shared between siblings. Furthermore, both exposure (birth weight within the at-term range) and outcome (grip strength) were measured using objective and standardized procedures. In fact, grip strength is the test of muscular strength that has shown the strongest evidence in relation to mortality38–40. Finally, we rule out confounding by gestational age
and/or prematurity by using births within the at-term range.
This study is accompanied with several limitations. First, the cohort included only young adult men and the potential generalizability to women is largely unknown. Previous data has shown that the magnitude of asso-ciation between birth weight and adult grip strength in women is approximately half of that seen in men37,41.
Second, residual confounding could be present. For example, the lack of data on maternal nutrition and smoking habits (of mothers before/during pregnancy), could have had an impact on both the exposure (birth weight) and outcome (grip strength). However, smoking is more prevalent in families with low parental education. Thus, some of the effect of smoking on grip strength is accounted for in our models. Moreover, the within-families analysis accounts for habits (e.g. maternal smoking) that are consistent over time. Fourth, the within-families analysis including siblings only allow us to partly control for shared genetic factors (50%) between siblings. It is unlikely that segregating genes, potentially influencing grip strength, are randomly distributed with regards to birth weight. Fifth, since the birth factors were recorded in the 70’s, gestational age was estimated by the last menstrual period, which has limited accuracy. This may affect our precision in determining the at-term range. Sixth, register-based studies have inherited limitations, e.g. unknown data quality and possible differences in data collection between institutions. Finally, it should be noted that we did not measure engagement in strength promoting physical activity, which can influence grip strength. Hence, it is possible that the associations between birth weight, within the at-term range, and grip strength in young adulthood may be mediated by engagement in strength promoting physical activity.
Conclusions
In summary, this large prospective cohort study has shown that higher birth weight, within the at-term range, is prospectively associated with higher grip strength in young male adults, across all categories of BMI and var-iations in height. Furthermore, our within-family analysis has shown that this association appears to be mainly driven by factors that are not shared between siblings, reducing the likelihood that this association is largely explained by genetics and other environmental factors shared within families. There are undeniably clinically relevant and strong prospective associations between grip strength in adolescence and later life health outcomes. Consequently, our novel findings both expand our understanding of determinants of grip strength and may have public health implications. For example, highlighting the importance of birth weight and heterogeneity among at-term deliveries, which have implications for how at-term deliveries are followed-up and monitored.
Data Availability
The data that support the findings of this study are available from the Swedish National Board of Health and Wel-fare (Medical birth data), Swedish Defence Recruitment Agency (anthropometric and strength measures), Sta-tistics Sweden (linking of parental data and covariate data) but restrictions apply to the availability of these data, which were used under license for the current study, and so are not publicly available. Data are however available from the authors upon reasonable request and with permission of Swedish National Board of Health and Welfare, Swedish Defence Recruitment Agency, Statistics Sweden and the Regional Ethical Review Board, Stockholm.
References
1. Risnes, K. R. et al. Birthweight and mortality in adulthood: a systematic review and meta-analysis. Int J Epidemiol 40, 647–661,
https://doi.org/10.1093/ije/dyq267 (2011).
2. Kajantie, E., Strang-Karlsson, S., Evensen, K. A. I. & Haaramo, P. Adult outcomes of being born late preterm or early term - What do we know? Semin Fetal Neonat M 24, 66–83, https://doi.org/10.1016/j.siny.2018.11.001 (2019).
3. Hofman, P. L. et al. Premature birth and later insulin resistance. N Engl J Med 351, 2179–2186, https://doi.org/10.1056/
NEJMoa042275 (2004).
4. Raju, T. N. K., Buist, A. S., Blaisdell, C. J., Moxey-Mims, M. & Saigal, S. Adults born preterm: a review of general health and system-specific outcomes. Acta Paediatr 106, 1409–1437, https://doi.org/10.1111/apa.13880 (2017).
5. Yang, S., Bergvall, N., Cnattingius, S. & Kramer, M. S. Gestational age differences in health and development among young Swedish men born at term. Int J Epidemiol 39, 1240–1249, https://doi.org/10.1093/ije/dyq070 (2010).
6. Spong, C. Y. Defining “term” pregnancy: recommendations from the Defining “Term” Pregnancy Workgroup. Jama 309, 2445–2446,
https://doi.org/10.1001/jama.2013.6235 (2013).
7. Zhang, X. & Kramer, M. S. Variations in mortality and morbidity by gestational age among infants born at term. J Pediatr 154, 358–362, 362 e351, https://doi.org/10.1016/j.jpeds.2008.09.013 (2009).
8. Ortega, F. B., Silventoinen, K., Tynelius, P. & Rasmussen, F. Muscular strength in male adolescents and premature death: cohort study of one million participants. BMJ 345, e7279, https://doi.org/10.1136/bmj.e7279 (2012).
9. Garcia-Hermoso, A. et al. Muscular Strength as a Predictor of All-Cause Mortality in an Apparently Healthy Population: A Systematic Review and Meta-Analysis of Data From Approximately 2 Million Men and Women. Archives of physical medicine and
rehabilitation 99, 2100–2113 e2105, https://doi.org/10.1016/j.apmr.2018.01.008 (2018).
10. Leong, D. P. et al. Prognostic value of grip strength: findings from the Prospective Urban Rural Epidemiology (PURE) study. Lancet
386, 266–273, https://doi.org/10.1016/S0140-6736(14)62000-6 (2015).
11. Kim, Y. et al. Independent and joint associations of grip strength and adiposity with all-cause and cardiovascular disease mortality
in 403,199 adults: the UK Biobank study. American Journal of Clinical Nutrition 106, 773–782, https://doi.org/10.3945/
ajcn.117.156851 (2017).
12. Artero, E. G. et al. Criterion-related validity of field-based muscular fitness tests in youth. J Sports Med Phys Fitness 52, 263–272 (2012).
13. Wind, A. E., Takken, T., Helders, P. J. M. & Engelbert, R. H. H. Is grip strength a predictor for total muscle strength in healthy children, adolescents, and young adults? Eur J Pediatr 169, 281–287, https://doi.org/10.1007/s00431-009-1010-4 (2010). 14. Newman, A. B. et al. Strength, but not muscle mass, is associated with mortality in the health, aging and body composition study
cohort. J Gerontol a-Biol 61, 72–77, https://doi.org/10.1093/gerona/61.1.72 (2006).
15. Dodds, R. et al. Birth weight and muscle strength: a systematic review and meta-analysis. J Nutr Health Aging 16, 609–615 (2012). 16. National Board of Health Welfare. The Swedish Medical Birth Register–A summary of content and quality. (National Board of Health
and Welfare Stockholm, Sweden, 2003).
17. Neovius, M., Kark, M. & Rasmussen, F. Association between obesity status in young adulthood and disability pension. Int J Obes
(Lond) 32, 1319–1326, https://doi.org/10.1038/ijo.2008.70 (2008).
18. Alexander, G. R., Himes, J. H., Kaufman, R. B., Mor, J. & Kogan, M. A United States national reference for fetal growth. Obstet
Gynecol 87, 163–168, https://doi.org/10.1016/0029-7844(95)00386-X (1996).
19. Höök, O. & Tornvall, G. Apparatus and method for determination of isometric muscle strength in man. Scand J Rehabil Med 1, 139–142 (1969).
20. Hogstrom, G., Nordstrom, A. & Nordstrom, P. Aerobic fitness in late adolescence and the risk of early death: a prospective cohort study of 1.3 million Swedish men. Int J Epidemiol 45, 1159–1168, https://doi.org/10.1093/ije/dyv321 (2016).
21. WHO. Vol. Technical report series 2000; 894: i-xii, 1–253 (ed Report of a WHO consultation.) (World Health Organization, 2000). 22. Gollnick, P. D., Timson, B. F., Moore, R. L. & Riedy, M. Muscular enlargement and number of fibers in skeletal muscles of rats. J Appl
Physiol Respir Environ Exerc Physiol 50, 936–943, https://doi.org/10.1152/jappl.1981.50.5.936 (1981).
23. Gale, C. R., Martyn, C. N., Kellingray, S., Eastell, R. & Cooper, C. Intrauterine programming of adult body composition. J Clin
Endocrinol Metab 86, 267–272, https://doi.org/10.1210/jcem.86.1.7155 (2001).
24. Wigmore, P. M. & Stickland, N. C. Muscle development in large and small pig fetuses. J Anat 137(Pt 2), 235–245 (1983).
25. Jensen, C. B., Storgaard, H., Madsbad, S., Richter, E. A. & Vaag, A. A. Altered skeletal muscle fiber composition and size precede whole-body insulin resistance in young men with low birth weight. J Clin Endocrinol Metab 92, 1530–1534, https://doi.org/10.1210/ jc.2006-2360 (2007).
26. Patel, H. P. et al. Developmental influences, muscle morphology, and sarcopenia in community-dwelling older men. J Gerontol A
Biol Sci Med Sci 67, 82–87, https://doi.org/10.1093/gerona/glr020 (2012).
27. Schiaffino, S., Dyar, K. A., Ciciliot, S., Blaauw, B. & Sandri, M. Mechanisms regulating skeletal muscle growth and atrophy. FEBS J
280, 4294–4314, https://doi.org/10.1111/febs.12253 (2013).
28. Behrman, R. E., Butler, A. S. The National Academies Collection: Reports funded by National Institutes of Health (2007).
29. Lewandowski, A. J. et al. Preterm heart in adult life: cardiovascular magnetic resonance reveals distinct differences in left ventricular
www.nature.com/scientificreports
www.nature.com/scientificreports/
30. Zempo, H. et al. Heritability estimates of muscle strength-related phenotypes: A systematic review and meta-analysis. Scand J Med
Sci Sports 27, 1537–1546, https://doi.org/10.1111/sms.12804 (2017).
31. Rogers, M., Fay, T. B., Whitfield, M. F., Tomlinson, J. & Grunau, R. E. Aerobic capacity, strength, flexibility, and activity level in unimpaired extremely low birth weight (<or = 800 g) survivors at 17 years of age compared with term-born control subjects.
Pediatrics 116, e58–65, https://doi.org/10.1542/peds.2004-1603 (2005).
32. Kim, Y. et al. Independent and joint associations of grip strength and adiposity with all-cause and cardiovascular disease mortality in 403,199 adults: the UK Biobank study. Am J Clin Nutr 106, 773–782, https://doi.org/10.3945/ajcn.117.156851 (2017).
33. International Food Policy Research Institute (IFPRI). (International Food Policy Research Institute, Washington, 2015).
34. Vu, H. D., Dickinson, C. & Kandasamy, Y. Sex Difference in Mortality for Premature and Low Birth Weight Neonates: A Systematic Review. Am J Perinat 35, 707–715, https://doi.org/10.1055/s-0037-1608876 (2018).
35. Whincup, P. H. et al. Birth Weight and Risk of Type 2 Diabetes A Systematic Review. Jama-J Am Med Assoc 300, 2886–2897, https://doi. org/10.1001/jama.2008.886 (2008).
36. Pyykonen, A. et al. Cesarean section trends in the Nordic Countries - a comparative analysis with the Robson classification. Acta
Obstet Gynecol Scand 96, 607–616, https://doi.org/10.1111/aogs.13108 (2017).
37. Ridgway, C. L. et al. The contribution of prenatal environment and genetic factors to the association between birth weight and adult grip strength. PLoS One 6, e17955, https://doi.org/10.1371/journal.pone.0017955 (2011).
38. Fujita, Y. et al. Physical-Strength Tests and Mortality among Visitors to Health-Promotion Centers in Japan. J Clin Epidemiol 48,
1349–1359, https://doi.org/10.1016/0895-4356(95)00533-1 (1995).
39. Katzmarzyk, P. T. & Craig, C. L. Musculoskeletal fitness and risk of mortality. Med Sci Sport Exer 34, 740–744, https://doi. org/10.1097/00005768-200205000-00002 (2002).
40. Metter, E. J., Talbot, L. A., Schrager, M. & Conwit, R. Skeletal muscle strength as a predictor of all-cause mortality in healthy men. J
Gerontol a-Biol 57, B359–B365, https://doi.org/10.1093/gerona/57.10.B359 (2002).
41. Kuh, D. et al. Birth weight, childhood size, and muscle strength in adult life: evidence from a birth cohort study. Am J Epidemiol 156, 627–633, https://doi.org/10.1093/aje/kwf099 (2002).
Acknowledgements
D.B. conceived and designed the current study and wrote and was involved in data analyses. V.A. performed the statistical analyses and was involved in manuscript writing and editing. P.T. was involved in statistical analyses. M.P., F.B.O. and C.M. critically revised the manuscript and commented on the statistical analyses. All authors approved the final manuscript.
Additional Information
Supplementary information accompanies this paper at https://doi.org/10.1038/s41598-019-46200-0.
Competing Interests: The authors declare no competing interests.
Publisher’s note: Springer Nature remains neutral with regard to jurisdictional claims in published maps and
institutional affiliations.
Open Access This article is licensed under a Creative Commons Attribution 4.0 International
License, which permits use, sharing, adaptation, distribution and reproduction in any medium or format, as long as you give appropriate credit to the original author(s) and the source, provide a link to the Cre-ative Commons license, and indicate if changes were made. The images or other third party material in this article are included in the article’s Creative Commons license, unless indicated otherwise in a credit line to the material. If material is not included in the article’s Creative Commons license and your intended use is not per-mitted by statutory regulation or exceeds the perper-mitted use, you will need to obtain permission directly from the copyright holder. To view a copy of this license, visit http://creativecommons.org/licenses/by/4.0/.