Biomedical Science
Faculty of Health and Society Malmö University
SE-205 06 Malmö Sweden
Master programme in Biomedical Surface Science http://edu.mah.se/en/Program/VABSE
2020-28-05 Master degree thesis, 30 ECTS
Examensarbete, 30 hp
Biophysical differences between COPD, CF and
healthy airways mucus
Vladislav Genevskiy
SUPERVISORS:
2 AUTHOR: Vladislav Genevskiy
ABSTRACT
An improved understanding of the mucus biophysical alteration in chronic obstructive pulmonary disease (COPD) and cystic fibrosis (CF) patients is a milestone towards a more accurate and effective treatment of these common and highly debilitating conditions. Little is known about the variations in mucus structure between ill and healthy individuals. An established fact, however, is the role of the mucus obstruction in the exacerbation of the two conditions which impairs the physiological cleaning mechanism of the airways (mucociliary clearance) and is assessed as the strongest predictor of mortality. Therefore, it appears relevant to investigate which properties and structural changes are responsible of the impaired clearance of airway mucus. This thesis presents investigations of mucus on the basis of mucin structure observed in healthy, COPD and cystic fibrosis bronchial mucus samples. AFM (atomic force microscopy) and synchrotron SAXS (small angle X-ray scattering) techniques were used to characterise the structural features of the mucin molecules and allowed to identify the dumbbell structure of airways mucin monomers. The analysis of structural and dimensional features of mucins, highlighted a greater similarity of COPD with the healthy sample rather than with cystic fibrosis. The water sorption analysis using QCM-D (quartz crystal microbalance with
dissipation monitoring), established a divergent behaviour between COPD and cystic fibrosis. Compared to healthy specimen, the mucus from COPD donors, showed a greater tendency to absorb water while cystic fibrosis mucus, in contrast, displayed the lowest water absorption.
Keywords: CF, COPD, mucus, structure.
This master thesis has been defended on June 4, 2020 at the Faculty of Health and Society, Malmö University.
Opponent: Assoc. Prof. Javier Sotres
Biomedical Laboratory Science and Technology Faculty of Health and Society
3
TABLE OF CONTENTS
Biophysical differences of COPD, CF and healthy airways mucus. ... 1
TABLE OF CONTENTS ... 3
INTRODUCTION ... 4
MATERIALS and METHODS ... 6
Mucus ... 6
QCM-D ... 7
Spin coating ... 9
Synchrotron SAXS/WAXS ... 9
AFM ... 11
Preparation of SAXS samples ... 12
RESULTS ... 13 AFM ... 13 SAXS - WAXS ... 17 QCM-D ... 22 DISCUSSION ... 26 CONCLUSIONS ... 30 Acknowledgements ... 31 REFERENCES... 32
4
INTRODUCTION
Mucus is a viscoelastic gel secretion formed by a complex matrix of interacting mucins: long, linear and heavily glycosylated proteins. Although different types of mucins take part to the formation of the mucus layer in gastrointestinal, cervical and respiratory compartments, they share a common purpose: protect the non-keratinized mucosal epithelia from the external environment and from
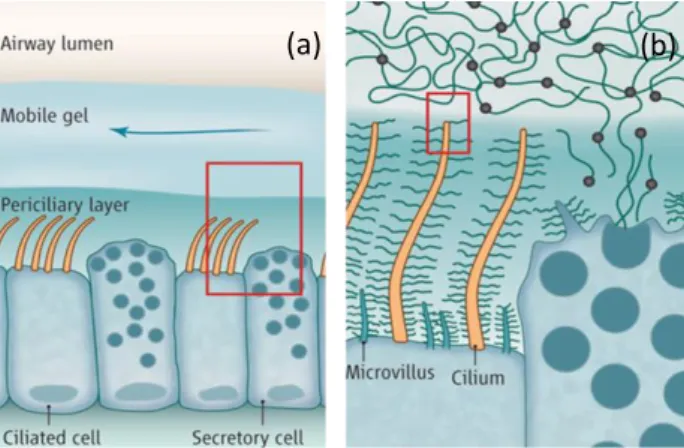
dehydration (1) (2). In the airways, the protective mucus layer serves mostly as a barrier to entrap extraneous particles and pathogens and to dissolve harmful gases, promoting their expulsion through ciliary clearance and cough (3). In the large airways (luminal diameter > 2 mm), submucosal glands contribute to the secretion of mucins and liquid to form a barrier known as the airway surface liquid (ASL). This protective coating is constituted by two layers (Figure 1); the periciliary layer and the mucus gel layer. The first one lies directly over the epithelia cells and has a constant thickness of 7 µm (4).
This serves as a medium for the cilia to be fully extended and to allow them to beat at their physiological frequency to propel the mucus. The mucus lies above the periciliary layer, separated by a thin surfactant film and has a changing thickness which increases from distal to proximal region, from 0.5 to 5 µm. Water is the major component, making out up to 95 %, while the remaining material is formed primarily by mucins, generally no more than 5 % (5) and a small amount of salts, lipids, other proteins, and cellular debris (4). In the airways, besides the presence of many different types of mucins, such as MUC1, MUC4 and MUC16 (6,7), the two main expressed gel-forming mucins are MUC5AC and MUC5B. As in most of the secreted mucins, the backbone is formed by high levels of serine and threonine amino acids (8) to which glycans bind via O-glycosylation, a covalent bonding that occurs through N-Acetyl galactosamine (GalNAC) between sugars and the hydroxyl groups present on the amino acids. The oligosaccharides, whose length is about 2.5 nm (9), arrange in a radial way with respect to the peptide backbone forming therefore a structure resembling a brush. The carbohydrates account for ~80 % of the mucin’s weight and each chain is composed of 10 to 100 monomers. Their presence not only affects the elongated configuration and the relatively rigid behaviour of the molecule but it also serves
Figure 1. Schematic representation of the airway epithelial surface. (a) The gel lying on top of the cells is formed by two layers: the periciliary layer and mucus mobile gel. (b) Detail of the cilia responsible of the propulsion of mucus. Picture adapted from reference (3).
5 as a shielding against proteases, sequestering of pathogens as well as ion and water binding (1). MUC5AC and MUC5B belong to the group of the five secreted mucins having cysteine-rich terminal domains which allow them to form
homotypic polymers by disulphide bonding and generate the gel-like structure of mucus. The disulphide interaction between two mucins yields to dimers which further polymerize to form linear or branched multimers. In addition to the chemical interaction, the mucus matrix is held together by the numerous tangles that linear chains of mucin form by overlapping on each other, as well as by minor electrostatic and hydrophobic interactions. This complex nature and the large size of the molecule, made mucin characterisation inappropriate with traditional methods for protein studies, such as NMR and crystallography (10).
Despite the importance of the mucus layer to maintain a correct hygiene of the airways, paradoxically, hypersecretion of bronchial mucus is also cause of severe respiratory complications. A rising burden for health care system is chronic obstructive pulmonary disease (COPD). According to the Global Initiative for Chronic obstructive lung disease (GOLD), COPD, considered the fourth cause of death in the world, is a highly debilitating and progressive illness affecting more than 300 million people worldwide (11). The pathogenesis of COPD has been linked to tobacco smoke exposure and high air pollution (12), and its severity, based on the forced expiratory volume in one second (FEV1), has been evaluated according to 4 stages where the 1st indicates a mild disease while the 4th
represents a severe condition requiring hospitalization. COPD is an umbrella term and encloses three major clinical phenotypes: emphysema, chronic bronchitis and asthma. The major feature characterizing COPD is the persistent and progressive airflow limitation which is associated with a chronic inflammation response in the airways and lungs to harmful particles and gases (13). The inflammation leads to the destruction of parenchymal tissue (typical of emphysema) and to disruption of defence and repair mechanisms of lungs resulting in small airway fibrosis. Despite the broad variety of symptoms that arise from COPD, one of the strongest
predictor of mortality in advanced COPD patients, results to be mucus obstruction (14). The worsening of the airflow due to the remodelling of the small airways, combined with mucus hypersecretion and poor mucociliary clearance (15) is one of the leading causes of mucus stagnation. This, in turn, promotes a favourable environment for bacterial and viral infections and therefore exacerbations and premature death in COPD patients (16) (14). Along with COPD, another
condition characterised by the thickening of mucus and the impaired mucociliary clearance is cystic fibrosis (CF). In contrast to COPD, cystic fibrosis is a genetic disorder and it affects the lungs as well as the digestive system (17). An impaired function of the CFTR (cystic fibrosis transmembrane conductance regulator), a transmembrane protein responsible for the transport of chloride ions, is considered to be the main cause of low water content and thickening of mucus in cystic fibrosis (18).
Currently, there is no evidence that changes in mucin composition affect the advancement of the disease although the biophysical properties of airways mucus are largely influenced by the polymeric components. Observations suggest that alterations of structural properties, such as the unfolding and swelling of the gel-forming polymers, may compromise the mucociliary-transport qualities by affecting mucus hydration and viscosity. The research and the study of large
6 proteoglycans as mucins has been for a long time overlooked due to the lack of suitable physiochemical methods for characterisation. The traditional methods applicable for homogeneous systems of proteins, such as light scattering,
electrophoresis, or chromatography, result to be less appropriate for the study of polysaccharides due to the heterogeneousness in length, electrical charge, and the degree of branching of mucins. So far, the research on mucus has been focused essentially on the biochemistry and biology of the isolated mucins. Polymer gels, however, like the bronchial mucus, turn out to possess completely new properties if compared with the singular building units taken alone; a new array of properties arise from polymer-polymer and polymer-solvent interaction (19), suggesting that the investigation on individually taken and purified mucins would not explain the complex behaviour and multiple structural features of an intricate substance such as mucus. Additionally, procedures like the purification of mucins involves usually the use of chaotropic agents, which cause the rupture of non-covalent bonding between the different component of the molecule, and the mucins are removed by centrifugation or chromatography (20). For the original structure and folding of proteins to be maintained, is therefore important to reduce the
chemically invasive preparation techniques.
The purpose of this project is to propose different experimental approaches that could shed light on biophysical alterations in bronchial mucus structure of COPD and cystic fibrosis patients and draw a comparison with healthy case, providing a possible pilot study for the feasibility of a larger scale project. In the following experiment synchrotron small/wide-angle X-ray scattering (SAXS) and (AFM) were employed to study the non-purified mucus samples in order characterise the size, shape and configuration of the gel-forming molecules in their original state. Since mucus is a water-based gel, it is of significant value to investigate the potential variation in water sorption capacity among different types of mucus. For this, quartz crystal microbalance with dissipation monitoring (QCM-D) was employed to obtain the hydration isotherms where the water content of mucus at different relative humidities are determined. The experiments were carried out on original mucus from both pathological and healthy donors as well as sample obtained from cell-cultures.
MATERIALS and METHODS
Mucus
In this study different bronchial mucus samples were examined. Donor mucus samples were provided by the clinical site of Kliniken Essen-Mitte, Evang - Huyssens-Stiftung/Knappschaft gGmbH, GER; they were collected exclusively in the context of clinical examination as bronchoscopy or elective surgery requiring the use of endotracheal tubes. Three samples in total were shipped on dry ice: one sample from healthy donors and two samples from donors with COPD diagnosed. All the samples were collected from different individuals. The healthy sample, collected from tube-tip after surgery, was the following:
• Donor healthy, male, 78 y/o, chronic heart failure, ex-smoker (>10 years ago) – approximately 0.2 mL.
7 The samples from the COPD donors, collected during bronchoscopy, were the following:
• Donor COPD1, female, 57 y/o, COPD GOLD III, exacerbation visit, smoker (undefined volume > 0.5 mL).
• Donor COPD2, female, 80 y/o, COPD GOLD II, control-visit, planned bronchoscopy, ex-smoker (undefined volume > 0.5 mL).
Additionally to donor mucus samples, mucus collected from different cultures of human airway epithelial bronchial cells (Epithelix, Geneve, Switzerland) was analysed. The mucus was collected from in vitro fully differentiated tissues of the human respiratory tract, obtained from primary cells of donors. The collection of the samples was performed by adding 55 µL of saline solution on the apical
surface and collecting it again. The samples used in this study were the following: • Cell-culture healthy, sample from bronchial cells, healthy donor, 61 y/o,
male, non-smoker.
• Cell-culture cystic fibrosis (CF), sample from bronchial cells, Cystic Fibrosis donor (mutation 2184ΔA + W1282X), 21 y/o, Female, non-smoker.
• Cell-culture COPD, sample from bronchial cells, COPD donor, 76 y/o, female, smoker.
Each sample contained 1 mL of mucus.
QCM-D
Q-SensE4 instrument coupled to a QF401 flow module (Biolin scientific AB, Stockholm, SWE) was used to measure the water sorption-desorption isotherms at room temperature (25°C). The sensors used for QCM-D measurements were the QSX 303 - 5 MHz quartz crystals from Biolin Scientific AB, Stockholm, SWE. Quartz crystal microbalance with dissipation monitoring is a technique used to investigate the mass and the thickness of the film deposited on the sensor as well as its viscoelastic properties. The resonance frequency is monitored in real time and provides a nano-sensitive information on the adsorbed mass on the crystal sensor. The mass variation on the surface is measured as change in frequency occurring when molecules are absorbed or desorbed from the deposited layer. Viscoelastic properties are measured using the dissipation-energy monitoring, known as “damping”. Dissipation is calculated measuring the time needed to the crystal to stop the oscillating motion once the power source is turned off. The more rigid is the film the better it follows the oscillation of the sensor and
therefore a smaller dissipation occurs. On the contrary softer films are more easily deformable which gives a higher dissipation (21). Among the possible
applications of QCM-D technology, particularly interesting for the study of biofilms as is the case of mucus, is the ability to monitor its water uptake in equilibrium conditions at a given relative humidity (RH) and at constant
temperature. This allows to investigate and compare the water-sorption behaviour of mucus gel in healthy and diseased subjects. The change in oscillating frequency (Δf) of the crystal is related to mass uptake (or mass loss) on its surface is
8 measured using the Sauerbrey relation where these two parameters are linearly related to each other:
𝛥𝑓 𝑛 = −
2𝛥𝑚𝑓02
𝑍𝑞
(1)
where Δf/n (Hz) is the frequency change normalized to the overtone number, f0 is the fundamental frequency of the quartz crystal depending on its thickness, m is the areal film mass (kg‧m-2) and 𝑍𝑞 is the acoustic impedance of quartz (8.8‧106 kg
m-2). The sorption-desorption procedure was performed by injecting in sequence, solutions with a controlled concentration of LiCl (SigmaAldrich, GER, Lot: MKCG0360) in order to regulate the water activity. The dilutions were made according to a previous study (22) where the water activity of LiCl solutions where correlated the salt concentration by a gravimetric analysis. The solutions used in the experiment had the following water activity values: 0.11, 0.25, 0.40, 0.55, 0.71, 0.84, 0.94, 0.98, 0.99. Each solution was injected with a flow of 0.1
mL/min until the stabilization of the overtones.
Before the sorption experiment, the uncoated sensor was measured under N2 flow
in order to determine a baseline. After the coating, the measurement started with the flow of N2 in order to include the dry mass of the layer. The latter was then
used to evaluate the mass change of water absorbed in the biofilm upon different humidity steps. The uncertainty related to the water content was calculated assuming the mass-uptake measurement unaffected by any error. The error propagation took in consideration only to the error of ±20 Hz observed during the installation and removal procedure of the sensor. The water content was expressed as:
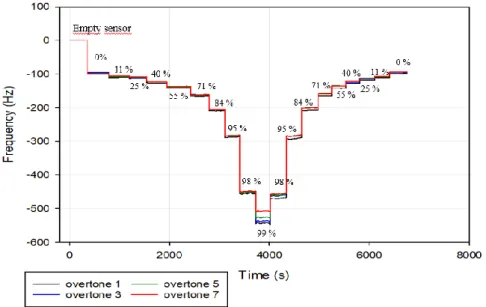
Figure 2. Change of frequency in QCM-D upon hydration and dehydration with controlled humidity values of mucus film on hydrophilic silica sensor surface.
9 𝑋𝑤 =
𝑚𝑤
𝑚𝑤 + 𝑚𝑑 (2) (1)
with 𝑚𝑤 and 𝑚𝑑 respectively the mass of water absorbed by the film and the mass of the dry sample on the sensor. Since the mass is correlated to the frequency change by a constant, the equation could be written in terms of frequencies change as
𝑋𝑤 = 𝑓𝑤
𝑓𝑤+𝑓𝑑 with 𝑓𝑑 = 𝑓𝑠 − 𝑓𝑒
(3)
where 𝑓𝑠 represents the frequency change obtained from the sensor covered with the dried sample, 𝑓𝑒 represents the frequency change obtained from the
measurement of the empty sensor and 𝑓𝑤 is the frequency change cause by the
water uptake. Given an error of ±20 Hz during the assembly of the apparatus, the error for 𝑓𝑑was calculated as the addition in quadrature of the single uncertainties, therefore:
𝛿𝑓𝑑 = √ 202+ 202 = 28.3 (4)
The uncertainty of water content (𝑑𝑋𝑤) was calculated as the derivative of
𝑋𝑤 with respect to 𝑓𝑑: 𝑑𝑋𝑤 𝑑𝑓𝑑 = − 𝑓𝑤𝑓𝑑 (𝑓𝑤+𝑓𝑑)2 and 𝑑𝑋𝑤 = − 𝑓𝑤𝑓𝑑 (𝑓𝑤+𝑓𝑑)2‧ 𝑑𝑓𝑑 (5) Spin coating
Spin coating was used to deposit the mucus samples on the quartz sensor. All the samples were diluted 1:15 times using milliQ water, exception made for the healthy donor sample which was diluted 1:30 times due to a higher number of clusters. Mucus density was approximated with the water density. The sensor, spinning at 1200 rpm, was covered by adding 20 µL of sample for five times in sequence. The sensor was then left overnight in a desiccator with silica gel for solvent evaporation.
Synchrotron SAXS/WAXS
Small and wide-angle X-ray scattering as conducted was performed at the I22 beamline at Diamond Light Source (UK) using respectively a Pilatus P3-2M and a Pilatus P3-2M-DLS-L detector. The detector to sample distance was selected in order to cover a q-range from 0.02 to 1.29 nm-1 for SAXS and from 4.37 to 61.64
10
nm-1 for WAXS where q = 4πsin 𝜃/λ with 2θ is the scattering angle while λ = 1.4
Å. In this study small angle X-ray scattering was used with the intent to identify
structural differences among the different mucus samples. SAXS is a powerful analytical technique to characterise the structure of both ordered and disordered particle systems in terms of averaged particle sizes and shapes. The samples, which can be either solid or liquid, are exposed to a collimated monochromatic X-ray beam which illuminates the sample. In case of a solution, as in this study, the sample is placed in either a quartz or a polymeric capillary. In this experiment tipped, single lumen tubes in polycarbonate were used (Precision Extrusion Inc. 12 Glens Falls Technical Park, Glens Falls, NY, Lot: 18092801-A).
Every particle present within the beam cone will send out a signal, the scattered X-ray, which is recorded on a detector placed at a known distance from the sample. The scattering occurs from the discrete electron density contrast between the particles of interest and the solvent. To obtain information regarding merely the macromolecules dissolved in the solvent, the scatter intensity from the sample holder (capillary) and the solvent are measured separately and subtracted from the overall sample intensity. What the detector records is a 2D interference pattern of the waves scattered at atoms, where the intensity differs from position to position reflecting the internal disposition of atoms in the material, as the orientation and inter-atomic distances relative to each other. When the waves arrive in phase on the detector, with constructive interference, they generate a bright spot; in case they arrive out of phase, meaning a destructive interference, the detector receives darkness. The result of the experiment is a curve, where the intensity of the scattered X-ray is plotted against the length of the scattering vector “q” which corresponds to the reciprocal space obtained as a difference of the primary and the scattered beam (23). The detected scattering intensity can be written in the
following condensed form:
∆𝐼𝑎𝑏𝑠(𝑞) = 𝐾‧𝑃(𝑞)‧𝑆(𝑞) (6)
where K is a constant bearing information about the particle volume, contrast and concentration which is important when the molecular weight is studied. P(q) is the form factor, which provides the information about the shape and the inner density distribution of the particles and S(q), the structure factor, which contains
information regarding the inter-particle interaction (24). Traditionally the
scattering experiment allows to investigate parameters as molecular weight, radius of gyration and excluded volume of the molecules. In monodisperse samples, where only one type of molecule is present, this information is directly correlated to the molecule however for polydisperse samples the information is additionally averaged over the different types of particles present in the solution, and the experimental data do not represent a single particle but instead, a combination of features of the whole. An efficient way of estimating the radius of gyration, which provides information regarding the size of the particle, is by using the Guinier analysis which involves a straight-line fitting of the log(I(q)) vs q2 curve at small q-values. In a polydisperse sample, however, the data points do not fall in straight line region and the Guinier fitting often fails. Valuable information regarding the configuration of the molecules can be extrapolated at higher q-values as well. The scattering intensity for higher q-values for many particles can be described as:
11
𝐼(𝑞) ∝ 𝑞−𝑑𝑚 (7)
Where dm is a constant. In the log(I(q)) vs log(q) plot, the relationship represents
the a linear region of which dm results to be the slope and reflects the distribution
of interatomic distances on different length scales which can be defined as the mass fractal dimension (25). The fractal dimension, can be in turn correlated to the Flory exponent as υ = 1/d; this coefficient can be between 1/3 and 1 and illustrates the quality of interactions between the polymer and the solvent. A favourable interaction with the solvent, with a Flory exponent equal to 1, will lead to the straightening of the polymer to conformations similar to rods while a poor interaction with the solvent, with an exponent around 0.33, will cause the polymer to assume a compact and globular conformation. Flory exponents in between the two values indicate a random coil arrangement.
For the fitting of SAXS datasets SasView (Version 4.2.2) was employed. The scattering length density (sld) for the solvent (H2O) was estimated equal to
9.46‧10-6 Å-2 while for the mucins, assumed as the prevailing material present in the solution, the SLD was calculated using SasView Tool from the primary
structure sequence of MUC5AC-Cys13 and estimated equal to 12.55‧10-6 Å-2, with a density of the biomolecule of 1.39 g/mL. The model used to fit the scattering datasets was determined in order comprising the contributions from the two predominant structures observed in AFM thus the term from the glycosylated peptide chain and the term from the hydrophobic globules:
𝐼(𝑞) = 𝐼(𝑞)𝑐ℎ𝑎𝑖𝑛+ 𝐼(𝑞)𝑔𝑙𝑜𝑏𝑢𝑙𝑒 (8) Where the scattering contribute from the peptide backbone was expressed using the power law model as:
𝐼(𝑞)𝑐ℎ𝑎𝑖𝑛 = 𝑠𝑐𝑎𝑙𝑒‧𝑞−𝑝𝑜𝑤𝑒𝑟 (9)
and the scattering contribute from the dispersion of spheres (26) was expressed as;
𝐼(𝑞)𝑔𝑙𝑜𝑏𝑢𝑙𝑒 = 𝑠𝑐𝑎𝑙𝑒 𝑉 [3𝑉(𝛥𝑝) sin(𝑞𝑟) − qrcos(𝑞𝑟) (𝑞𝑟)3 ] 2 (10) with V the volume of the scattering particle, r the radius of the sphere and 𝛥𝑝 the difference between the sld of the scattering particle and the sld of the solvent.
AFM
Atomic force microscopy (AFM) images were obtained using Multimode SPM with a Nanoscope IV control unit, Veeco Instruments, Santa Barbara, CA. The
12 working principle of an AFM is based on the attractive and repulsive forces at the atomic level (27). A sharp silicon tip scans the sample surface; as the tip
approaches the surface, the close-range attractive forces between the surface and the tip cause the tip to bend towards the surface, however, as the tip is bought closer, the repulsive forces make the tip bend away from it. The bending and therefore the position of the cantilever is recorded by a position detector. The position sensor tracks a laser beam which is reflected off the top of the cantilever. As the cantilever interacts with the surface of the sample, the raised and lowered topographic features influence the bending of the cantilever changing the
reflection angle of the laser which is detected by the position sensor. A precise topographic map is generated by a feed-back loop that controls the height of the cantilever above the surface (28). In this experiment the AFM was used in tapping mode; instead of sliding continuously on the surface, the cantilever oscillates at its resonant frequency above the sample while a high-speed feed-back loop maintains constant the oscillation amplitude of the cantilever, adjusting the deviations caused by the interaction of the tip and the surface. This allows the software to construct the image of the surface topography. All images were obtained in air at room temperature. Silicon cantilevers with a nominal resonance frequency of 300
KHz were used (RTESPA-300; Bruker, Camarillo, CA).
The mucus samples, diluted previously with distilled water to a concentration of 10-5 wt%, were drop coated on a mica surface and left to dry in a desiccator overnight. The analysis of the AFM images was performed using WSxM software (29)
Preparation of SAXS samples
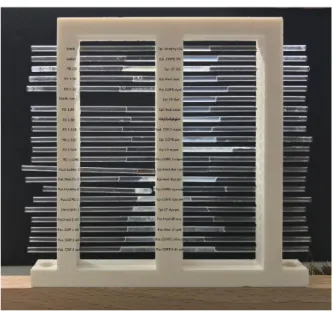
All the samples were thawed at room temperature and loaded in polymer extruded capillaries. Donor mucus samples, both from healthy and COPD donors, were divided in two groups: one group contained original samples while the second contained diluted samples, 1:10 with milliQ water. The dilution was performed with approximately 50 mg of mucus, diluted in 450 µL of water and vortexed until the reaching of a homogeneous solution. Once the capillaries were filled with the above-mentioned samples, the remaining diluted mucus was centrifuged at 9000 g and both pellet and supernatant were loaded into the capillaries for SAXS analysis as well. Cell-culture samples were investigated in their original and dialysed states. The dialysis was carried out in order to get rid of the salts present in the saline solution during the collection of mucus from cell-cultures. This was
performed using an Amicon Ultra-15 Centrifugal filter unit (Sigma-Aldrich, GER) with a 3 KDa molecular weight cut-off which allowed to remove also smaller molecules. The initial volume of the samples (0.5 mL) was diluted up to 1.5 mL with distilled water and then loaded in the filter unit; 15 mL of water were added on top of the filter unit and centrifugation at 4500 g was performed for 30 mins. The filtered solution was then removed from the tubes and the procedure was repeated for three times. The purified samples were then collected in 2 mL Eppendorf tubes and stored at -80°C. The capillaries were filled on site. As the SAXS capillaries were filled with original and dialysed samples, the remaining part was centrifuged at 9000 g. This procedure was meant to separate additionally
13 the mucus gel from possible DNA and cellular debris. Both the pellet and
supernatant were pipetted in the capillaries and studied likewise (Figure 3).
RESULTS
AFM
AFM was employed to evaluate structural differences of mucins in both healthy and diseased mucus samples derived from humans and from cell-cultures. The mica substrates were drop-coated and left to dry in the desiccator overnight. The molecules deposited from mucus solutions were visualized in air at room
temperature. AFM images in tapping mode revealed the presence of typical dumbbell-shaped structures characterised by the presence of two globular
structures linked by a filamentous spacer. The profile analysis of images allowed to estimate the volume of observed molecules on mica surface and therefore the equivalent size of the molecular components (globules and spacers) of the molecule in bulk solution.
From the imaging analysis of AFM pictures, the mucin molecules resulted to be flattened on the mica surface with the height significantly smaller than the width. The globular terminals were approximated both to elliptic and circular solid discs (depending on the shape) while the spacers to rectangular elongated
parallelepipeds which allowed to calculate the volume. Given the volume it was then possible to estimate the equivalent radii of the globules and of the spacer in bulk solution by using respectively the volume formulas:
𝑉 = 4/3𝜋𝑟𝑒𝑞𝑢𝑖𝑣3 and 𝑉 = 𝜋𝑟𝑒𝑞𝑢𝑖𝑣2𝑙 (11)
The healthy mucus obtained from cell-culture in Figure 4.a showed the presence of a multimer where three asymmetric dumbbell monomers were clearly visible. The asymmetric dumbbells were assembled end-to-end by a junction highlighted in Figure 4.b. This connection created a symmetric dimer that consequently linked to another monomer.
14 The image analysis of the molecule in Figure 4.a revealed that the largest globular region (upper right corner) has an average height of 3.0 ± 0.5 nm while the semi-minor and semi-major axis have average lengths of 68.0 ± 4.4 nm and 103.1 ± 4.4
nm respectively with an equivalent radius size of ~33.1 nm. The dimer, formed by
the symmetric junction, revealed that the spacer between the globular regions is 2.5 ± 0.6 nm high and 38.4 ± 3.4 nm wide with a length of about 450 nm. The calculated equivalent radius for the three major globular structures indicated a radius of ~25 nm and ~33 nm, while for the spacer it resulted in ~3.5 nm. The smaller globular regions, taking part in the symmetric junction in Figure 4.b. exhibit an equivalent radius of ~10 nm.
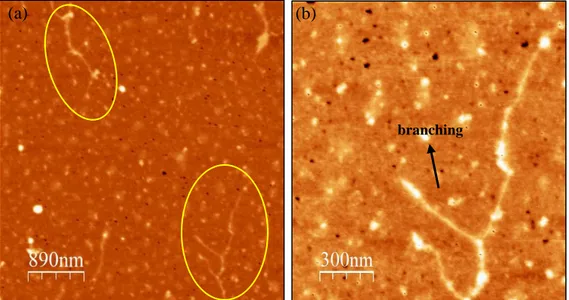
Figure 5. AFM picture of dried mucus sample on mica from healthy donor diluted 10-5 wt%
deposited on mica surface. (a) Two mucin strands with side ramifications are visible. (b) Magnification of one of the two molecules.
b Junction
Figure 4. (a) AFM capture of mucin molecule on mica from healthy cell-culture mucus diluted 10-5 wt%. (b) Magnification of the junction region between the two monomers
characterised the presence of an intramolecular junction.
(a) (b)
(a)
branching
15 For equal dilution, the sample from healthy donor (Figure 5) showed a greater assembly of monomers compared to the healthy sample from cell culture, organized in branched structures rather than in short linear oligomers. In Figure 5.a an elongated and branched polymer appears to be formed of what resembles symmetric dumbbell monomers connected end-to-end. In the magnification of Figure 5.b the assembly presents a main linear chain made of at least five monomers. On the sides two shorter appendixes are formed by one or two
monomers. The length of each single unit varied between 200 and 500 nm with an equivalent width of 3.3 ± 0.6 nm, while the terminal regions presented smaller globules with an equivalent radius estimated in ~8 nm.
The AFM picture highlighted also, similarly to the previous sample, the presence of an abundant dispersion of unlinked spherical particles surrounding the mucin polymer.
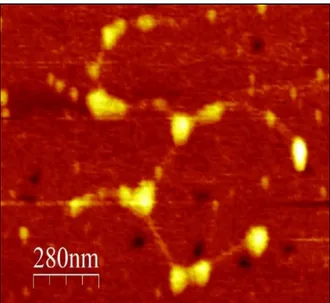
The longest fragments of the polymerous mucins were observed in the sample from the COPD patient. Both structures in Figure 6.a and Figure 6.b presented a length above 3 µm, with globular regions separated by spacers ranging between 120 and 400 nm with an equivalent radius of approximately 3.5 nm. The
heterogenicity is found also in the globular regions whose equivalent radius in bulk vary between 10 and 16 nm. Noticeable is the difference between two different polymers in the same sample
;
while in Figure 6.a the structure results linear with no sign of branching, in Figure 6.b several branching and multiple interactions between various monomers can be observed.The mucus from cystic fibrosis cell-culture (Figure 7) displayed a slightly
different conformation from the previous specimens. Rather than being assembled in long linear strings, with a longitudinal prevailing direction, CF sample
displayed a greater clumping of molecules with irregular branches and with the
Figure 6. AFM picture of dried mucus sample on mica surface from COPD1 patient diluted to the concentration of 10-5 wt%. (a) Mucin multimer presenting a linear organization of
monomers. (b) Mucin assembly with bifurcation and ramified side chains.
16 absence of any specific order. Compared to COPD samples no difference in size were noted for the globular region since the equivalent radius of the globules was found to be between 12 and 18 nm, however, the glycosylated spacer length between the two globules was observed to be reduced in comparison with the previous samples, showing an average length of only 160 nm.
The AFM analysis, however, refers to a limited region of the coated mica surface of 5 µm2, therefore the presented results cannot be generalized to the whole sample. For a more accurate evaluation the uncertainty produced by the radius of curvature of the tip should also be taken into account.
sample type equivalent globular radius [nm] Glycosylated chain length [nm] Glycosylated chain radius (compacted) [nm] Vg/Vc Cell-culture healthy 25 – 33 # 10 ## 400 - 450 5.5 ± 0.6 1.7 Donor healthy 8 - 10 200 - 500 3.3 ± 0.6 0.5 Donor COPD1 10 - 16 120 - 400 3.5 ± 0.6 1.9 Cell-culture CF 12 - 18 120 - 200 2.8 ± 0.2 3.3
(#) interval size for the radius of the larger globules. (##) size of the two smaller globules Table 1. Summary of the dimensions of different structures forming mucin molecules observed with AFM. Equivalent globular radius and glycosylated chain length express the interval within the size is present. The last column represents an indicative coefficient of the ratio between the globular and the chain volume (Vg/Vc) of a monomer considering the average values for radius and
length observed in the sample.
Figure 7. AFM picture of dried mucus on mica surface from cystic fibrosis cell-culture sample diluted 10-5 wt%. Several monomers are visible to be linked end-to-end but a preferential distribution
17
SAXS – WAXS
Figure 9 shows the SAXS patterns of the crude bronchial mucus samples derived from donors and from the cell-cultures. In Table 2 displays the comparison in globular radius size between AFM observation and the radius obtained from the SAXS fit, while in Table 3 are reported the Flory exponents of all the mucus samples, calculated from the slope of different regions of the log-log plot of the scattering I(q) vs q, upon background subtraction. The SAXS and WAXS
measurements presented below, refer to the most significant results obtained from the studied samples. Several technical complications in capillary loading occurred due to the high viscosity and stickiness of samples such as the collected pellet, which caused the loss of information of certain specimens. In Figure 9.a the sample from COPD1 donor, exhibited the most steady slope throughout the whole q-range. The scattering from COPD2 mucus displayed a mild bump starting at 0.15 nm-1 which overlapped the COPD2 at higher q values. The healthy sample displayed the same trend of the previous two samples but it formed a more pronounced bump starting at q ~ 0.23 nm-1 which proceeded until the final value of 1.29 nm-1. In the cell-culture samples (Figure 9.b), mucus from healthy, COPD and cystic fibrosis cell-lines were analysed. Scattering curves from healthy and
Figure 8. Log-Log plots of four different sets of scattering curves. (a) Scattering plot of original samples obtained from patients. (b) Scattering plot of original samples obtained from cell-cultures. (c) Scattering plot of cell-culture samples after dialysis. (d) Comparison between the scattering plot of the original and diluted donor sample as well as the supernatant and pellet obtained from the centrifugation of the diluted sample.
(c)
(a) (b)
18 COPD cell-cultures showed no significant difference, proceeding in an almost linear fashion without noticeable peaks.
The dataset from mucus of cystic fibrosis cell-culture, conversely, displayed a flattened region starting at q = 0.07- 0.08 nm-1, with a slope decreased from -2.33 to -1.39 to then return to steeper pendency (-2.02) at q-values greater than 0.50
nm-1.
In the dialysed cell-culture samples (Figure 9.c), the curves were shifted towards lower intensities due to the dilution step in the dialysis process. The pace of both healthy and COPD samples remained unchanged, overlapping on each other similarly as in the samples from untouched cell-culture in Figure 9.b. The cystic fibrosis sample, however, formed a more defined plateau-like region at lower q-values (0.08 nm-1 < q < 0.15 nm-1) than the previously observed bumps, with a slope of -0.94, which terminated in a linear section at higher q-values. In Figure 9.d the diluted sample from healthy donor was compared with the original one. Additionally, upon centrifugation, the pellet and the supernatant from the diluted sample were both studied as well. The dilute sample did not display the bump present in the original sample from healthy donor but rather descended in an even manner. As expected, the pellet displayed a higher intensity compared to the diluted sample but it did not show any particular feature, probably due to high concentration and heterogenicity. The line with the lowest signal reflected the scattering of the supernatant and the bump displayed at higher q-values appeared similar to the one of the original sample but less intense.
Given the lack of features on most curves, the fitting analysis was carried out only on the datasets that displayed features that could provide information on the form factor of mucin. Four samples were used to perform this analysis: donor healthy, donor COPD, and cystic fibrosis, both original and dialysed (Figure 10). The model best representing the curves was found to be the combination of two form factors: the polydisperse distribution of spheres combined with the power law model. From AFM analysis appeared clear that the mucin molecules were formed of two relatively simple structures, spherical globules and long chains comparable to elongated cylinders with a certain degree of flexibility. However, none of these models taken alone produced an adequate fit. The most obvious solution, thus the employment of a dumbbell structure, typically assigned to this kind of molecules and formed by the fusion of the previous two models failed as well. The
combination of spheres and power-law model produced on the other hand a more satisfactory fit. The radius parameter obtained from the fitting model exhibited way too small values to be representative of the globular terminals of mucin molecules from healthy, COPD and CF original samples, compared to AFM observations. In fact the radius of the spheres obtained from the fit model displayed a size ranging between 2 and 4 nm for the above-mentioned datasets (Table 2). On the other hand, the dialysed sample of cystic fibrosis mucus, whose bump resulted at a lower q-values (0.15 nm-1), displayed a radius obtained from the fit of 13.3 nm, a more similar value if compared with the measurements in AFM images.
In all the fitting plots from COPD and cystic fibrosis scattering, in the region of small q-values is noticeable a discrepancy between the fitting and dataset curve which might be caused by the fact that the scattering data points present a lower density in that region, resulting hardly readable by the fitting algorithm.
19 Table 2. Comparison between the radii lengths of globular terminals of mucin calculated using AFM and the fit with the sphere-power law.
Sample type Equivalent globular radius from AFM [nm]
Sphere radius from SAXS fit [nm] Donor healthy 25 – 33 10 2.53 Donor COPD 10 - 16 3.20 Cell-culture CF original / 4.00 Cell-culture CF dialysed 12 - 18 13.3
The WAXS scattering curves were analysed in terms of peaks positions which reflect the intramolecular organization of the molecules, such as secondary structure and interatomic interactions. The WAXS data covered a q-range from 4.3 to 61.6 nm-1 corresponding to a d-spacing between 1.46 and 0.1 nm. The background subtraction was performed using the scattering intensity from the capillary filled with milliQ water, scaled by a factor tailored for each sample. Three main peaks were observed in all the samples (Figure 11). The first peak was located at q = 12.4 -12.8 nm-1 which covers a length scale of 0.51 – 0.49 nm. It
Figure 9. Fitting of the scattering datasets from (a) original healthy donor, (b) original COPD2 donor, (c) original cystic fibrosis cell-culture, (d) dialysed cystic fibrosis cell-culture. The fit was performed using the combination of a sphere and power law model.
(a) (b)
20 was noted however that the very same peak, observed in all the samples, both donors’ and cell-cultures, was present in the signal from the blank capillary (Figure 12) and an appropriate scaling would attenuate it significantly in the mucus samples; this leads to think that the peak is most likely an artefact caused by a defective subtraction of the capillary intensity from the samples and does not provide any useful information regarding the intramolecular interactions. The second and third peaks, located respectively at q = 21 nm-1 and q = 28-29 nm-1 resulted to be the position of the first and of the secondary peak of liquid water (30). This was confirmed by subtracting the scattering intensity of the empty capillary from the signal of the capillary filled with water. The dotted line representing the signal from water (Figure 12), obtained from the
above-mentioned subtraction, presented two peaks observable in all the mucus samples implying therefore that WAXS analysis did not provide useful information regarding the intramolecular structure of the mucins.
Water peaks
Peaks produced by the capillary
Figure 10. WAXS dataset curves of donor samples compared to the water-filled capillary. The image takes as example the scattering obtained from donors’ mucus samples to highlight the similarity between the peak positions in the sample with those found in the water capillary. The same pattern is observable in all the other samples analysed with WAXS.
Figure 11. The scattering intensity from the empty capillary (dashed line) was subtracted from the capillary filled with water (solid red line) to identify the scattering contribution of the water only (dotted line).
21 Table 3. Slopes and Flory exponents calculated for the scattering curves of mucus samples at different q-ranges
q-range (nm-1) d-spacing (nm)
slope R2 Flory exp.
qmin qmax dmin dmax
Patient Healthy original 0,024 0,223 261,80 28,18 -2,25 0,9997 0,44 0,255 0,582 24,64 10,80 -1,24 0,9978 0,81 0,600 1,100 10,47 5,71 -2,08 0,9948 0,48 Patient COPD1 original 0,028 0,130 224,40 48,33 -2,22 0,9991 0,45 0,130 0,360 48,33 17,45 -1,84 0,9998 0,54 0,360 0,950 17,45 6,61 -2,03 0,9981 0,49 Patient COPD2 original 0,026 0,077 241,66 81,60 -2,53 0,9965 0,40 0,078 0,240 80,86 26,18 -1,66 0,999 0,60 0,240 1,000 26,18 6,28 -1,80 0,9967 0,56 Cell-culture Healthy original 0,031 0,165 202,68 38,08 -2,14 0,9986 0,47 0,165 0,540 38,08 11,64 -1,81 0,9998 0,55 0,540 1,040 11,64 6,04 -2,10 0,9987 0,48 Cell-culture COPD original 0,029 0,130 216,66 48,33 -2,29 0,9949 0,44 0,130 1,000 48,33 6,28 -1,84 0,9995 0,54 Cell-culture CF original 0,027 0,083 232,71 75,70 -2,33 0,9976 0,43 0,083 0,366 75,70 17,17 -1,39 0,9992 0,72 0,366 1,000 17,17 6,28 -2,02 0,9969 0,50 Cell-culture Healthy dialysed 0,023 0,140 273,18 44,88 -2,30 0,9984 0,43 0,140 0,880 44,88 7,14 -1,90 0,9984 0,53 Cell-culture COPD dialysed 0,026 0,050 241,66 125,66 -2,08 0,9958 0,48 0,050 1,000 125,66 6,28 -2,00 0,9892 0,50 Cell-culture CF dialysed 0,023 0,090 273,18 69,81 -2,60 0,9942 0,38 0,090 0,140 69,81 44,88 -0,94 0,9945 1,06 0,140 1,000 44,88 6,28 -1,95 0,9991 0,51 Patient healthy diluted 0,030 0,200 209,44 31,42 -2,29 0,9984 0,44 0,200 0,600 31,42 10,47 -1,73 0,9980 0,58 0,600 1,000 10,47 6,28 -2,05 0,9987 0,49 Patient healthy diluted: pellet 0,030 0,200 209,44 31,42 -2,27 0,9983 0,44 0,200 0,600 31,42 10,47 -1,71 0,9987 0,58 0,600 1,000 10,47 6,28 -2,03 0,9989 0,49 Patient healthy diluted: supernatant 0,027 0,129 232,71 48,71 -2,85 0,9965 0,35 0,129 0,55 48,71 11,42 -1,47 0,9883 0,68 0,550 1,000 11,42 6,28 -1,64 0,9988 0,61
22
QCM-D
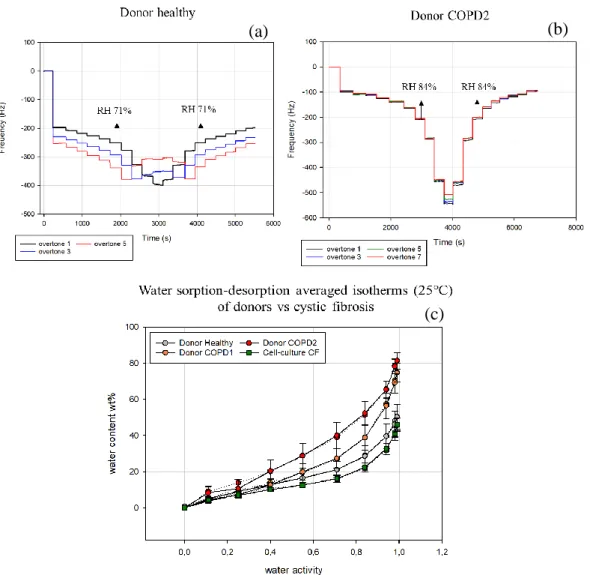
The water sorption-desorption study was performed on original donor samples as well as on dialysed samples from cell-cultures. Donors’ samples were diluted 1:15 times, except for the healthy patient sample, where the presence of visible clumps required a dilution of 1:30. The cell-culture samples, which have been diluted during dialysis, were now diluted with a dilution ratio of 1:5. The normalized frequency steps were averaged among all the overtones and were plotted against water activity. The only exception was made for the sample from healthy donor since all the overtones except for the first, showed an unexpected development at high humidity values (RH > 84%). In fact, the healthy donor sample displayed a
distinctive separation of overtones from the very beginning of the experiment (Figure 13.a). Moreover, overtones 3 and 5 showed an abnormal behaviour at high relative humidity values suggesting the presence of a possibly uneven coating of the sensor or the formation of an aggregation of material on the surface during the drying procedure. Nevertheless, the first overtone has generated the expected
Figure 12. Oscillating frequency change measured during hydration and dehydration of mucus layer at known relative humidity values: (a) healthy donor, (b) COPD2 donor. (c) Water sorption (solid line) -desorption (dotted line) isotherms (25°C) for donors’ samples compared with the mucus from cystic fibrosis cell-culture. The curves are plotted as water content wt% of the mucus film against water activity. The uncertainty related to the positioning of the sensor is calculated according to equation 5.
(b) (a)
23 pattern and was considered for the further analysis. From the first step of the frequency change, representing the frequency drop due to the presence of the dry film (-200 Hz), the film thickness was estimated ~32 nm.
A more compact pattern was followed by the overtones from the COPD samples (COPD2 showed in Figure 13.b) which started separating from each other only at high RH values, over 98%. The initial step was estimated around -100 Hz
corresponding to a film thickness of 15.7 ± 0.5 nm. In Figure 13.c the water content vs water activity is showed. The healthy sample displayed a maximum water content of ~50.4 wt% at a RH = 99%. The sorption and desorption lines matched almost perfectly indicating the absence of hysteresis. A similar pattern with no hysteresis, despite the difference in the layer thickness, 15.7 ± 0.5 vs 30.5 ± 1.3 nm, was observed in COPD2 and COPD1 samples. A small mismatch between sorption and desorption occurred for both the samples in the region around RH = 25%. Both COPD2 and COPD1, starting from 40% RH exhibited a significantly higher water content compared to healthy and cystic fibrosis
samples, reaching 81.6 ± 4.9 and 74.8 ± 2.3 wt% at 99 % of RH, respectively. For the healthy donor sample the dissipation analysis in sorption-desorption of water showed a relatively flat curve for RH values below 71% (Figure 14.a) with a sharp increase occurring during the transition between 71 and 84%. COPD samples (Fig 14.b) displayed a similar shape for the dissipation but the increase was shifted at higher RH values, between 84 and 94% both for sorption and desorption.
In the cell-culture samples, the healthy film (Figure 15.a), displayed an initial step of approximately -86 Hz with a corresponding film thickness of 14.7 ± 0.8 nm. Except for the first overtone, the 3rd, 5th and 7th showed a unified behaviour until the relative humidity of 98% where a separation began to be visible. The COPD sample displayed a similar initial frequency change, reflecting a similar film thickness of 14.1 ± 0.5 nm. The overtones showed a separated pattern, both during sorption and desorption and compared to the healthy and the cystic fibrosis case, an abrupt frequency drop was observed between the RH of 94 and 98%. The cystic fibrosis film with a thickness of 24.8 ± 0.5 nm, displayed a steady
Figure 13. Dissipation change vs time measured for (a) healthy and (b) COPD2 donor.
(b) (a)
24 progressive separation of overtones which, however, remained constant from 94 to 99% of RH. The water content vs water activity plot for the healthy film, showed a maximum water capacity uptake of 62.3 ± 7.4 wt% with no sign of hysteresis during the desorption. A similar behaviour was displayed by the curve of cystic fibrosis sample which, however, exhibited the lowest water uptake capacity of 46.0 ± 3.5 wt% among the three samples and more generally, the lowest hydration throughout the whole humidity range. Although the difference between CF and the healthy is not significant as error bars overlap, this difference resulted significant when compared with COPD sample, especially at RHs higher than 40%.
The COPD sample had the highest water uptake, 66.6 ± 7.54 wt%. The desorption curve displayed a branching from RH humidity value of 71% from which on, the desorption proceeded at higher water content levels as compared to the sorption until the dry state (i.e. hysteresis between the sorption and desorption branches). It is noticeable that the desorption curve did not reach the initial dry state retaining
Figure 14. Oscillating frequency change measured during hydration and dehydration of mucus layer at known relative humidity values: (a) healthy cell-culture, (b) COPD2 cell-culture, (c) CF culture. (d) Water sorption (solid line)-desorption (dotted line) isotherms (25°C) for cell-culture’ samples. The curves are plotted as water content wt% of the mucus film against water activity. The uncertainty related to the positioning of the sensor is calculated according to equation 5.
(c)
(a) (b)
25 6.3 ± 4 wt%. The mismatch of the water content at 0% RH reflected the splitting of overtones due probably to a non-homogeneous layer distribution on the sensor upon hydration over the glass-transition point, which persisted as the humidity decreased.
As for donors’ case, in the healthy sample obtained from cell culture (Figure 16.a), the transition to a liquid state was represented by the abrupt increase of dissipation at the humidity shift between 71 and 84%. The same was observed during the desorption. In the COPD sample (Figure 16.b) the increase occurred at a higher humidity step, between 84 and 94% RH but the decrease was observed between 84 and 71% reflecting probably the apparent hysteresis occurring between sorption and desorption. The lowest dissipation was observed in cystic fibrosis (Figure 16.c). The increase of dissipation occurred between 71 and 84% RH and the maximum dissipation, reached at 99% RH, resulted to be ~30 and 40% of the highest obtained by the healthy and COPD sample which may reflect the poor water uptake of cystic fibrosis sample during the sorption process.
Figure 15. Dissipation change vs time measured for cell-cultures samples. (a) Healthy cell-culture. (b) COPD cell-culture. (c) Cystic fibrosis cell-culture.
(b)
(c) (a)
26
DISCUSSION
The AFM picture of mucus from healthy cell-culture sample (Figure 4) revealed the presence of asymmetrical dumbbell monomers taking part in the formation of a larger molecule constituted of three subunits. Each monomer was characterised by a linear, about 400 - 450 nm long, spacer bordered by two circular structures with an equivalent bulk radius estimated to be 25 - 33 nm for the bigger globules and 10
nm for the smallest. Although there are still many unsolved questions regarding the
structure of different mucins, a similar asymmetrical dumbbell shape was attributed to porcine gastric Muc5ac (20) and Muc6 (31). The N and C termini of mucins, which are mentioned above as globular structures involved in the formation of disulphide bonds, are formed by D1, D2, D3 and D4, B, C, CK domains respectively (2). The D1-D4 motifs together with CK domain (cysteine knot) are known as domains of Von Willebrand factor (vWF), a large multimeric glycoprotein, involved in the haemostasis by mediating the platelets adhesion to the site of wounds. Similarly to their function in mucins, these cysteine-rich domains, additionally to the blood clotting function, are involved in the multimerization of the vWF via disulphide bonds and studies based on their genetic sequence showed that they are shared by most of the mucins (31). This suggests that the major differences characterizing the various mucins and the alterations of the same mucin in the presence of illnesses, might be confined to the glycosylated peptide region and the carbohydrate chains bound to it.
A relatively different structure was observed in the two molecules found in the sample from healthy donor (Figure 5). The globules decorating the ends of the spacers had an average size of roughly 8 nm and the assembled structure revealed a tendency to form several branches around a main polymeric string. The total length of the molecule could not be estimated but the visible region extended for 2-3 µm and was formed by monomers with a backbone length of 200-500 nm. This dimension resulted to be in line with observations conducted on MUC5AC in an electron microscopy study, with monomer lengths reported to be on average 570 nm and an organization characterised by long linear strands which extends up to millimetres (32). No information could be found in literature regarding the globular size but the difference between the equivalent radii of the globules from healthy donor and cell-culture mucus resulted considerable and let us think that the largest globules observed in cell-culture (Figure 4.a) might be the product of an excessive folding of the backbone around the globule, causing its size increase. This supposition arises from the measurement of the “smaller” globular terminal observed in Figure 4.b which revealed a similar dimension of the donor’s mucin. To reinforce this hypothesis, the cell-culture sample was the only one displaying a such clear asymmetric behaviour of the monomers in term of the globular size which was not visible neither in healthy donor’s mucus nor in any other specimen suggesting that the actual size of the globular regions of cell-culture sample could be the one displaying the equivalent radius of 10 nm, similarly to the donor case. Despite the fact that COPD and cystic fibrosis are both characterised by a
thickening of the mucus, which might let suppose a similarity of the polymer organization, the AFM images revealed a rather different organization of mucins in the two samples. The mucus from COPD patient showed a linear and stretched distribution of polymers, extending mainly in one predominant direction (Figure
27 6). The size of the globular regions appeared heterogeneous with bigger
hydrophobic globules of 16 nm in equivalent radius alternating to smaller globules of 10-12 nm. The size of the glycosylated backbones separating the globules resulted to be very similar to that found in the healthy donor, between 100 and 400 nm, as well as the equivalent spacer thickness with a radius of 3.5 ± 0.6 nm against 3.3 ± 0.6 nm, suggesting an architectural similarity between the two. This hypothesis was supported by previous findings stating that molecular masses of mucin from chronic bronchitis sputum is consistent with those of mucin from gastric, cervical and respiratory tract of healthy subjects and their organization is characterised by long, linear and flexible strands that interact as random coils (33). A different configuration was observed, however, in the CF sample. The single molecules displayed a rather similar equivalent radius of the globular region (12 – 18 nm), while the spacers length never exceeded 200 nm (Figure 7). A more general look revealed also that the molecules tended to assume a chaotic and crumpled conformation, lacking of a prevailing direction of propagation conversely to what was observed in COPD and healthy case. According to existing literature (34), prior to secretion, mucins are densely packed in
concentrated and dehydrated granules, held together thanks to the screening action of Ca2+ ions that shield the repulsive forces of the negatively charged sialic acids. Current knowledge holds that the un-shielding of the negative charges and therefore the unfolding of the mucins upon release, is driven by the presence of HCO3− . In cystic fibrosis patients, owing to the dysfunctional CFTR channels, the lack of secreted HCO3− may impede the calcium extraction and therefore limit the expansion and swelling of mucins. Since the glycosylated chains are responsible of the water uptake and of the repulsion amid nearby mucins, we propose that their limited length observed in the AFM picture, might indicate an uncomplete unfolding and expansion of the backbone chains, reducing the water-binding capacity. To support this hypothesis regarding the chain structural difference, we provided a coefficient for every mucus sample investigated with AFM, displaying the ratio of the globular-volume over the chain-volume of a theoretical monomer having the average features of the mucin strands in the corresponding sample (Table 1). As expected, the cystic fibrosis, sample displayed the highest value of 3.3, which, given the relative similarity of globular radius with healthy and COPD donor mucus, indicated a prevailing presence of hydrophobic globules compared to chains. The AFM method, however, is a local technique and only probes limited regions of the sample, therefore results cannot be extrapolated to the whole mucus sample and the proposed interpretations should take in account this experimental limitation.
The reduced water uptake in cystic fibrosis mucus was observed as well in the QCM-D results. As a matter of fact, the cystic fibrosis sample displayed the lowest water content for each humidity and the final water content, at 99% RH, was only 46.4 wt% suggesting a limited disposition to absorb water (Figure 13.c). The latter case is, however, significant only when compared with COPD mucus samples; for the comparison with the healthy sample, this statement must be interpreted carefully as the uncertainties of the two cases overlap considerably. An alternative explanation regarding the reduced water uptake might be correlated to findings stating a reduced amount of MUC5AC and MUC5B identified in CF sample compared to healthy and COPD due to defective exocytosis that, despite
28 the mucin being produced, impedes its secretion across the cell membrane
(18,35).
The energy dissipation change reflects the “stiffness” of the deposited film and therefore provides information on the rheological properties of the layer (36). A small change in dissipation was observed at low RHs in all the samples,
displaying a mostly flat line, while an increase was noted for RHs between 71 and 84%, indicating a transition from a rigid state into a viscous and more fluid-like state. An exception was observed in the COPD samples, whose increase in dissipation was identified between 84 and 94% (Figure 14.b and 16.b). The low dissipation changes for cystic fibrosis at high RHs, resulted in agreement with the previously made observation regarding AFM data, indicating the presence of a more rigid (lower water content) film on the sensor. On the other hand, a contrary behaviour was observed for COPD mucus. The water sorption of COPD mucus samples, both from donors and cell-culture, displayed an opposite pattern compared to CF (Figure 13.c). Starting from 40-45% RH, all the COPD mucus samples showed a greater water absorption with respect to the healthy sample and the final water content ranged between 66 and 81 wt%. From the frequency change (ΔF) vs time plot, a sharp frequency drop between 94 and 98% of RH, for both sorption and desorption, appeared as a shared characteristic by all the COPD samples (Figure 13.b and 15b), which was not observed neither in the healthy nor CF samples. Both the healthy samples from donor and cell-culture, displayed a sorption isotherm placed in between the COPD and the CF curves with a
maximum water content of ~51 and 62 wt% respectively suggesting that the two diseases might have opposed trends in terms of water sorption with respect to the healthy mucus. This observation is however applicable for donors’ samples rather than for cell culture ones. In the latter case the sorption/desorption isotherm displayed a higher uncertainty and no significant difference could be observed from both COPD and CF ones.
Although the studies on COPD mucus are limited compared to those on cystic fibrosis, previous findings (37) concerning the morphological properties
highlighted that the greater adherence and stasis (lack of movement) of chronic bronchitis mucus is highly dependent upon mucin concentration. Concurrently to its defence function against noxious particles, mucus acts as a water reservoir for the underlying PCL adding or removing water from it when needed (37). When the proportion between mucin, salts and water results physiological, the viscosity of periciliary layer allows the cilia to beat, favouring the movement of mucus from lungs to mouth (38), however, it was found that an imbalance in mucin-to-volume concentration caused the depletion of the PCL causing the adhesion of mucus directly on the luminal surface of the airways (39). This induces the flattening the cilia and a consequent disruption of the layer mobility. In
accordance with the fact that mucin’s glycosylated backbone is the responsible of water uptake by the polymer matrix of mucus, it can be speculated that the results observed in QCM-D analysis, thus an increased water sorption capacity in COPD mucus with respect to healthy one, might mirror the existing literature findings which link COPD to a higher mucin concentration. While in a sorption
experiment this translates in a high water absorption upon the humidity increase, in COPD patients the main source of water to be absorbed results to be the PCL, causing its depletion due to dehydration. As an evidence, clinical procedures involving the artificial humidification of airways showed successful outcomes by
29 treating COPD-induced worsening of respiratory symptoms with the high flow nasal cannula (HFNC) (40). This procedure delivers a humidified and heated air-oxygen mixture with the purpose to maintain unmodified the water content of bronchial secretions and avoid injuries to ciliary motion. Despite the promising observation done over the water-sorption differences among COPD, healthy and CF samples, it has to be mentioned that the reported measurements were
performed on mucus layers considered by previous studies too thin to bear a valuable information. In fact the thickness of the layers used in this study ranged between ~15 - 30 nm against the 200 – 1000 nm (22), indicated as the optimal range in order to minimize the errors given by the mounting procedure of the sensor. Additionally, a thin mucus layer results to be more prone to form
superficial irregularities and provoke a non-homogeneous distribution of material on the sensor, thus forcing one of the three assumption for the application of the Sauerbrey equation; the absorbed mass has to be evenly distributed over the active area of the sensor (21). Similar QCM-D experiments (41), involving the
biopolymers, have been previously performed on PGM samples. The similar behaviour in dissipation change, which coincided with the region of glass transition for PGM, may indicate that findings in this study could potentially provide early hints on the glass transition difference between healthy and COPD mucus which was observed to occur in the RH ranges 71 - 84 and 84 - 94% respectively, indistinctly of the provenience of the mucus, whether donor or cell-culture samples.
The majority of curves observed in SAXS experiment displayed a steady slope of approximately along all the q-range (0.02 – 1.29 nm-1), without signs of
significant slope variations. Due to the lack of features, the fitting analysis was carried out only on the datasets that displayed features potentially assignable to mucin structures. All the four selected samples in Figure 10, demonstrated a bowed region along the q-range. The scattering curves from the original healthy and COPD mucus revealed a visible curvature between 0.25 and 1.29 nm-1 while for the scattering curve of original cystic fibrosis mucus, the slope variation occurred starting at smaller q-values around 0.1 nm-1 and proceeded until qmax
(Figure 10.c). A noticeable difference, compared with the previous scattering curves, was displayed by the scattering dataset of the dialysed mucus from CF cell-culture in Figure 10.d, with a more pronounced peak at 0.15 nm-1. Based on the results of AFM observations, the barbell model (42) , a generalised form of the dumbbell, was proposed as a suitable candidate for the fitting of the curves. The model, however, could not properly fit the curves, sensibly deviating from the scattering at q-values below 0.1 nm-1 corresponding to the linear region.
Following the approach employed by Griffiths et al (5), a new fitting model was created by combining together the sphere and the power law model to describe respectively the hydrophobic dispersed spheres and the glycosylated chain structures. This model showed a more adequate fit displaying however a certain deviation for smaller q-values (q < 0.04 nm-1) likely cause by aggregation. The radius obtained from the fit revealed, for the original samples, the presence of spheres between 2 and 4 nm in radius which did not match with the values obtained from the AFM measurements of the larger globular structure of mucins. In fact, the smallest globules were observed in the mucus from the healthy donor with a size population ranging between 8 and 10 nm. All the AFM pictures revealed, however, the presence of a dense dispersity of spherical objects around
30 the mucin molecules with an equivalent radius ranging from 1 to 5-6 nm.
Therefore the radii from the fits of the original samples are likely to correspond to the these smaller particles. Thus, this suggests that in these samples, the scattering contribution from this high dispersity of smaller molecules, could have
overshadowed the signal from the larger globular structures belonging to the mucins. This interpretation is supported by the fact that the scattering signal from the dialysed cystic fibrosis sample in Figure 10.d, revealed the presence of a well-defined bump at a lower q-value of 0.15 nm-1 corresponding to correlation length of around 40 nm. However, for this sample the sphere-power law model could not approximate the scattering dataset over the all q-range, therefore the q-range for the fit was reduced to the values around the bump (0.085 - 0.04 nm-1). The fit obtained yielded a radius of 13.3 nm in line with the AFM measurements (12 - 18
nm) as visible in Figure 7. One can speculate, that the emergence of the bump at
lower q-values might have been the result of a partial removal of smaller
molecules during the dialysis procedure which, as mentioned earlier, could have shadowed the signal from the bigger, but in fewer number, mucin globules.
CONCLUSIONS
The aim of this work was to investigate possible alterations in mucus biophysical properties in COPD patients with respect to healthy and cystic fibrosis case. Physical features were investigated with AFM and SAXS while the water-sorption of the mucus gel was studied using QCM-D technique. From these experiments the following was concluded:
• The AFM analysis revealed the typical dumbbell structure of the mucin monomers. A significant difference was observed in the cystic fibrosis mucus, which displayed an overall shorter spacer length in between the globules with respect to COPD and healthy mucus. The sample from COPD patients, on the other hand, showed sizes in line with the mucus from healthy donors .
• The water sorption/desorption isotherms revealed a divergent pattern for mucus obtained from COPD and cystic fibrosis patients with respect to the healthy case. While COPD mucus showed a greater water uptake, the cystic fibrosis mucus exhibited an opposite behaviour with the lowest water sorption.
• The fitting analysis of the SAXS datasets, displayed the presence of both coil structures and spheres. While the coils contribution was attributed to the glycosylated chains, the dispersity of spheres, due to the small size calculated by the fit, were most likely a contribution of the highly dispersion of smaller molecules observable in AFM pictures. The emerging bump corresponding to the size of the mucin globules upon filtration of the sample, as observed in the dialysed cystic fibrosis mucus, suggests a potential application of SAXS for future investigation of mucus structure, at the condition that an improvement in purification is provided.