Abstract— This paper presents initial work on a context-dependent driver distraction detection algorithm called AttenD2.0, which extends the original AttenD algorithm with elements from the Minimum Required Attention (MiRA) theory. Central to the original AttenD algorithm is a time buffer which keeps track of how often and for how long the driver looks away from the forward roadway. When the driver looks away the buffer is depleted and when looking back the buffer fills up. If the buffer runs empty the driver is classified as distracted. AttenD2.0 extends this concept by adding multiple buffers, thus integrating situation dependence and visual time-sharing behaviour in a transparent manner. Also, the increment and decrement of the buffers are now controlled by both static requirements (e.g. the presence of an on-ramp increases the need to monitor the sides and the mirrors) as well as dynamic requirements (e.g. reduced speed lowers the need to monitor the speedometer). The algorithm description is generic, but a real-time implementation with concrete values for different parameters is showcased in a driving simulator experiment with 16 bus drivers, where AttenD2.0 was used to ensure that drivers are attentive before taking back control after an automated bus stop docking and depot procedure. The scalability of AttenD2.0 relative to available data sources and the level of vehicle automation is demonstrated. Future work includes expanding the concept to real-world environments by automatically integrating situational information from the vehicles environmental sensing and from digital maps.
Index Terms— AttenD, Classification, Detection, Driver distraction, Driver state estimation, inattention.
I. INTRODUCTION
RIVER distraction detection systems are typically based on (i) lateral and longitudinal driving performance measures, (ii) electrophysiological recordings [1, 2], or (iii) gaze information. Category (i) has recently become less useful for driver assessment since lateral and longitudinal control are at least partially maintained by the vehicle with todays advanced driving assistance systems. Category (ii) shows imprecise distraction detection performance [3] and requires obtrusive sensors to get accurate recordings [4]. Category (iii) also has its limitations, the most important being that eye tracking only measures foveal vision without accounting for The work was carried out in the ADAS&ME project, funded by the European Union's Horizon 2020 research and innovation programme under grant agreement No 688900, and the Fit2Drive project, funded by the Swedish Strategic Vehicle Research and Innovation Programme (FFI; Grant Number 2019-05834).
peripheral information acquisition [5]. That said, eye tracking is the best approximation of visual attention, especially when the eye movements are coupled with their gaze targets.
There are two lines of research in gaze-based distraction detection, a computer vision branch and an attention monitoring branch. The computer vision branch aims to extract facial features, head pose, gaze direction or non-driving related activities (NDRA) from video streams. The output from the computer vision branch is then exploited by the attention monitoring branch, which aims to estimate if the driver is attentive enough or if he/she should be classified as distracted. The computer vision branch is prospering thanks to recent achievements in machine learning, including deep learning, and the availability of open source algorithms and pre-trained neural networks for facial feature detection and gaze estimation [6]. This has led to improved eye tracking performance and higher detection rates of NDRAs such as mobile phone usage [1, 7, 8]. However, even if many of these papers have the term “driver distraction detection” in the title, their most important research contribution is to solve the image processing task of estimating gaze direction and detecting NDRA. This research is a crucial prerequisite for the attention monitoring branch, but at the same time, it also means that these papers end with the detection of these behaviours, neglecting the final step of estimating the attentional state of the driver in a sufficient way.
The first attention monitoring or distraction detection algorithms were based on the notion that as soon as the gaze is directed away from forward or the driver is engaged in an NDRA, he or she is immediately considered distracted. This goes hand in hand with the driver distraction definitions stating that a shift of attention to anything not relevant for driving immediately equals distraction, regardless of the outcome of the situation [9, 10]. As many practitioners have realised, these demands on the driver are unreasonably strict and lead to many false distraction detection events. Published gaze-based real-time algorithms therefore give the driver some leeway by granting a certain amount of looking-away time [e.g. 1, 11, 12-17]. In practise, this is implemented by measuring the time spent looking away from the forward roadway. A commonly used threshold for the maximum allowed looking-away time is
C. Ahlström is with the Swedish National Road and Transport Research Institute (VTI) and with the Department of Biomedical Engineering, Linköping University, S-58195 Linköping, Sweden (e-mail: christer.ahlstrom@vti.se).
G. Georgoulas was with the University of Patras, Patras, Greece A He is now with DataWise Data Engineering LLC, Atlanta, GA, 30318, USA.
K. Kircher is with the Swedish National Road and Transport Research Institute (VTI), S-58195 Linköping, Sweden.
Towards a Context-Dependent Multi-Buffer
Driver Distraction Detection Algorithm
Christer Ahlström, Senior member, IEEE, George Georgoulas and Katja Kircher
two seconds [12, 18], which is loosely based on the finding that glances away from the road are rarely longer than two seconds [19-21], and also that glances exceeding two seconds are considered dangerous [16, 22]. As indicated, the main motivation is to keep the number of distraction classifications at a reasonable level. There is no explicit theoretical motivation for this grey zone of looking away but not yet being classified as distracted, and the threshold value does not change with situational complexity.
The fact that attention monitoring or distraction detection algorithms do not take situational complexity into account is a general concern with these types of algorithms. “Away from forward” is always defined as a fixed region of interest, typically implemented as a region surrounding the gaze angle representing straight ahead. This fixed definition of straight ahead is problematic since it does not allow the driver to look sideways when going through intersections, or to look into a sharp curve, at least not for more than the granted looking-away time. Minor workarounds have been suggested, such as in the AttenD algorithm [13], which has a built-in mechanism for acknowledging the necessity of mirror and speedometer glances, or in the modified percent road centre algorithm, where the road centre region is expanded to the left or right depending on the curvature of the road [23].
Given the advancements in environmental sensing in combination with theoretical developments in the definition of road user attention, it is now time for algorithms belonging to the attention monitoring branch to take a step forward. A recipe of how modern theory and available data can be merged and implemented in a human- and situation-centred attention monitoring algorithm is proposed. Since the new approach is built on the core concept of the AttenD-algorithm [13], the new approach is simply referred to as AttenD2.0. The main contribution of this paper is a description of the functionality of the proposed algorithm, how these functionalities relate to theory, and how AttenD2.0 differs from existing algorithms. This is then illustrated by a practical example of a first implementation of AttenD2.0 in a simulator environment and a general discussion of the benefits, limitations and open questions related to the proposed algorithm.
II. HUMAN- AND SITUATION-DEPENDENT DISTRACTION DETECTION
It would be naive to say that any looking away from the forward roadway equals distraction, as some glances toward other targets are strictly necessary and other glances do not necessarily impede taking in all relevant information [24]. Also, in less complex environments, drivers have spare capacity at their disposal [25-27], and additional sampling of the forward roadway may not lead to an increase in information intake or improved situational awareness. Moreover, not sampling relevant targets off the forward roadway should also be identified as inattention, for example when neglecting to check the blind spot before a lane change. A scientifically more appealing approach than just claiming that any glance away from the forward roadway equals distraction would be to base the distraction decision on a human- and situation-centred
inattention framework that determines whether all necessary information has been sampled in a given situation [28]. This approach would allow drivers to self-regulate, which influences both the information requirements and the available time to meet them (see also [29]), thus, incorporating spare capacity in a natural way. The drawback is obviously that it is difficult to define the minimum requirements for attentive driving in a situation-dependent manner.
AttenD2.0 is an extension of the AttenD algorithm [13, 30, 31] which brings in elements like context dependency and the possibility to self-pace from the Minimum Required Attention (MiRA) theory [28]. Central to AttenD2.0, as well as to AttenD, is the so-called time buffer which was originally proposed by Holmström and Johansson [32] and Karlsson [33], and then further developed into the AttenD algorithm by Kircher and Ahlstrom [13]. The initial idea was that the driver has a certain amount of time at his/her disposal to look away from the road, assuming that during that time no relevant knowledge can be sampled and existing knowledge decays. When looking away, the buffer is depleted and when looking back to the road the buffer fills up. If the buffer runs empty the driver is classified as distracted. Distraction detection based on the buffer approach conveniently incorporates long glances as well as visual time-sharing behaviour (Fig. 1). This means that a driver is considered distracted both when looking away for too long with a single long glance, or when frequently looking away without sufficiently glancing back at the road in between. In its simplest form, the buffer 𝐵[𝑛] is updated according to equation (1), where 𝑛 is a sample and 𝑇 is the sampling period. For the original AttenD-algorithm the lower limit of the buffer was set to 0 and the upper limit to 2 (seconds). In equation (1), the upper limit will for now be assumed to be 1 (unitless) because it is more convenient in a multi-buffer setting, as will be described in section II.A.
𝐵[𝑛] = 𝐵[𝑛 − 1] + {𝑇 𝑔𝑎𝑧𝑒 ∈ 𝑓𝑜𝑟𝑤𝑎𝑟𝑑
−𝑇 𝑔𝑎𝑧𝑒 ∉ forward (1)
The algorithm uses eye tracking data (foveal targets) defined in the same coordinate system as an accompanying model of the surrounding environment. This world model typically consists of static glance targets such as the windscreen, the left and right windows, the mirrors, and the instrument cluster. With this knowledge about the cockpit of the vehicle, the original AttenD algorithm can acknowledge the need to sample from the forward roadway as well as the mirrors and the speedometer. In practise, this is incorporated by not decreasing 𝐵[𝑛] during the first second of glancing at the mirrors and the speedometer. If gaze tracking is lost, AttenD switches to head tracking and a simplified world model, and if also head tracking is lost, further fall-back solutions exist (see [13]).
Fig. 1 illustrates the similarities and differences between AttenD and AttenD2.0. The coloured bar on top indicates the foveal information sampling targets of a driver over a time while driving along the road sketched at the bottom. A side road on the left-hand side is passed after around 6 seconds and a side road on the right-hand side is passed at 24 seconds. In both
intersections the driver must yield. The driver’s speed profile is also included in the figure. Before reaching the side road on the right-hand side, the driver decelerates and then picks up speed again.
The AttenD algorithm has no knowledge about these side roads. The buffer starts out at the 2 second level with the driver sampling from the forward roadway. When the driver starts interacting with an NDRA, employing a visual time-sharing strategy, the glances towards the additional task are longer than the glances forward and so frequent that the buffer gets depleted and reaches 0 at the red dot marked “A”. Here the driver is classified as distracted. The AttenD buffer increases again when the driver has completed the NDRA. For glances to the speedometer and mirror that are below 1 second in duration, the buffer remains constant (to acknowledge the necessity of mirror and speedometer glances). It starts depleting when a speedometer or mirror glance is longer than 1 second (around 19 seconds and 26 seconds into the drive). While glancing to the right to check the side road, the buffer gets depleted in a similar fashion as for the NDRA, leading to another inattention classification shortly before 24 seconds (“B”). Neglecting to glance to the left to check for traffic on the first side road does not incur any distraction classification in AttenD.
The figure illustrates some of the shortcomings of the original AttenD algorithm. Without knowledge about the environment outside of the car, AttenD cannot estimate whether a glance to the mirror or speedometer is required or not. AttenD therefore implicitly assumes that such glances are always necessary if they are below 1 second in duration. Not sampling from those targets can never lead to a distraction classification. Sampling from other off-forward targets always leads to a decrement, regardless of whether the target is a side road or a mobile phone. Increment and decrement rates are linear over time and do not change, regardless of the driving speed and the
situational complexity.
A. Multiple buffers for context dependency
AttenD2.0 includes multiple buffers, such that each glance target of relevance is linked to its own buffer. Some targets and their buffers are always present, like the forward roadway and the traffic behind via the mirrors. Other targets are intermittent and appear based on traffic regulations and the infrastructural design, including line of sight. They operationalise the static requirements, or “zones”, introduced in the MiRA theory [28]. Examples include the need to check for traffic on side roads with right of way, like in Fig. 1. The zones within which sampling from the side is required are indicated by the pink field marked “Zone 1” and the blue field marked with “Zone 2”. In those instances, an intermittent additional buffer is activated when the vehicle is in the zone. The buffer disappears again once the end of the zone is reached. The more concurrent buffers there are and the quicker they decrement, the more complicated the situation. If any of the buffers runs empty, the driver is considered inattentive. With multiple buffers, it becomes straightforward to account for visual time sharing between several necessary glance targets.
The multiple buffers are denoted with 𝑖 ∈ [1, 𝐼], where 𝐼 is the number of traffic relevant glance targets, equation (2). If an overall measure of the driver’s attention level is desired, all buffers can be multiplied into a unified value 𝐵[𝑛] = ∏ 𝐵𝑖 𝑖[𝑛].
𝐵𝑖[𝑛] = 𝐵𝑖[𝑛 − 1] + {
𝑇 𝑔𝑎𝑧𝑒 ∈ 𝑡𝑎𝑟𝑔𝑒𝑡𝑖
−𝑇 𝑔𝑎𝑧𝑒 ∉ 𝑡𝑎𝑟𝑔𝑒𝑡𝑖 (2)
Returning to Fig. 1, AttenD2.0 classifies the driver as inattentive after about 5 seconds when no glances to the left side road are detected within the pink zone, marked “C”. Also, like the classification made by AttenD, inattention is detected at Fig. 1. A schematic illustration of the AttenD and the AttenD2.0-algorithms based on fictitious glances. From top to bottom: Glance target legend, passed time, glance target progress, AttenD algorithm output, AttenD2.0 algorithm output, AttenD2.0 location based target zones defined according to the MiRA theory (Zone
1 and 2), infrastructural layout. A, B, C and D mark events where the driver is classified as inattentive.
around 11 seconds, marked “D”, due to insufficient forward sampling. As the driver samples extensively from the right, the blue buffer remains almost at 100% throughout Zone 2.
Requirements which are related to the infrastructure can typically be established based on rules and regulations in combination with infrastructural and environmental constraints obtained from digital maps. For example, when approaching an intersection on a feeder road, one must ensure that the main road is clear for passage, and this must be done within a certain time frame, starting when the line of sight becomes unobstructed and ending just before entering the intersection. First attempts have been made to operationalize such static requirements on real roads [34, 35] and in simulators [36]. Static requirements, or “zones”, are implemented partly using multiple intermittent buffers, and by changing the increment and decrement rates in relevant buffers in the vicinity of these zones. The latter is described in section II.D.
Neither AttenD nor AttenD2.0 actively incorporate information gained from peripheral vision, which is a drawback in the currently proposed version. Implications are elaborated upon in the discussion section.
B. Continuous driving task demand weighting
Requirements which are related to other road users and to one’s own movements in relation to the road ahead, do not have as clear boundaries as the static requirements. How often information must be sampled to maintain an up-to-date mental representation varies continuously with the predictability of the upcoming traffic situation, where the predictability is determined by external factors such as the proximity of obstacles and other road users, their speeds, trajectories, and degrees of freedom of movement, in the context of infrastructural information, road conditions, visibility and weather [37-40]. The predictability has implications for how fast the buffers should increment or decrement, which can be controlled by multiplying the sample period 𝑇 with a weight function 𝑤, equation (3). In AttenD2.0, 𝑤 is intended for adaptation towards dynamically changing attentional requirements due to daylight conditions, precipitation and weather, proximity and speed relative to other road users, and surrounding road user types and their degrees of freedom. To a large extent, such information is already available via sensors and threat assessment algorithms in contemporary automated vehicles [41].
As a starting point, AttenD2.0 accounts for self-regulation by speed adaptation, equation (4). The buffers 𝐵𝑖[𝑛, 𝑤] are now dependent not only on time but also on the weight value 𝑤𝑖[𝑣, 𝑠], which is a function of the current speed 𝑣 (km/h) and the speed limit 𝑠 (km/h). Returning to Fig. 1, the speed adaptation was illustrated in conjunction with the side road from the right, where the decrement rate for forward became slower as the speed was reduced. For the same reason, the increment rate became faster.
𝐵𝑖[𝑛, 𝑤𝑖] = 𝐵𝑖[𝑛 − 1, 𝑤𝑖] + { 𝑇 ∙ 𝑤𝑖−1[𝑣, 𝑠] 𝑔𝑎𝑧𝑒 ∈ 𝑡𝑎𝑟𝑔𝑒𝑡𝑖 −𝑇 ∙ 𝑤𝑖[𝑣, 𝑠] 𝑔𝑎𝑧𝑒 ∉ 𝑡𝑎𝑟𝑔𝑒𝑡𝑖 (3) 𝑤𝑖[𝑣, 𝑠] = 1 2(2 1 1+𝑒−0.3(𝑣[𝑛]−𝑠[𝑛]−(10+ 𝑠 10)) + 1 1+𝑒−0.3(𝑣[𝑛]−𝑠[𝑛]+(10+ 𝑠[𝑛] 10 )) ) +1 2 (4)
The weight function thus allows the driver to buy time by lowering the speed [40]. The decrement rate becomes slower when the sampling period 𝑇 is multiplied with 𝑤𝑖[𝑣, 𝑠] in equation (3), and similarly, the increment rate becomes faster when 𝑇 is multiplied with 𝑤𝑖−1[𝑣, 𝑠]. For example, when driving 90 km/h on a 110 km/h road, a buffer that normally runs empty in 2 seconds will now take 2.5 seconds to deplete, see Fig. 2. When the speed starts to deviate from the speed limit, 𝑤𝑖[𝑣, 𝑠] first increases/decreases exponentially, but is later smoothly limited between 0.5 and 2. The quick increase/decrease close to the speed limit is based on the fact that the braking distance is proportional to the square of the velocity. However, the definitions of the upper/lower limits can and should be investigated further.
C. Neural delay latency
It takes a few tens of milliseconds (ms) for visual information to reach the brain, and another about 100 ms for the brain to process that information, possibly down to about 50 ms if the information is expected and we know what we are looking for [42]. The brain compensates for these neural delays through prediction [43, 44], allowing the visual system to perceive and interact with the environment in real-time [45]. When the predictions are wrong, they must be corrected. How predictive and corrective processes interact and on what time course(s) is yet unknown [46]. In the original AttenD algorithm this neural delay was represented by a latency time of 100 ms before the buffer was incremented again.
In AttenD2.0, a latency time 𝑙𝑖, representing either the neural delays, or the time it takes to correct a prediction error, is incorporated according to equation (5). Different latency times 𝑙𝑖 are used for different glance targets 𝑖. The nomenclature ≤ 𝑙𝑖
Fig. 2. Illustration of how the speed adaptation weight function varies with speed and speed limit.
means that the eyes have been directed to glance target 𝑖 for less than 𝑙𝑖 seconds. The default latency time used for forward outward regions in AttenD2.0 is 100 ms due to the increased likelihood of prediction errors in these regions. For mirror regions, the default latency time is set to 50 ms as mirror glances are initially intended to just check if something is present there or not.
𝐵𝑖[𝑛, 𝑤𝑖, 𝑙𝑖] = 𝐵𝑖[𝑛 − 1, 𝑤𝑖, 𝑙𝑖] + { 0 𝑔𝑎𝑧𝑒 ∈ 𝑡𝑎𝑟𝑔𝑒𝑡𝑖, ≤ 𝑙𝑖 𝑇 ∙ 𝑤𝑖−1[𝑣, 𝑠] 𝑔𝑎𝑧𝑒 ∈ 𝑡𝑎𝑟𝑔𝑒𝑡𝑖, > 𝑙𝑖 −𝑇 ∙ 𝑤𝑖[𝑣, 𝑠] 𝑔𝑎𝑧𝑒 ∉ 𝑡𝑎𝑟𝑔𝑒𝑡𝑖 (5)
D. Increment and decrement rates
As mentioned, the static requirements are partly incorporated with intermittent buffers, but also by changing the increment and decrement rates in these buffers. So far, for simplicity, the increment and decrement rates of each buffer have been set to 1. This means that if the driver glances away from region 𝑖 for more than 1 second it will bring the buffer from full to empty (in a visual time-sharing situation with multiple glances away from the region, the total time until the buffer runs empty may of course be much longer). In the original AttenD algorithm, both the increment and decrement rates were set so that the buffer would run empty after a 2 second glance. As already indicated in the introduction, this threshold was a compromise to achieve a satisfactory sensitivity while keeping the probability of false distraction detections at an acceptable level.
AttenD2.0 uses situation and buffer dependent increment and decrement rates. An update of the buffer equation is provided in equation (6), where the speed of increment/decrement is controlled by 𝑑𝑒𝑐𝑟𝑒𝑚𝑒𝑛𝑡𝑅𝑎𝑡𝑒𝑖[𝑛] and 𝑖𝑛𝑐𝑟𝑒𝑚𝑒𝑛𝑡𝑅𝑎𝑡𝑒𝑖[𝑛]. Note that these parameters are defined both as a function of time [𝑛] and buffer 𝑖. This is important since the information content that each buffer represents is situation dependent and may thus change over time. For example, driving with cruise control modifies the need to monitor the speedometer (set 𝑑𝑒𝑐𝑟𝑒𝑚𝑒𝑛𝑡𝑅𝑎𝑡𝑒𝑖[𝑛] to a lower value), a winding road requires
more monitoring of the forward roadway (set
𝑑𝑒𝑐𝑟𝑒𝑚𝑒𝑛𝑡𝑅𝑎𝑡𝑒𝑖[𝑛] to a higher value), and the presence of an on-ramp on a motorway increases the need to monitor the sides and the mirrors (set the 𝑑𝑒𝑐𝑟𝑒𝑚𝑒𝑛𝑡𝑅𝑎𝑡𝑒𝑖[𝑛] to a higher value for the regions 𝑖 of interest). As a starting point, and analogue to the original AttenD algorithm, 𝑑𝑒𝑐𝑟𝑒𝑚𝑒𝑛𝑡𝑅𝑎𝑡𝑒𝑖[𝑛] is set to 0.5 for the buffer linked to the forward roadway. For other buffers, such as the mirror buffer, 𝑑𝑒𝑐𝑟𝑒𝑚𝑒𝑛𝑡𝑅𝑎𝑡𝑒𝑖[𝑛] can be set to considerably lower values, i.e. longer time until the buffer runs empty. In essence, the 𝑑𝑒𝑐𝑟𝑒𝑚𝑒𝑛𝑡𝑅𝑎𝑡𝑒𝑖[𝑛] and 𝑖𝑛𝑐𝑟𝑒𝑚𝑒𝑛𝑡𝑅𝑎𝑡𝑒𝑖[𝑛] are used to manipulate static information or information that change in a discrete manner, whereas 𝑤 is used to adapt to continuously changing demands such as driving speed. 𝐵𝑖[𝑛, 𝑤𝑖, 𝑙𝑖] = 𝐵𝑖[𝑛 − 1, 𝑤𝑖, 𝑙𝑖] + { 0 𝑔𝑎𝑧𝑒 ∈ 𝑡𝑎𝑟𝑔𝑒𝑡𝑖, ≤ 𝑙𝑖 𝑇 ∙ 𝑤𝑖−1[𝑣, 𝑠] ∙ 𝑖𝑛𝑐𝑟𝑒𝑚𝑒𝑛𝑡𝑅𝑎𝑡𝑒𝑖[𝑛] 𝑔𝑎𝑧𝑒 ∈ 𝑡𝑎𝑟𝑔𝑒𝑡𝑖, > 𝑙𝑖 −𝑇 ∙ 𝑤𝑖[𝑣, 𝑠] ∙ 𝑑𝑒𝑐𝑟𝑒𝑚𝑒𝑛𝑡𝑅𝑎𝑡𝑒𝑖[𝑛] 𝑔𝑎𝑧𝑒 ∉ 𝑡𝑎𝑟𝑔𝑒𝑡𝑖 (6) In the original AttenD algorithm, the buffer increases and decreases linearly as a function of time. If the buffers are supposed to reflect the attentional level of the driver, this is most likely not a true representation. Senders, et al. [47] modelled information density as a monotonically decreasing exponential function, where greater importance was assigned to objects nearby since they require a more immediate response. Based on this idea, the buffer equation is updated according to equation (7). As before, the inverse of the 𝑑𝑒𝑐𝑟𝑒𝑚𝑒𝑛𝑡𝑅𝑎𝑡𝑒𝑖[𝑛] determines the time for a single glance to bring buffer 𝑖 from full to empty. The two parameters 𝜏𝑜𝑓𝑓,𝑖[𝑛] and 𝜏𝑜𝑛,𝑖[𝑛] in equations (8) and (9) represent the time since the last glance away from and to region 𝑖, respectively. The conditions 𝑠ℎ𝑖𝑓𝑡 𝑜𝑓𝑓 → 𝑜𝑛 and 𝑠ℎ𝑖𝑓𝑡 𝑜𝑛 → 𝑜𝑓𝑓 make sure that 𝐵𝑖[𝑛, 𝑤, 𝑙𝑖] continues to increase/decrease from the correct amplitude value. 𝐵𝑖[𝑛, 𝑤𝑖, 𝑙𝑖] = { 𝐵𝑖[𝑛 − 1, 𝑤𝑖, 𝑙𝑖] 𝑔𝑎𝑧𝑒 ∈ 𝑡𝑎𝑟𝑔𝑒𝑡𝑖, ≤ 𝑙𝑖 𝑚𝑖𝑛(1,1 − 𝑒−𝑖𝑛𝑐𝑟𝑒𝑚𝑒𝑛𝑡𝐶𝑜𝑒𝑓𝑓𝑖[𝑛]∙𝜏𝑜𝑛,𝑖[𝑛]) 𝑔𝑎𝑧𝑒 ∈ 𝑡𝑎𝑟𝑔𝑒𝑡 𝑖, > 𝑙𝑖 𝑚𝑎𝑥 ( 0,1 + 𝑒 −𝑑𝑒𝑐𝑟𝑒𝑚𝑒𝑛𝑡𝐶𝑜𝑒𝑓𝑓𝑖[𝑛] 𝑑𝑒𝑐𝑟𝑒𝑚𝑒𝑛𝑡𝑅𝑎𝑡𝑒𝑖[𝑛] − ⋯ 𝑒𝑑𝑒𝑐𝑟𝑒𝑚𝑒𝑛𝑡𝐶𝑜𝑒𝑓𝑓𝑖[𝑛](𝜏𝑜𝑓𝑓,𝑖[𝑛]− 1 𝑑𝑒𝑐𝑟𝑒𝑚𝑒𝑛𝑡𝑅𝑎𝑡𝑒𝑖[𝑛]) ) 𝑔𝑎𝑧𝑒 ∉ 𝑡𝑎𝑟𝑔𝑒𝑡𝑖 (7) 𝜏𝑜𝑛,𝑖[𝑛] = { 0 𝑔𝑎𝑧𝑒 ∉ 𝑡𝑎𝑟𝑔𝑒𝑡𝑖 − 𝑙𝑛(1−𝐵𝑖[𝑛−1,𝑤,𝑙𝑖]) 𝑖𝑛𝑐𝑟𝑒𝑚𝑒𝑛𝑡𝐶𝑜𝑒𝑓𝑓𝑖[𝑛] 𝑠ℎ𝑖𝑓𝑡 𝑜𝑓𝑓 → 𝑜𝑛 𝜏𝑜𝑛,𝑖[𝑛 − 1] + 𝑇 ∙ 𝑤𝑖−1[𝑣, 𝑠] 𝑔𝑎𝑧𝑒 ∈ 𝑡𝑎𝑟𝑔𝑒𝑡𝑖 (8) 𝜏𝑜𝑓𝑓,𝑖[𝑛] = { 0 𝑔𝑎𝑧𝑒 ∈ 𝑡𝑎𝑟𝑔𝑒𝑡𝑖 𝑙𝑛(1+𝑒− 𝑑𝑒𝑐𝑟𝑒𝑚𝑒𝑛𝑡𝐶𝑜𝑒𝑓𝑓𝑖[𝑛] 𝑑𝑒𝑐𝑟𝑒𝑚𝑒𝑛𝑡𝑅𝑎𝑡𝑒𝑖[𝑛]−𝐵𝑖[𝑛−1,𝑤,𝑙𝑖]) 𝑑𝑒𝑐𝑟𝑒𝑚𝑒𝑛𝑡𝐶𝑜𝑒𝑓𝑓𝑖[𝑛] − 1 𝑑𝑒𝑐𝑟𝑒𝑚𝑒𝑛𝑡𝑅𝑎𝑡𝑒𝑖[𝑛] 𝑠ℎ𝑖𝑓𝑡 𝑜𝑛 → 𝑜𝑓𝑓 𝜏𝑜𝑓𝑓,𝑖[𝑛 − 1] + 𝑇 ∙ 𝑤𝑖[𝑣, 𝑠] 𝑔𝑎𝑧𝑒 ∉ 𝑡𝑎𝑟𝑔𝑒𝑡𝑖 (9)
The increment and decrement rates of each buffer are coupled with an increment and a decrement coefficient. The 𝑑𝑒𝑐𝑟𝑒𝑚𝑒𝑛𝑡𝐶𝑜𝑒𝑓𝑓𝑖[𝑛] determines for how long, in the time span from 0 to 1 𝑑𝑒𝑐𝑟𝑒𝑚𝑒𝑛𝑡𝑅𝑎𝑡𝑒⁄ 𝑖[𝑛], the buffer should remain high before it starts to deplete. Note that the coefficient values do not have an impact on when a buffer reaches zero if the buffer is depleted with a single long glance. However, during visual time-sharing with several glances away from region 𝑖, the coefficients will affect the time it takes for the buffer to deplete. Examples of how different values of 𝑖𝑛𝑐𝑟𝑒𝑚𝑒𝑛𝑡𝐶𝑜𝑒𝑓𝑓𝑖[𝑛] and 𝑑𝑒𝑐𝑟𝑒𝑚𝑒𝑛𝑡𝐶𝑜𝑒𝑓𝑓𝑖[𝑛] affect 𝐵𝑖[𝑛, 𝑤𝑖, 𝑙𝑖] are provided in Fig. 3. Low coefficient values ≤ 1 are suitable for buffers representing regions where visual time-sharing is an important concept. This includes forward regions, regions covering intersections, and similar. With low coefficient values, the buffers will start to decrease/increase as soon as the driver looks away/back. With higher coefficient values the buffer will fill up quickly, thus reducing the contribution of glance history in 𝐵𝑖[𝑛, 𝑤𝑖, 𝑙𝑖]. For buffers representing regions that are not sampled very often, such as the side mirrors on many roads, it makes sense to use higher coefficient values, particularly if a unified attention measure is desired. This is because when several non-full buffers are multiplied with each other, the product will be very low, resulting in an attentional score which is misleadingly low.
The implementation assumes that the mental model of the surrounding environment remains accurate for a while but then turns more and more inaccurate. For glance targets with slower information decay rate, such as the mirrors in a situation where traffic from behind is less relevant, the buffers remain full for a long time until they eventually decrease rather quickly. This implementation also assumes that much visual information is gained initially, and that the rate of new information acquisition then slows down. This assumption is in line with research on natural scene understanding stating that observers can quickly acquire the gist of a scene [48] and that brief views of a dynamic road scene can be used to develop representations which enable prediction and action [49, 50]. However, at the same time, this assumption is in contrast to hazard perception research that states that it takes about 7 seconds after an off-road glance to
detect intrusions [51] and that sub-second viewing times are probably too short for processing dynamic traffic scenes [52].
III. CASE STUDY –AUTOMATIC DOCKING AT BUS STOPS This section will exemplify how AttenD2.0 was configured in a simulator experiment which investigated automatic docking at bus stops [53]. The intention of this feasibility study is partly to provide an example with concrete values of different parameters and design choices, and partly to showcase how AttenD2.0 can be used for real-time inattention detection. Note that the experiment was designed to evaluate the bus stop docking and depot functionality, where AttenD2.0 is but one component, rather than to evaluate AttenD2.0. For the latter purpose, it would have been favourable to design an experiment as outlined in Fig. 1. Such an experiment was unfortunately out of scope in the present project.
A. Background
In bus driving, inattention and fatigue are considered to be the most common causes of road crashes [55] and crash analyses have particularly highlighted “inattention”, “failure to yield” and “not in lane” as causes of fatal city bus accidents [56]. The sources of distraction causing accidents include those that arise from the driving task itself, and those that derive from the additional requirements associated with bus operation, such as passenger and ticketing-related incidents [54]. The overall aim of the case study was to relieve the bus driver from one of the most demanding and stressful tasks, i.e. to approach and depart from the bus stops. It is hypothesized that by automating the docking and depot procedure, many risky situations related to vulnerable road users outside the bus, as well as risks associated with passenger boarding and unloading, can be avoided. However, when automating this procedure, it is crucial to make sure that the driver is ready to take back control of the bus before exiting the bus stop area. Here, AttenD2.0 was used to ensure that the driver was ready.
B. Methods
The study was conducted in the VTI Driving Simulator II, a high-fidelity moving base simulator with linear lateral motion. The visual system consists of a 98-inch ultra-HD monitor positioned as close to the windscreen as possible and two 55-inch HD monitors mounted on each door. The simulator software is developed in-house but is based on OpenDRIVE 1.5 and OpenSceneGraph 3.4. The vehicle model and motion cueing software were developed in-house. Eye movements were captured with a remote four-camera eye tracking system (Smart Eye Embedded, Smart Eye AB, Gothenburg, Sweden), measuring the driver’s gaze direction at a rate of 50 Hz. The AttenD2.0 algorithm and a Smart Eye interface were implemented as addon modules in the simulator software environment, both operating at 50 Hz.
Sixteen professional bus drivers (age 26 – 62 years, 3 women) with at least 2 years of bus driving experience participated in the study. They drove a route with 10 bus stops in an urban environment on two occasions. All drives were conducted in the afternoon, once after being off duty in the Fig. 3. Illustration of how different values of 𝑐𝑜𝑒𝑓𝑓 =
𝑖𝑛𝑐𝑟𝑒𝑚𝑒𝑛𝑡𝐶𝑜𝑒𝑓𝑓𝑖[𝑛] = 𝑖𝑛𝑐𝑟𝑒𝑚𝑒𝑛𝑡𝐶𝑜𝑒𝑓𝑓𝑖[𝑛] change the shape of the buffer (here 𝑙𝑖= 0, 𝑤[𝑣, 𝑠] = 1, 𝑑𝑒𝑐𝑟𝑒𝑚𝑒𝑛𝑡𝑅𝑎𝑡𝑒𝑖[𝑛] = 0.25).
morning and once in a split shift condition after an early morning shift. Since there were no large differences between the conditions the data has been merged in this paper. On each occasion, the participants drove a familiarization route (10 minutes) followed by the experimental route with manual driving (15 minutes) versus automated docking (15 minutes), in a counterbalanced order. Each participant received 2000 SEK (≈200 USD) for participation to compensate for loss of income. The study was approved by the regional ethics committee in Linköping, Sweden (EPN 2018/421-31).
Automated docking was implemented as a system-initiated function that was activated when approaching the bus stop area. The system then asked the driver, by lighting up an LED-strip in the steering wheel and around the windscreen and by a subtle audio alert, if he/she was ready to hand over control to the bus. The driver responded by pressing a button on the steering wheel. If the driver agreed, the bus automatically docked at the bus stop. When all passengers had boarded/deboarded, the bus asked the driver via the LED-strips and the audio alert if it should depart. The bus driver agreed by pressing the button on the steering wheel. Before leaving the bus stop area, the bus informed the driver that it was now time to take back control from the bus via an escalating HMI solution. If the driver (a) confirmed and (b) was found to be fit to drive according to the driver monitoring systems, the system switched from automated to manual driving. If the system determined that the driver was not fit to drive, the bus initiated a safe stop manoeuvre.
While driving manually between the bus stops, the driver performed a visual-manual NDRA in 2 of 10 road stretches. The activity was framed as a ticketing machine task, where the driver first had to tap a highlighted bar (one out of three) to select if the ticket was for a youth, an adult, or a senior passenger. This was followed by 6 taps on either of 3 buttons which were randomly highlighted. After completion, the ticket type bar turned green and the task was completed. The touch screen was mounted on the centre stack.
C. AttenD2.0 implementation
The AttenD2.0 implementation used in the simulator study included five different buffers representing the forward roadway, the left mirror, the right mirror, the bus stop and the steering wheel. The forward region (FR) was defined as the windscreen from top to bottom and from the left A-pillar to the
rear-view mirror. The 𝑑𝑒𝑐𝑟𝑒𝑚𝑒𝑛𝑡𝑅𝑎𝑡𝑒𝐹𝑅[𝑛] and
𝑖𝑛𝑐𝑟𝑒𝑚𝑒𝑛𝑡𝑅𝑎𝑡𝑒𝐹𝑅[𝑛] were set to 0.5, the
𝑖𝑛𝑐𝑟𝑒𝑚𝑒𝑛𝑡𝐶𝑜𝑒𝑓𝑓𝑖[𝑛] and 𝑑𝑒𝑐𝑟𝑒𝑚𝑒𝑛𝑡𝐶𝑜𝑒𝑓𝑓𝑖[𝑛] were set to 1, and 𝑙𝐹𝑅 was set to 100 ms. The bus stop (BS) area was defined as a square covering the bus stop, located just to the right of the forward region, and with the same parameter values as the forward region. However, in contrast to the forward buffer, 𝐵𝐵𝑆[𝑛, 𝑤𝑖, 𝑙𝑖] was only active from when the bus entered the bus stop area until the bus reached the bus stop. The left (LM) and right (RM) side-view mirrors were defined as square regions surrounding the mirrors. To compensate for eye tracking inaccuracies these regions were made about 0.05 meters larger on all sides compared to the physical mirrors. Decay rates were
set to 𝑑𝑒𝑐𝑟𝑒𝑚𝑒𝑛𝑡𝑅𝑎𝑡𝑒𝐿𝑀[𝑛] = 1 60⁄ and
𝑑𝑒𝑐𝑟𝑒𝑚𝑒𝑛𝑡𝑅𝑎𝑡𝑒𝑅𝑀[𝑛] = 1 120⁄ . When departing from the bus stop, 𝑑𝑒𝑐𝑟𝑒𝑚𝑒𝑛𝑡𝑅𝑎𝑡𝑒𝐿𝑀[𝑛] was changed to 1 20⁄ , thus requiring the driver to check for traffic from behind before exiting the bus stop area and merging back into the main road. The increment rate was set so that the mirror buffers were immediately filled up after a latency of 50 ms. The last buffer included in this experiment was a hands-on buffer, tracking when the driver had at least one hand on the steering wheel (SW). 𝐵𝑆𝑊[𝑛, 𝑤𝑖, 𝑙𝑖] is thus based on whether the driver has his/her hands on the steering wheel and not on visual information intake. This is motivated by the importance of having the hands on the steering wheel before lateral control is
transferred from the bus to the driver. The
𝑑𝑒𝑐𝑟𝑒𝑚𝑒𝑛𝑡𝑅𝑎𝑡𝑒𝑆𝑊[𝑛] was set to 0.5 and the increment rate was set to immediately fill 𝐵𝑆𝑊[𝑛, 𝑤𝑖, 𝑙𝑖] to 1, with 𝑙𝑆𝑊= 0. All buffers were deactivated when approaching the bus stop in automated mode, as the driver did not have to be attentive when the bus was operating in fully automated mode. The 𝑑𝑒𝑐𝑟𝑒𝑚𝑒𝑛𝑡𝐶𝑜𝑒𝑓𝑓𝑖[𝑛] for the mirrors and the steering wheel were set to 3. Self-regulation by speed adaptation was implemented as per section II.B. In the transition instant, control was only transferred back to the driver if at least one hand was on the steering wheel, if the combined attention buffer 𝐵[𝑛] = ∏ 𝐵𝑖 𝑖[𝑛] was non-decreasing and ≥ 0.1, and if the driver had checked the left side-view mirror at least once. If the driver was found to be inattentive in the transition instant, the bus initiated a safe stop procedure. In other parts of the trip, the driver was only made aware of a distraction event via a silent change in a small emoticon next to the speedometer in the instrument cluster.
D. Results
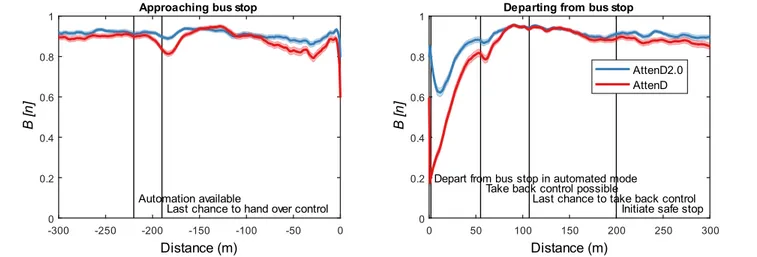
A safe stop procedure was initiated on 12 of 320 occasions as AttenD2.0 classified the driver as inattentive. Five of these safe stops were a direct consequence of eye tracking issues, either due to lost tracking or due to poorly estimated gaze direction, so that glances to the left mirror were not registered as such. The mean ± std 𝐵[𝑛] for the original AttenD algorithm and the combined AttenD2.0 output, plotted as functions of distance from the bus stop, are provided in Fig. 4. On average, the drivers were attentive while approaching the bus stop. There is a small decrement in 𝐵[𝑛] after the bus announced that automation was available, especially after the escalating HMI communicated that it was the last chance to hand over control to the bus. To a large extent, the decrease occurred when the drivers looked for the confirmation button on the steering wheel. A corresponding small dip in the curves is also seen when control is given back to the driver when departing from the bus stop. The drivers’ attention level gradually increases after the standstill at the bus stop. AttenD and AttenD2.0 follow similar patterns both when approaching and departing from the bus stop, with AttenD varying slightly more. One algorithm-inherent difference is that AttenD2.0 starts out at 1 upon departing from the bus stop, while AttenD starts out with a low value. This is due to the integration of automation in AttenD2.0, which demands that the driver fulfils certain requirements, like
checking the left mirror in the actual case, before the bus hands back control to the driver.
An example showing how the AttenD and AttenD2.0 buffers change while one driver is carrying out the ticketing task is provided in Fig. 5. Typical visual time-sharing behaviour is here seen as intermittent decreases and increases in 𝐵[𝑛] as the driver shifts his/her gaze between the NDRA-screen and the forward roadway. The mean ± std AttenD and AttenD2.0 buffers as a function of distance driven, along with the number of times that 𝐵[𝑛] = 0 are illustrated in Fig. 6. According to AttenD2.0, the drivers were inattentive in 93.8% of the NDRAs (8.1% in the matched baselines without NDRA). The mean ± std number of distraction events per ticketing task interaction was 2.4 ± 1.3 (0.1 ± 0.5 during baseline). Note that two of the AttenD2.0 distraction detections arose due to neglect of the mirrors, both of which occurred during baseline driving. The corresponding percentages for the original AttenD algorithm were 95.1% and 6.9%, respectively, and the number of distraction detections were 3.5 ± 1.4 during the ticketing task and 0.1 ± 0.6 during the matched baseline. The slight reduction
in the number of distraction detections for AttenD2.0 is mostly a consequence of the exponential increment/decrement which fills/empties 𝐵𝑖[𝑛] faster/slower in the beginning, which can also be seen in Fig. 5.
E. Discussion
In the presented case study, the combined AttenD2.0 output and AttenD follow rather similar patterns, indicating inattention when engaged in the NDRA and showing a rather high level of alertness otherwise. AttenD reacts slightly more to the drivers’ looking for the confirmation button upon handing over and taking back control. This is connected to the fact that in AttenD2.0 the distraction classification for off-forward glances is slightly delayed, due to the shape of the decrement function, and also because mostly the forward buffer is affected, while the mirror buffers only decrease slightly.
During the NDRA execution, the combined AttenD2.0 output remains at a higher level than AttenD, and overall, the number of issued inattention classifications is slightly lower. The absolute value of the AttenD2.0 output cannot be compared directly with AttenD, as it is a product of several values. However, the two are following the same trend with decreasing buffers when the NDRA is introduced, followed by much lower levels than during baseline driving. This is a sign that the two algorithms interpret behaviour in a similar way. There is no hard conclusion as to whether AttenD or AttenD2.0 is more correct with the number of actual inattention classifications, and this number is also dependent on the settings of the different functions. It is logical and lends credibility to both algorithms, i.e. that there are many more inattention classifications while executing the NDRA than when only driving.
AttenD2.0 can differentiate between inattention to the forward roadway and neglecting mirrors and other important targets. AttenD2.0 is also more flexible when it comes to adapting the algorithm output based on the current demands on the driver. In this example with automatic docking at bus stops, this flexibility is unfortunately not appropriately demonstrated as the demands on the driver are more or less binary, where no demands during full automation are contrasted to low demands during manual driving and high demands while performing the Fig. 4. Mean ± std of 𝐵[𝑛] when approaching/departing from the bus stop. The vertical lines indicate when the escalating HMI starts to communicate with the
driver. Safe stops have been excluded.
Fig. 5. Examples of 𝐵[𝑛] from AttenD and Attend2.0 when one driver performed a visual-manual NDRA (starting at distance=0).
ticketing task. In a situation with partial or conditional automation, where the attentional requirements on for example speed maintenance are reduced, the differences between AttenD and AttenD2.0 are expected to be larger. The same holds true when moving from the driving simulator scenario used here, where the number of concurrent attentional requirements was very low, to a less strict and more vivid environment. Only in a situation where the driver must time-share between several relevant information sources will the multiple buffers show their true potential. This case study is the first implementation of AttenD2.0. The next steps will be to evaluate AttenD2.0 in a simulator experiment based on the outline in Fig. 1, followed by evaluations in real traffic.
Only descriptive analyses were made in this case study, and no comparisons were made between AttenD2.0 and a driver inattention ground truth. In long-term field studies the impact of distraction alerts can be investigated in terms of altered visual scan patterns or reduced numbers of crashes and critical events [30]. Such an approach is not viable in a controlled simulator experiment. Another approach is to use NDRA performance as a ground truth, or to equal NDRA usage with inattention [e.g. 12]. However, this approach does not take self-regulation, spare capacity, and driver adaptation into account. Using situational awareness probes or verbal protocols in the experimental protocol can be helpful but will only add information that is verbally accessible. Another option is to use some other distraction detection algorithm as ground truth. The original AttenD algorithm has actually been used as ground truth of distraction [57] as well as for attention management [58]. This approach does not really solve the ground truth issue though, and it hampers further developments in the field, since it is impossible to be better than the “ground truth”. How to objectively evaluate and compare different distraction detection algorithms remain an open question.
IV. GENERAL DISCUSSION
Many of the original AttenD-features were compromises restricted by the technology available at the time. No environmental data, except for the location of the mirror, the speedometer and the windscreen were available in real-time. AttenD2.0 incorporates several important conceptual changes, transforming AttenD into a proactive, situation-sensitive, human-centred algorithm. The updates made to the algorithm are mainly based on theoretical considerations. The actual values for the functions in AttenD2.0 should probably be adjusted in future versions as more empirical evidence becomes available. There are still issues that need to be solved, both on the theoretical and on the practical side. Some of these issues can be addressed in future work, while others may be inherently more difficult to incorporate in a real-time algorithm.
A. Decisions on buffer-related features
By incorporating multiple buffers, adapted to situational circumstances, self-regulation and dynamically changing demands, AttenD2.0 has the potential to reflect the driver’s attention level much better than the rather coarse AttenD algorithm. However, this also necessitates that the in-data are correct. A fundamental assumption is that much of the information needed for driving has to be acquired by central vision. The currently active buffers, their relation to the surrounding environment, and the factors influencing the increment and decrement functions need to be identified correctly. Appropriate parameter settings are likely to be found in an iterative process including both theory and empirical evidence. Thus, the buffers and values presented here are a first attempt and are likely to be updated and fine-tuned over time.
The borders of static zones must be connected to traffic rules and physical circumstances, e. g. the possibility to see into side roads, over hill crests or through trees and hedges. As a first step, this can be done manually site by site, but for a workable implementation, this needs to be done automatically, for Fig. 6. The curves show the mean ± std of the AttenD2.0 buffer 𝐵𝑖[𝑛, 𝑤, 𝑙𝑖] as a function of distance driven while performing visual-manual NDRA (red) versus during a matched baseline (blue). The red upwards pointing bars represent the number distraction detections during NDRA and the blue downwards pointing bars
represent distraction detections during the matched baseline. The NDRA starts at distance=0.
example based on 3D-models of cities and detailed elevation data in the countryside. Driving speed may also influence the boundaries of certain zones. For example, in an intersection where it is necessary to give way to other traffic, the stopping distance will affect the end boundary of the zone.
The adaptation of the requirements to dynamically changing features necessitates that these features are known. Confirming that a side road is empty from traffic for the time needed to cross it may require only one glance in that direction, but assessing whether the gap between a car and a cyclist approaching on that same road will be big enough can require multiple glances with rather fixed timing. It remains to be determined which level of detail is necessary, realistic, reasonable and meaningful. Commencing with the static requirements and minimum requirements seems like a good start, as a failure to meet those requirements can be classified as inattention on well-founded theoretical grounds.
AttenD2.0 as implemented in the case study on automatic docking at bus stops assumes that the difference between driving speed and the posted speed limit has the same global influence on all buffers. This is a simplification that should be modified in future versions. It is thinkable, for example, that reduced speed requires increased attention to traffic from behind, even though it may decrease the demands from forward targets. Further differentiations could include whether the targets are static, such that a speed reduction allows for more sampling time, or dynamic, such that a speed reduction does not necessarily have that effect.
The presented case study already shows that buffers do not necessarily need to rely on foveal visual sampling. Here, a requirement to hold the steering wheel was used. For higher automation, getting back into the driving position could be another requirement, and also some form of acknowledgement of auditory signals. A possible application of AttenD2.0 to other transport modes like cycling would stress the multimodal aspects of requirement fulfilment, as cyclists use auditory information more than car drivers [59]. This shows in all clarity that the confirmation of requirement fulfilment is complicated. While eye tracking appears comparatively easy, it can still be difficult to tell whether the necessary information could be acquired via peripheral vision, and a foveal fixation does not necessarily mean that the target was mentally processed. Both hazard perception with peripheral vision and a failure to process information that should have been seen have been demonstrated [50]. Confirming the uptake of auditory information is not trivial, and for haptic or position related requirements new sensors may need to be developed. For true attention monitoring, it would be necessary to assess what the driver knows about a given situation and to compare this to what the driver should know, and what a driver knows cannot be measured directly but has to be deducted from observable data. While important and necessary for the implementation of the algorithm, this is a problem that affects all driver state assessments to some extent and is therefore not discussed in detail here.
B. Comparison of AttenD and AttenD2.0
The change to multiple buffers is the most crucial update in AttenD2.0. It enables the algorithm to become truly situation dependent, where the number of concurrent active buffers, in combination with their respective decrement rates and weights, determine the demand on the driver. Higher numbers of parallel buffers and faster decrement rates make it more difficult to prevent the buffers from running empty. It also requires a more structured glance pattern. Integrating an NDRA becomes more difficult in such a situation than when only few buffers with slow decrement rates are active. The original AttenD algorithm cannot differentiate between varying situational demands. For example, an NDRA engagement that leads to a distraction classification in an urban intersection would be diagnosed equally on an empty rural road.
Another important aspect of multiple buffers is the possibility to identify attentional targets and thereby also the source of distraction. In AttenD, it was assumed that all relevant attentional targets were roughly in front of the driver, and looking away from this region led to a degradation of the driver’s level of attention. This is illustrated in Fig. 1 with the example of the second intersection. AttenD2.0 recognises the need to check side roads, blind spots and other regions away from forward, depending on the situation, and even requires the driver to do so. Therefore, AttenD2.0 can be much more specific in its identification of an attentive driver, and also in classifying the type of distraction.
AttenD operates with time as the fundamental factor determining the change in the output. Each time unit of either looking to or away from the forward roadway leads to a change in the output with the same amount, disregarding the theoretically motivated delays. Instead, in AttenD2.0 this is modified to reflect information density and decay. As described above, the gist of a scene can be acquired within a very short amount of time [48-50], whereas filling in the details occurs more slowly, which is reflected by the non-linear form of the information acquisition function. In a similar way, information is not assumed to decay linearly, but that decay accelerates over time, influenced both by actual changes in the outside world and a growing imprecision in the driver’s mental model. This is practically noticeable in visual time sharing, where the same time-sharing behaviour leads to a later distraction classification in AttenD2.0 as compared to AttenD (see also Fig. 1).
Self-regulation and dynamic weighting based on task demand and driving speed, which is new in AttenD2.0, is also meant to reflect the information decay. A faster speed leads to quicker changes in the environment, such that information becomes outdated and should be updated more frequently. At slower speeds, the opposite occurs. This shows also in an intuitive manner how the driver can adjust the flow of information to a certain extent, which is in line with the concept of driving as a partially self-paced task [40]. Self-regulation is also part of the multiple buffer approach in that both strategical and tactical choices by the driver influence the number and type of buffers present. This includes different levels of automation, where the presence of adaptive cruise control relieves the driver from monitoring the speedometer, but instead introduces the
requirement to make sure that the automation functionality is operating.
The output of AttenD consisted of one single value, which could in principle be interpreted as a representation of the driver’s attentional state. For AttenD2.0, no such intuitive value is available. Given the fact that there are always several buffers active, but that it is not possible for the driver to sample from all targets at the same time, there cannot be a situation where all buffers are full simultaneously. Therefore, an average of all buffer values does not return a useful measurement. In the case study, the product of all values was used instead. This has the advantage that when any buffer reaches zero, the unified buffer 𝐵[𝑛] will be zero as well. On the negative side, using the product can be misleading since a higher number of buffers automatically leads to a lower overall value as more numbers in the interval [0, 1] are multiplied. Also, the unified value of 𝐵[𝑛] is highly dependent on the increment and decrement coefficients since these parameters control for how long the individual buffers will be close to 1. Other options for indicating the driver’s overall state of attentiveness can be considered. One approach would be to count the percentage of buffers under a certain value, another might be a value indicating the likelihood that at least one buffer will run empty given the circumstances. A unified 𝐵[𝑛] based on these ideas could be based on the number and type of buffers present, the associated decrement rate and the typical mode of and duration needed for information sampling. These options might be more representative of an actual risk for inattention than a simple product of the values. One illustration of this is a situation where a driver ensured the absence of traffic in a side street. No additional sampling from that side is necessary, but still, the buffer for the side street will decrease over time, even though it will not reach zero, as the requirement to scan the side street has been fulfilled. A decreasing buffer value will still cause a product to decrease, whereas the likelihood for the buffer to run empty would be zero. This shows that the way that buffers are combined is crucial for meaningful interpretation, and it must be observed that information is lost by combining the different buffers into one.
C. Future work
The goal is to expand the concept from the simulator to real-world environments by automatically integrating situational information from the vehicle’s environmental sensing [60] and geospatial databases and digital maps [61].
We foresee future work to proceed along several lines: The core features of AttenD2.0 need to be specified based on theory supported by empirical evidence. Equations, threshold values and rates of change will need adjustment based on additional empirical data. Automated ways of implementing static zones and further down the line also dynamic targets need to be developed. Sensors for improved monitoring of driver behaviour can boost confidence in state assessment.
Already today, access to geospatial databases in combination with environmental sensing provides the preconditions for the automatic implementation of several static zones as well as speed, weather and traffic density weighting. Other features,
like additional intermittent buffers related to dynamic targets and the associated continuous task demand weights, are more difficult to specify, because the targets’ idiosyncratic nature necessitates large-scale data collections for an acceptable requirement approximation, at the same time as the dynamic targets need to be identified correctly.
V. CONCLUSIONS
AttenD2.0 has a stronger anchoring in theory compared to its predecessor. The algorithm also has more degrees of freedom allowing scalability relative to available data sources and to the level of automation. In its most basic form, AttenD2.0 consists of a forward buffer and buffers for the mirrors and speedometer, with fixed increment and decrement rates and weightings. While very similar to the original AttenD, even in this implementation AttenD2.0 will differentiate between off-forward inattention and inattention due to a neglected mirror. All additional information that can be implemented will improve the performance of the algorithm both with respect to inattention detection and classification, especially in terms of reduced false detections. This is a substantial advancement and can be considered a conceptual U-turn in the underlying theory which informs implementation – the goal is to assess attention, which leads to distraction identification as a natural and logical by-product, instead of trying to detect distraction directly and thereby introducing undefined grey-zones in the algorithm output.
ACKNOWLEDGMENT
The authors are grateful to Anna Anund for planning and carrying out the ADAS&ME bus driver experiment, to Andreas Jansson and Kristoffer Jäsperi for implementing the driving simulator scenarios, and to Clara Berlin for help with the data collection.
REFERENCES
[1] A. Fernández, R. Usamentiaga, J. Carús, and R. Casado, "Driver Distraction Using Visual-Based Sensors and Algorithms," Sensors, vol. 16, no. 11, p. 1805, 2016.
[2] N. M. Yusoff, R. F. Ahmad, C. Guillet, A. S. Malik, N. M. Saad, and F. Mérienne, "Selection of measurement method for detection of driver visual cognitive distraction: A review," IEEE Access, vol. 5, pp. 22844-22854, 2017.
[3] A. D. McDonald, T. K. Ferris, and T. A. Wiener, "Classification of driver distraction: A comprehensive analysis of feature generation, machine learning, and input measures," Human Factors, p. 0018720819856454, 2019.
[4] S. Leonhardt, L. Leicht, and D. Teichmann, "Unobtrusive vital sign monitoring in automotive environments—A review," Sensors, vol. 18, no. 9, p. 3080, 2018.
[5] B. Wolfe, B. D. Sawyer, and R. Rosenholtz, "Toward a Theory of Visual Information Acquisition in Driving," Human Factors, p. 0018720820939693, 2020.
[6] N. Wang, X. Gao, D. Tao, H. Yang, and X. Li, "Facial feature point detection: A comprehensive survey," Neurocomputing, vol. 275, pp. 50-65, 2018.
[7] S. Masood, A. Rai, A. Aggarwal, M. N. Doja, and M. Ahmad, "Detecting distraction of drivers using convolutional neural network," Pattern Recognition Letters, 2018.
[8] D. Tran, H. M. Do, W. Sheng, H. Bai, and G. Chowdhary, "Real-time detection of distracted driving based on deep learning," IET Intelligent Transport Systems, vol. 12, no. 10, pp. 1210-1219, 2018.