A study of airborne wear particles generated from organic railway
brake pads and brake discs
Saeed Abbasi¹, Jens Wahlström¹, Lars Olander², Christina Larsson³, Ulf Olofsson¹, Ulf Sellgren¹ 1-KTH Machine Design, SE 10044, Stockholm, Sweden
2-KTH Building Service Engineering, SE 10044, Stockholm, Sweden 3-Bombardier Transportation Sweden AB, SE-721 73 Västerås, Sweden
Corresponding authors’ email: sabbasi@md.kth.se
Abstract: Brake pads on wheel-mounted disc brakes are often used in rail transport due to their good thermal properties and robustness. During braking, both the disc and the pads are worn. This wear process generates particles that may become airborne and thus affect human health. The long term purpose of ‘Airborne particles in Rail transport’ project is to gain knowledge on the wear mechanisms in order to find means of controlling the number and size distribution of airborne particles. In this regard, a series of full-scale field tests and laboratory tests with a pin-on-disc machine have been conducted. The morphology and the matter of particles, along with their size distribution and concentration, have been studied. The validity of results from the pin-on-disc simulation has been verified by the field test results. Results show an ultra-fine peak for particles with a diameter size around 100 nm in diameter, a dominant fine peak for particles with a size of around 350 nm in diameter, and a coarse peak with a size of 3-7 µm in diameter. Materials such as iron, copper, aluminium, chromium, cobalt, antimony, and zinc have been detected in the nano-sized particles. Key words: Railway brake pads, airborne particles, wear.
1. INTRODUCTION
The main concerns about airborne wear particles are environmental. Health effects of the inhaled nano-sized particles have been studied extensively but most studies have been focused on combustion processes [1]. Only a few studies have been carried out to investigate the emission of wear particles in rail transport.
Gustafsson recently presented a review of these works [2]. Furthermore, investigations in the Stockholm [3], London [4] and Budapest [5] underground systems have shown particle mass concentrations in the range of 300-1000 µg/m³
much higher than the upper limit for urban traffic in the EU, which is 50 µg/m³ per day [6].
The purpose of the research presented in this paper is to experimentally evaluate the number, concentration, size distribution, morphology, and element analysis of airborne wear particles from typical organic brake pads. A series of field tests and their simulations on a pin-on-disc machine using the same sliding velocity and contact pressure have been performed.
2. EXPERIMENT SET-UP
Two different set-ups were considered for the experiments. A series of full-scale field tests were performed with a Regina X54 test train. The main reason for conducting the pin-on-disc laboratory tests was to clarify the results from the field test (e.g., to be able to distinguish the airborne wear particles that originate from the brake disc from other particles in the surrounding environment). In both field and laboratory tests, typical organic brake pads (Becorit 950-1) were tested against steel brake discs. The chemical compositions of these braking components are reported in [7]. Airborne wear particles were collected on filters during testing and subsequently analysed with a scanning electron microscope (SEM) and energy-dispersive X-ray spectroscopy (EDX).
2.1. Field tests
A Regina X54 train was equipped with particle measurement instruments at two different sampling points. The field tests were conducted in normal traffic conditions on a regular Swedish inter-city track over the course of three days. The test route is shown in Figure 1. The maximum allowable operational speed of the train was 200 km/hr when both mechanical and electrical brakes were active (although the speed was reduced to 180 km/h when the electrical brake was deactivated on purpose). The train followed normal traffic operation when it was on the main track. Some tests were conducted on an industrial track, where the maximum operational speed was only 90 km/h. As that area was rather isolated from disturbance and noise, most of the data was gathered from that region. The climatic conditions of this route during test runs are reported in [7]. The compact brake caliper used was RZS, and Becorit 950-1 was used as the brake pads. The brake disc was made from steel. The train’s weight was 62,500 kg and the brake percentage was 150% during operation. The test train was equipped with measurement devices to measure
and record speed, and total electrical and mechanical brake force on each axle. The data acquisition frequency was 10 Hz. Figure 2 shows four K-type thermocouples inserted in the main brake pad. Particles generated from pad-disc contact were investigated by particle measurement devices (see Figure 3).
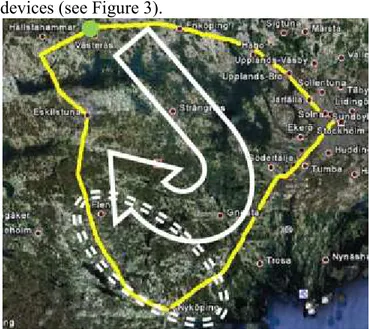
Figure 1. Field test route, with the industrial track between Nyköping and Flen highlighted.
Figure 2. Thermocouples position in brake pad.
Figure 3. Particle measurement devices, along with connecting tubes arrangement.
Two sets of DustTrak ,Grimm and P-Trak were used in two different sampling points (see Figure 3). One sampling point was located 145 mm far from the main brake pad. During braking, it was highly exposed to the particles generated by the main brake pad. We refer to this point as the brake pad sampling point. The other point was located in the middle of the axle. The effect of generated particles from concrete sleepers and ballast was more traceable in it. We refer to this point as the global sampling point.
2.2. Laboratory tests
The laboratory tests were performed using a pin-on-disc machine with a horizontal rotating disc and a dead-weight-loaded pin (Figure 4). The machine ran under stationary conditions with constant applied normal forces of up to 100 N and at constant rotational speeds of up to 3,000 rpm. A load cell was used to measure the tangential force acting on the pin. Each pin was also equipped with a K-type thermocouple inserted by drilling, and placed 1 mm from the nominal contact area between the pin and the disc.
Figure 4. Schematic of the test equipment [7]. A: Room air; B: Fan; C: Flow rate measurement; D: Filter; E: Flexible tube; F: Inlet for clean air, measurement point; G: Closed box (Chamber); H: Pin-on-disc machine; I: Pin sample along with thermocouple; J: Air outlet, measurement points; L: Dead weight; M: Rotating disc sample, N: Air inside chamber,
The pin-on-disc machine was operated in a sealed box in order to control the cleanliness of the incoming air. This setup was previously used by
Sundh [8], Olofsson [9,10] and Wahlström et al. [11] to study the airborne particles generated by simulated wheel-rail contact and passenger car brakes.
The filter used to ensure particle-free inlet air was of class H13 (according to standard EN 1822), with a certified collection efficiency of 99.95 percent at maximum penetrating particle size. The 110 mm diameter disc specimens were cut from a used piece of wheel-mounted steel brake disc from a Regina X54 train by using a water jet, while the 10 mm diameter pins were sawn out mechanically from a Becorit brake pad. Before testing, the disc specimens were cleaned ultrasonically for 20 min with both heptane and methanol. The test conditions are presented in Table 1.
Table 1. Contact conditions in the laboratory tests
No. Load(N) Sliding Velocity(m/s)
Time(min)
1 60 12.4 20
2 40 12.4 20
3 20 12.4 20
2.3 PARTICLE MEASUREMENT DEVICES
In this study, four different types of particle measurement instrument were used. The main instrument was a Grimm 1.109 aerosol spectrometer. The second device was a PTRAK particle counter. The PTRAK was a condensation nuclei counter that measured the number concentration of airborne particles between 0.02 and 1 µm in diameter. The third instrument was a scanning mobility particle sizer (SMPS) which used only on laboratory tests. The SMPS combined an electrostatic classifier (TSI 3071) with a particle counter (TSI CPC 3010). The fourth instrument was a DustTrak counter, which reported the mass concentration in mg/m³. It was used to measure particles between 0.1 and 10 µm.
The technical specification and set-up of all of the measuring devices were akin to those in previous studies by Olofsson et al. [8,9]
3. RESULTS
Figures 5, 6 and 7 show field test results based on applying different brake conditions. Different brake levels and deactivating electrical brakes on purpose were the main concern of these series of field tests. All of these results were registered by running the test train on the aforementioned industrial track (Figure 1) at an operational speed of 70 km/h. Every six seconds, the total number of particles was recorded by the Grimm spectrometer and the concentration was recorded by DustTrak. In all of these graphs, the magnitude of train speed, brake force, brake pad temperature and particle concentration have been illustrated as a normalised value in the vertical axis. The maximum values of these factors in the illustrated time interval have been presented using the number 1, and other values are scaled proportionally.
Figure 5. Effects of the different brake levels on the concentration and total number of the recorded particles, brake pad temperature and train speed reduction in normal traffic (local sampling point). The train speed was 70 km/h and the electrical brake was deactivated on purpose.
Figure 6. Effects of the different brake levels on the concentration and total number of the recorded particles, brake pad temperature and train speed reduction in normal traffic (global sampling point). The train speed was 70 km/h and the electrical brake was deactivated on purpose.
Figure 7. Effects of the different brake levels on the concentration and total number of the recorded particle
An elements analysis by EDX from a piece of the new brake pad is depicted in Figure 8. Figures 9 and 10 present the SEM images for typical particles. A typical result by SMPS from a pin-on-disc test is shown in Figure 11. Figures 12 and 13 show particle size distribution based on Grimm measurement results. In Figures 13, 14, 15 and 16 the pin-on-disc machine had been used to simulate braking force. Loads 60 N, 40 N and 20 N reproduced brake levels 7, 5 and 3, and a sliding velocity of 12.4 m/s in pin-on-disc simulated a speed of 70 km/h in a train, according to disc size and wheel and brake radius in a train. One repetition was conducted for each test condition during pin-on-disc simulation. The particle volume distributions in Figure 15 were based on an assumption of a spherical shape for the particles.
Figure 7. Effects of the different brake levels on the concentration and total number of the recorded particles, brake pad temperature and train speed in normal traffic (local sampling point). The train speed was 70 km/h and the electrical brake was activated.
Figure 8. A typical spectroscopy result from a part of Becorit brake pad by EDX.
Figure 9. A typical image by SEM from particle that was collected during the field tests in the local sampling point filter.
Figure 10. A typical image by SEM from a particle that was collected during pin-on-disc simulation.
Figure 11. A typical size distribution for particles sized less than 520 nm in diameter by SMPS ( Load: 60 N , Sliding velocity: 12.4 m/s).
Figure 12. Particle size distribution in different brake levels when the electrical brake was deactivated on purpose. Results were recorded by Grimm ( local sampling point).
Figure 13. A comparison between particle size
distribution in field test sampling points and pin-on-disc simulation (results were recorded by Grimm).
Figure 14. The total average number of particles when different loads were applied in 2 repetitions (the grey and black column ) during pin-on-disc simulation. Results were recorded by Grimm. (Sliding velocity: 12.4 m/s, Time: 20 minutes.)
Figure 15. A comparison between volume distribution in field tests and pin-on-disc simulations every three minutes. Results were recorded by Grimm (Load: 60 N, Sliding velocity: 12.4 m/s).
Figure 16. A typical running-in effect on the size distribution of particles in pin-on-disc simulations every three minutes. Results were recorded by Grimm. (Load: 60 N, Sliding velocity: 12.4 m/s).
4. DISCUSSION
In any unlubricated contact, the loss of material is associated with frictional heat, vibration, wear debris, and tribochemical reactions in the contacting surfaces. Actually, these factors have the potential to interact each other and even influence the wear process [13]. A fraction of the wear debris can be transformed into the airborne particles . Figure 17 shows a schematic view of a mechanism which lead to the generation of airborne particles in wear processes. Concerning these factors and providing a model to predict the particle formation is a long-term objective of the current project which needs further studies.
As depicted in Figures 5 and 13, both field tests and laboratory tests confirm that wear rate and
particle generation increases with increasing braking force. This result is in line with previous studies by Olofsson et al. [9,10]. Figures 5 and 6 illustrate particle generation and concentration during mechanical braking. Effects of different mechanical brake levels are evident in Figure 5. As only one sampling point was located near the brake pad, and the fact that the apparent contact area was only a portion of the nominal brake pad contact surface and also moved in the nominal contact area during braking, the discrepancies were small. In contrast, the global point (Figure 6) shows no considerable changes between the total amount of the detected particles and their concentration during the application of different mechanical brake levels. Re-suspension and dilution were believed to be the main reasons for this phenomenon.
Figure 7 presents a comparison between different brake levels when both mechanical and electrical brakes were used simultaneously. For the first four levels, there was no particle generation and the brake force applied by the electrical system was sufficient to stop the train. However, in levels 5, 6 and 7, the mechanical forces were added to the total brake system in order to satisfy the requested deceleration rate. Although the driver dictated the magnitude of the deceleration rate manually by using different brake levels, the train computer struck a balance among electrical brake force, mechanical brake force, and the speed and weight of the train. This process caused only slight differences in the magnitudes of the applied mechanical brake forces for levels 6 and 7. Obviously, applying mechanical brake forces caused particle generation at these levels. As four brake pads were mounted on each train axle, we assumed the total amount of the brake force in each brake pad was one quarter of the total recorded applied brake force on that axle.
Figures 9 and 10 illustrate a typical particle from the field test and the laboratory test. Besides their similarity in appearance, iron and copper were the main elements in both particles. The element analysis results of brake pads, in particles and in bulk (Figure 8), detected metals such as: iron,
Figure 17. A schematic illustration of mechanisms which lead to generation of the airborne particles in the unlubricated contacts wear processes.
copper, cobalt, chromium, molybdenum, aluminum, antimony and zinc, which is in line with results in [2, 12].
A typical result of SMPS is shown in Figure 11. According to the tri-modal distribution, a peak occurred near the ultra-fine region around 100 nm in diameter, and two other peaks occurred around 280 and 350 nm in diameter in the fine particle region. These two peaks in the fine particle region were also detected by Grimm (Figures 12 and 16), although SMPS and Grimm used different principles in measuring particles. It is also noteworthy to mention the indecency of the particle size distributions at different brake levels, as shown in Figure 12.
Figure 13 presents a typical comparison between size distribution of two sampling points during both the field test and laboratory simulation. Although the coincident of their peaks are acceptable, there are some discrepancies between their frequencies. This can be explained by particle characteristics. Airborne particles are a mixture of liquid droplets or solid particles in the air. As the laboratory conditions were set up to provide air flow without any solid particles or droplets, these discrepancies are reasonable. Besides, according to Hind [14], sub-micron-sized particles are susceptible to size enlargement due to a high magnitude of surface-to-volume ratio and van der Waals forces. During field tests, the probability of size enlargement was higher than in laboratory conditions due to drawing in unfiltered air and using longer tubes. Two peaks in the fine region, of around 350 nm and 600 nm in diameter, have been illuminated in Figures 15 and 16. These observations are in agreement with Wahlström’s work [11], although his studies focused on automobile brake pads.
Typical volume distributions from a field test and a pin-on-disc test are presented in Figure 15. All results confirm that coarse particles with sizes of 3-7 µm in diameter are generated during the application of similar braking force.
Figures 15 and 16 show typical particle size and volume distributions over time. The size
distribution started from a tri-modal distribution and ended with a bimodal distribution. This time-dependency may be explained by a mild-severe transition and the brake pad material stabilisation process during operation. This process was treated in the field test by first running the train on the test tracks and applying the brakes before starting the field tests. As these changes can affect laboratory simulations, the average values of these data have been used in Figures 13 and 14.
5. CONCLUSION
The following general conclusions can be made based on an analysis of the test results:
1. The pin-on-disc test is a robust method for studying airborne particle generation, based on the similarity of morphology and size distributions, with the prerequisite that the same contact conditions are used in the laboratory tests as in the field tests.
2. Deactivating electrical brakes or applying higher levels of mechanical brakes increase particle generation from brake pads.
3. Three particle size regimes were identified: a. In the ultra-fine particle region, a peak of
around 100 nm in diameter,
b. In the fine particle region, three peaks of 280 nm, 350 nm and 600 nm in diameter, with the 350 nm peak dominating.
c. In the coarse particle region, a peak of around 3-6 µm in diameter.
6. ACKNOWLEDGMENT
This work formed a part of the activities of the Railway Group of the Royal Institute of Technology. The author acknowledges the valuable assistance from Dr Wobushet Sahle of the Royal Institute of Technology, and Dr Anders Jansson from Stockholm University.
7. REFERENCES
[1] A. Madl, K. Pinkerton, Health effects of inhaled engineered and incidental nanoparticles, Critical Reviews in Toxicology, 2009, Vol. 39, No. 8, 629-658
[2] M. Gustafsson, Airborne particles from the wheel–rail contact. In: R. Lewis, and U.
Olofsson, (eds.), Wheel–Rail Interface
Handbook, pp. 550–575. CRC Press; 2009.
[3] C. Johansson, P. Johansson, Particulate matter in the underground of Stockholm
Atmospheric Environment, 2003, Vol.37
[4] A. Seaton, J. Cherrie,M. Dennekamp, K.
Donaldson, J. Hurley, C Tran. The
London underground: Dust and Hazard to health. Occup Environ Med 2005; 62(6),
355-362
[5] I. Salma, T. Weidinger, and W.
Maenhaut, Time-resolved mass concentration, composition and sources of aerosol particles in a metropolitan underground railway station, Atmospheric
Environment 2007, Vol 41
[6] European Commission (EC), Air quality
stds. 2008-07-01
[7] S. Abbasi, U. Olofsson, L. Olander, C. Larsson, U. Sellgren, and A. Jansson.
A field test study of airborne wear particles From a running train. J. Rail Rapid transit.,
2011, In press
[8] J. Sundh, U. Olofsson, Wear testing in relation to airborne particles generated in a wheel-rail contact, Lubr. Sci., 2009, 135-150 [9] U. Olofsson, L. Olander, A. Jansson, Towards a model for the number of particles generated from a sliding contact, Wear,
2009, Volume 267, Issue 12, 2252-2256
[10] U. Olofsson, L. Olander, On the identification of wear modes and transition
using airborne wear particles generated from sliding steel-on-steel contact, 2006
[11] J. Wahlström, A. Söderberg, L. Olander,
L. Olofsson L and A Jansson, Airborne
wear particles from passenger car disc brakes, Engineering Tribology, 2010,
Vol:224, 179-188
[12] E. Fridell, M. Ferm, A. Björk, and A.
Ekberg, On-board measurement of particulate matter emissions from a passenger train.J. Rail Rapid Transit., 2010, In press
[13] I. Hutching, Tribology: Friction and Wear
of Engineering Materials, CRC Press 1992
[14] WC,Hinds, Aerosol Technology: Properties,
Behavior, and Measurement of Airborne Particles, 2nd ed., Wiley, NY, 1999.