l--1) \
I
I-{I
~Co(o
AUD-.
\Co\
A
rrq
A
f2-C.J~
iv
E_
State
Board
gf
Agriculture
a
AUG 1
b
1979
____________ Meeting
Fort Lewis College
University of Southern
Colorado
Colorado State University
LIBRARIES
AUG 1 3
1Q7'.J
Report of the Secretary
to the
State Board of Agriculture
and
General Board Business
·i·
REPORT OF THE SECRETARY COMMITTEE REPORTS
GENERAL BUSINESS TO THE
STATE BOARD OF AGRICULTURE
AUGUST 16, 1979 FORT COLLINS
I N D E X
PAGE
~pproval of the Minutes of the July 18,19,20, 1979 Meeting 1-1
Dates and Locations for Future Meetings 2-1 Approval Executive Committee Action - Award Construction 3-1
Contract Engineering Arcade
Secretary's Report
Committees and General Business SBA MEETING 8/16/79
MATTERS FOR ACTION:
Approval of the minutes of the July 18, 19, 20, 1979 meeting of the board, as reported by the Executive Director
RECOMMENDED ACTION:
MOVED, that the Board approve the Minutes of the Executive Director, the Committees and General Business of the Board, SBA System, Fort Lewis College, Colorado State University, the University of
Southern Colorado, Pueblo Vocational Community College and the Treasurer in the form in which they were mailed to the board. EXPLANATION:
Secretary's Report
C9Illroittees and General Busines.s
SB~ MEETING 8/16/79
MATTERS FOR ACTION:
2-1
Dates and Locations for Future Meetings RECOMMENDED ACTION:
Information only
EXPLANATION:
The following meetings have been set for the State Board of Agriculture: September 20 October 18 November 15 December 12 Pueblo Denver Durango Fort Collins USC, PVCC, FLC Business CSU Business USC, PVCC, FLC Business All Institutions - Statutory
Secretary's Report
Committees and Gene~al Business
SBA MEETING 8/16/79
MATTERS FOR ACTION:
3-1
Ratification of Executive Committee action approving the award of a construction contract for Removal of Architectural Barriers on the Engineering Arcade.
RECOMMENDATION:
MOVED, the board ratify Executive Committee action August 2 to approve the award of a construction contract to Reid Burton Construction Co., Inc. in the amount of $486,000 for removal of architectural barriers on the Engineering Arcade.
EXPLANATION:
Demolition work while school is not in session is imperative with Executive Committee action,work could start August 6. The
total project reflects 12.5% to minority contractors in accordance with the goals established pursuant to the Governor's Executive order.
Secretary's Report
Committees and General Business
SBA MEETING 8/16/79
Office of Facil ities Construction and Utilization
August 2, 1979
Mr. A.
J.
Cummings
State Buildings Division
Office of State Planning
and Budgeting
State Services Building
1525 Sherman Street
Denver, Colorado 80203
Dear Mr. Cummings
3-1
cfu
Colorado State University Fort Collins, Colorado
80523
re: Project 2390
Removal of Architect ural
Bar r iers - Engineering
Arcade
The Executive Committee of t he State Board of Agricult ure
approved t he award of a construction contract to Reid
Burton Construction Co., Inc. in the amount of $486,000.
Attached is the completed form SP&B 41-78 regarding
mi nority business en t erprises.
Please have a Notice of Award issued as soon as possible.
We need to start work on August 6 in order to accompli s h
demolition work while school is not in session.
If you have any questions, please advise.
RFC/ble
Encl
xc : L. V. Baldwin
J.
R. Hehn
A.
T. Petrone
J.
R. Raich
Ve ~~,,~
yours,
-£;_:_,,/./_d!J!v
/ c tLR . F . Conard
Directo r
Secretary's Report
Committees and General Business SBA MEETING 8/16/79
MATTERS FOR ACTION: Pending Litigation RECOMMENDED ACTION:
4-1
No Action Required - Report Only
EXPLANATION:
Secretary's Report 4-l(a) CQillil}:j.,ttees and General Business.
SBA MEETING 8/16/79
REPORT TO THE STATE BOARD OF AGRICULTURE
ON PENDING LITIGATION
A. Litigation Pending in Federal Court.
1. Mary Alice Hill v. Colorado State University, et al.
2. Keith R. Grebe v. the State Board of Agriculture, et al.
B. Litigation Pending in State Court.
1. The Painter Estate
2. Colette v. the State Board of Agriculture, et al.
3. Alvin Miller v. the State Board of Agriculture
C. Cases in which Counsel for the State's Insurer Is Representing the
Board.
1. Tompkins v. the State Board of Agriculture
2. James A. Nelson v. the State Board of Agriculture
3. Tracey Mumey and Vernon Porter v. Colorado State University
4. Beth Margaret Kubly v. the State Board of Agriculture
·}
CAR RY IN
ADDITIONAL AGENDA - SECRETARY'S REPORT Augus t 16, 1979
I N D E X
PAGE UCS Pre sidential Job Announcement and the Creation of a Presidential 5-1
Sear ch Advisory Corrnnittee
Appointment of Joseph Goldharrnner to the Staff of the State Board of Agriculture
Membership in the Association of Governing Board of Universities and Colleges
Governor's Higher Educa tion Budget Workshop
Governor Lamm's Executive Order to Reduce Motor Fuel Consumption in State-Owned and Oper ated Vehicles
USC Terminal (Comput er) Connection with Dartmouth College Minority Enrollment Within Colorado Postsecondary Education Letter to Attorney General J . D. MacFarlane re Footnote 85c
in the Long Appropriations Bill
1979-80 Budget for the State Board of Agriculture
Calendar for Ac t ivities of the State Bo<>rd of Agriculture
6-1 7-1 8-1 9-1 10-1 11-1 12-1 13-1 14-1
~ccretnry's Report
Committees and Gener;:il Business
BA Meeting 8/16/79
MATTERS FOR ACTION:
5-1
..
USC Presidential Job Announcement and the creation of a Presidential Search Advisory Committee.
RECOM1·1ENDED ACTION:
Moved, that the Board adopt (with modificatioas ) the recom-mendation of the USC Committee -- re the USC Presidential Job Announcement and the creation of a Presider..t ial Search Advisory Committee .
EXPLANATION:
See attached job announcement ar,d ·process and procedures for selecting a President.
I
5-l(a)
PJ<J~SIDF:N'l'
UNIVEl~SJ'l'Y Of.' SOll'l'llr:i:t~ COLORJ\DO
PUEnLO, COLOHJ\DO
l\cting under the aulhorily of Lhe governjn9 board, the Presidel\t j s the Chi f Execulivc Officer of the Univer~;iLy of
• oulhern Colorado who js re~; ponsible for Lhe general administrr1tion
of all aspccls of the inslructional , research and oulrcach programs of the .inslilution.
The University is located in the induslria l city of
Pu l·lo, a community of approxjmately 100,000 persons in South-Central Coluxado , 120 miles south of Denver. Fishing, boatjng and ~ater
skiing are only minutes a1·.'ay, wj th excclJ en t skiing within two ho urs. The University has a student enrollment of approximately 4 , 500 . It offers a wide range of programs in both applied science and traditional academic discjplines with Bachelor of Arts ,
Bachelor of Schience and a limited number of Master of Arts degrees . 'l'li e new rol e and mission directs a polytechnic thrust for the inst.itutjon Lhrough the emphasis of various four year technology, health and business degree programs and development of selected masters programs, while simultaneously maintaining a strong liberal arts curriculum .
The Search Committee will look exped.ally for proven l eadership and accomplishment at a high executive level; an orientation toward public service ; qualities pointing to the
ability to stimulate a vigorous intell ctual and cultural community among faculty, students and staff a t the University , and importantly , the ability to communicate effectively with external decision makers .
A complete job description and qualifications will be sent upon request.
Dl\TE DUTIES ImC;JN :
Ju ly 1, 1 980 , or earlier , subject to th e avai l abil i ty of person selected.
CLOSING Dl\TE FOR APPLICl\'l'JONS :
Nov ember 1, 1979 A!l appl ications should in lcude a r esume , SEND NOMINA'l'IONS OR l\PPLICJ\TIONS TO :
Edmond Noel , Jr .
President , Governing Board Un iversity of Southern Colorado Pueblo , Colorado 81001
1\S AN l\FF IRMJ\'l'IVE JI CT ION l\J\JD EOUJ\L OP PO RT UN J'l'Y EMPLOY CR , 'I'llE UN IVERS I'l'Y
OF SOU'l'llCRN COLOHJ\DO CO lPLIES \VI'l'll l\LL FEDCRJ\L Ll\\'IS, EXCCU'l'IVE ORDI::HS l\ND S'l'l\'l'E HEGULJ\TIONS PEH'l'l\lNJ! G 'l'l!ERE'l'O l\ND DOES NOT DJSCRJMJN/\'l'E ON 'l'!IE BASIS OF MEN'l'/\L OR PIIYSICJ\L lll\NDICJ\P , Hl\CC , COLOR , RELIGION , Nl\'l'JONJ\L ORIGIN , l\GC OH SEX
To be run as display ads in Chronjcle of Hiqhcr ~ducn ion , N. Y, Times
(Sunday Cdition) , Wall SLrcet J ,u 1n.1l , Los l\nqcles Tjmcs , l\)buqucrguc J riuriwl , Denver Post , Forbes M<t<pzinc lJl'q jnn i lHf Seplcmbcr 21 1 979 a nu contimd ng ever y Sunday Lh ro ugli Or.I nh1'r 20 , 1979
I
5-l (b)
suct:i:s'J'l . .:D Ml\KI:-uP
PRESJ DEN'l'J l\L SEl\HC!I l\DVISOl{Y COMMITTEE (P -Sl\C )
~ faculty elc'clcd by the fDculty of use only no
l ater Lh an Septembe r 12, 1979
2 students desjqnateu by Llic l'r esjcle nt of Student Dody no Jil ter LJ1 ;m Sl!plC'mbcr J3 , 1979
( this couJd l>l! h <:indle<1 by notices in stud e nt pack ' LS at rc'g isLraUon. l\pplicc1tj_on Lo the new Student Sena te conv e ned by outgoing Student Body President and elected by the Senate)
1 classified staff nppointed by President Love no
lat er tha n 'cptember 12 , 1979 .
1 alumni association member appointed by the President
of the l\lumni Association no later than September 1 2 , 1979 .
2 adminjstrative staff desiqnated by Presjd en t Love no la ter tha n September 14 , 1979.
Ex Officio Non Voting
1 member of the use committee (Farley ) Aff irmative Action Officer from USC Torn Muhic as resource person
5-l(c:)
·fit:-/
)7tJTIJtfS"l"~iJ
BOt:.Sf_p : . Po:;H.ior
~~·. ~:::.;:::. ._;::-.;:.::;_· '~~~~ ... :.:~.,"-~~~:l;::-;
{
1 I !l
l
I
~
·1l
AssistJi:i to the Pre !dent
ancl
L
·rector of
th r.
ornce
of
Affirmzlive Action
llle Univcrs11y of M1chrg~n. /Inn Arbor
Cam-pus. is seckinq a person to direct rts equal opportunity eflt•1ts. l_h~ position reports
d1-r~_tl~l!.'.Zr~
our
ur=iu111orJs:
A M as t e r"~ or profession;il degree , or
equivalc11t com bination of education and experience is required.
"" Dcmonst rilted interest and commitment to equal opportun ity principles are required. Demonstrated leadership in advancing these principles is desirat1le.
II>- Oe mon~trotcd ability to maintain
construc-tive intcrr.crsonal relationships as welf as ability in oral and written . communications are required.
I>- Sensitivity to the needs/procedures of a major r c~:rarcl! university plus administra-tive cor:i;;ctc11 cy v1itl;in hirihe r education at an indrpr!ndent leadersll ip level are necessary.
~ Knowledge of and experi ence with applica-ble Federal and State laws are desiraapplica-ble.
RESPO r. S!BI LIT! ES:
~ Advise and assist the President and other executive officers on m;ittcrs relating to equal op[lor1u111ty, affirmative action and non-discrimination.
i.- Administer the Office of Affir mative Ac
tion and direct the implementation of policies and proqrams and monitor the University's comol1ance with the applicable laws and rcnulalions .
~ Serve as liai"son between the University and governmental agencies.
II- Perform other duties as assigned by th e Pr esident.
Salary will be competitive and appropriate with one's q11Jhficat1ons and year s of
experi-1
cnce. Submit resumes by September 15, 1979 to:
~
~
'.
v-::~;.):r"':'-.~ u;m~:n
(If
r\
7.!c!'i~
_ 'J IAr. Henry Johnson. Chairman
l Scarrh Comm11fcc &
t\
Vice !'rc'ldcnt for Student Services 3010 M1ch1qJn Union
Ann Arbor. M1ch1oan 48109
A non·discomlnatory, arr.rmJilve ~C11on employer
~-.. - · ... - ... -,•·r·~~-···p:;w~-.,.. "'.'-"'"" ..-~,..,... ,._
Secretnry's Report 6-1
Con~ltlees and Gen rAl Business
SBA Meeting 8/16/79
MATTERS roR ACTION:
Appointment of Joseph Goldhammer to the staff of the State Board of Agriculture.
RECOMMENDED ACTION:
Moved, that the Board grant authority to the Executive Cormnittee to hire Jos ph Goldhammer as legal staff to the Board, in accordance with Colorado Revised Statutes and after consultation with Attorney General J. D. MacFarlane .
EXPLANATION :
I
Secretary's Report 7-1 Committees and Genernl lluslness
SBA Meeting 8/16/79
MATTE1S FOR ACTION:
Membership in the Association of Governing Board of Universities and Colleges .
RECOMMENDED ACTION: Board Dcd sion.
EXPLANA ... ON:
The A.G.B. serves some 19,000 trustees, regents and chi rf executives representing nearly 1,300 colleges and universities. Quote from A.G. B. Statement of Purpose: "A.G.B. exis ts to help members of
college and university boards fulfill their roles and meet their responsibilities. It presents in quick accessible form the back-ground information necessary for boards to deal intelligently with the many critical issues before them •.... As the only trustee org ization to serve all sectors of postsecondary education, it also helps boards function with an awareness of the increasing interdependence of all types of colleges and universities, public and private ."
What does membership mean? "A.G.B. offers members a wide variety of programs and services to fill the many needs of boards ."
A.G.B. Publications
A.G.B. News Notes, a monthly newsletter A.G.B. Reports, a bimonthly journal Special Publications
A.G.B. Conferences and Workshops
National Conference on Trusteeship National Trustees Workshop
Special Seminars
pportunities for Board Performance Analysis Gui d lines and Criteria for Self-Study Board Mentor Service , an on-campus workshop
I
Secretary's Report 7-2 Committ es and Gen ral Business
SHA Mee ting 8/l G/79
Opportunities for Specialized Information A.G . B. Tru stee Information Clearinghouse A.G . n . Lend ing Library
Government Relations Service Special Research Projects Membership Dues
FTE Enr ollment 24,000 and over - - $1,150
I
I
I
Secrelary's R porl 8-1 Committe< ~; and Gener<Jl Business
SBA Meeting 8/16/79
MATTEPS FOR ACTION:
Governor's Higher Educat ion Budget Workshop.
RECOMMENDED ACTION:
Boa rd discretion.
EXPLANATION:
Remarks of Dr. John Fuhr before the Governor's Higher Education Budget Workshop and verbal reports by members on the Workshop.
I
Pr sentation of Dr . John 1'uhr befo re the Gov e1nor ' s Higher Education Budget Workshop Ju ly 26, 1979
8-l(a)
With i n th e tim e allocated, I will at tempt to limi t my r emarks to three areas: the cha l l enge confronting governing boards in submitting r ealjs tic budgets in light of poljtical reality; concerns about particular circum-stances and expecta tions I beli eve we will encount er in the 1980's; a nd recommend ations which will permit Higher Educotion the flexibility to meet changing needs in a period of r estricted resources.
I accept the challenge tha t we in the High er Education community must demonstrate the ability to change , to appraise itself , to improve, and to set an enviable pace for innova tions in Higher Education. However, our goals, and yours as elected officials, must be to ensure that Higher Edu-cation will be strong and dynamic in the years ahead , les t we forget the significant role of service Higher Education has provided to the people of Colorado .
Over the last thr ee decad es , our institutions have been s ensitive to the needs of the people and responsive to its probl ems . For example , in the years following World War II, we demonstrated a remarkable ability to meet the challenge of our exploding student population ; the scientific and technological thrusts for space exploration and health science advance-ment during the 60 's; and with the 70's came the need to satisfy the
appetit e of the American labor mark t for educational talent.
However, I believe we all recognize that Higher Education now faces ano ther period of great challenge. The excellence of some of our most outstanding and interna t ionally r ecognized programs are threatened by inflation and erosion of the State and Federal support base. Because the State has
adopted a maYLmum spending limitation fo r the next several years, temporary adjustments by Higher Education are no longer feasible. The impact of infla tion and the decline of numb ers of students , has brought Higher Educa-tion to a stage where reassessment of instituEduca-tional priority is mandatory and urgent. Our challenge , as Governing Board members, is to make adjust-ment s within the Col leges and Universities in order to generate a part of the fl exibility essential to maintain quality and initiate some new high priority academic activities and programs. However, in order to continue to play our his toric role of service, Higher Education must rega in the degree of fr ~edom ne cessary to respond to needs , new probl ems , and new
oppor tunities as they arise (more on that later ).
As I look ahead today , I am very concerned about a numb er of circumstances which I believe we will continue to encounter in the 1980's.
The rush toward judgment -- that enrollments will continue to decline beyond 1986 when moderate growth is indeed possible before the end of the next decade; the conflic t of the 7% statutory spending limitation, despite double digi t inflation and a populat ion growth of nearly 2% ; the decljn e in the credibi lity and standing of Higher Educa t ion with the General Ass embly and th eir impression that Higher Education is in a state of chaos , is cut cf control , that there i s too m11rh fRt in the institutions .
I
8-J (b)
and that faculty arc not productive enough; the lack of recognition
of the importance of a Research University to a high technological economy; the deterioration of our physical facilities, because the Sta t has not adopted a realistic deferred maintenance program; the imposition of a salary limitation -- which has already cost us some of our finest people, and which will undoubtedly inhibit our ability to recr uit and maintain quality staff; the threat that the responsi-bility for planning and postsecondary education will pass out of the hands of the Colorado Commission on Higher Education and into the hands of general State planning agencies for whom education does not constitute the fiscal priority, or directly into execulive or legislative control; that changes in governance will be th e panacea for the future ; t hat reasonable and responsible budgets will not be rewarded due to the con-tinuous staff turnover of the JBC, and the annual changes in various formulae used by the Committee; and lastly, both confusion about educa-tional purposes and the reduction in the economic value of Higher Ed ucation.
Let me now move to the area of r ecommendat ions which will hopefully permit Higher Education the degree of flexibility to maintain the quality of its programs of instruction, research and public service. First and foremost should come a commitment from our elected officials that Higher Education will be strong and dynamic in the years ahead; a commitment from the State
that it will utilize the major potential of State Universities to bring applied science to the service of State Government - - a potential that is not effectively being tapp ed ; incentives -- such as the elimination of t he horre ndous numbers of line items and footnotes - - elimination of which will permit flexibility to meet changing needs; incentives for faculty t o seek research grants by granting a portion of the indirect costs , to en-hance programs and provide for limited construction needs; a deferred
maintenance program of some $20 Million annually to protect our fine physical facilities; and continued support for the various formulae developed by the Association of State College and Universi ty Presidents; and lastly, an adjust-ment of the 7% spending limitation with something more sensitive to inflation
and population growth .
I t is obvious that over the last several years Higher Education has struggled t o maint ain the quality of its program, however, this has become inc reasingly more dif f icult and there is no reason to believe the road will be easier . Let us form a partnership in meeting the challenges ahead for neither ins t i -tu tional nor l egislative/executive goals can be met without tha t bond .
S ~cretary's Report 9-1
Committees and Gcnernl Business Sh Meeting 8/16/79
MATTERS FOR ACTION:
Governor Lamm's Executive Order to reduce motor fuel consumption in State-owned and operat ed vehicles.
RECOMMENDED ACTION:
Moved , that the Board direct each of its institutions to achieve and, if possible, to go beyond the goal established by the Executive Order, and by the same motion to request each institution to report to the Board on its compliance with the Executive Order.
EXPLANATION :
See Governor's ExecutivL Order re Reducing the Consumpt ion of Motor Fuels by State-Owned Vehicles -- and a Compilation of Id eas for Reducing Mileage published by the Off ice of Energy Conservation, Department of Administration.
I
9-l(a)
0011 79
RICHARD 0 . LAMM
Go ernor
EXE C UT IV E CHAMBERS
A¥
~3 \97G
136 State Capitol Denver
8020:1
E X E C U T I V E
0 R D E RREDUC ING THE CONSUMPTION OF MOTOR FUELS
BY STATE -OWNED VtH ICL ES
WHEREAS, the State of Color ad o is a maj or emnloye r in the State; and
839-2471
WHEREAS, the State of Colorado , in the cours e of its bu siness, consumes
millions of gallons of motor fuels annu ally ; and
i\HERE. S, the Stat e of Color ado, like the rest of the nation, is
experi-encing shortages of mo tor fuels ; and
KHEREAS, the citiz ens of the State of Colorado have b e en asked to reduce
their consumption of motor fuels by 5 percent; and
WHEREAS, the State of Colorado has a responsi bi lity to prov ide le ade
r-ship in this endeavor to reduce the consumption of motor fuels;
NOW, THEREFO RE , I, Richard
D.
Lamm, Governor of the State of Colorado,
do hereby order:
1. All State a gencies shall , take immediate steps to reduce the
numb er of miles their employe es drive in state-owned vehicles
by a minimum of
5percent .
2.
All State agencies shall take immed iate steps to reduce the
number of miles driven by its employees in private v ehicles
for official State business by
a
minimum of
5percent.
3. The use of vehicles for public safety shall be exempt from
thi s Executive Order.
4. The Office of Energy Conservation and the Department of
Administr ation shall jointly monitor the impl ementation of
this Executive Order .
5.
All department directors shall prepare a plan f or compli ance
with this Executive Orde r within two weeks of the date of this
Ord e r. Th e plan is to be submitted in duplicate to
M.Buie
Se awell, Execu t ive Director of the Off ice of Energy Conse
r-vation, and to Lee Wh ite, Executive Direc tor of the
Depart-ment of Admi iistralion, for re v iew.
9-l(b)
EXECUTIVE ORDER - page 2
Reducing the Consumption of i\lotor Fuel s
By State-Owned Vehicles
00011.79
.
6.
The implcmentat"on plans shall incl ude , but not be limited
to:
A. Baseline data on the historic use of state-owned vehicles
and of private vehicl e s, on of fic i al business, by each
de-partment . To the extent possible, this data should delinate
use on a monthly basis.
B. A description of how each department intends to comply
with this Executive Order.
C. Specific goals for the plan expressed in terms of a
per-centa ge reduct io n i n miles driven each month compared to the
same month in the previous year, for both state-ov.rned and
private vehicles us ed for official purposes .
D. A listing ·of vehicle uses proposed to be exempted from
t hi s Executive Order under Paragraph 3, and an explanation
of
11hrthose services should be exempt.
7.
All department directors shall monitor the use , by their
department, of state-owned vehicles and private vehicl es on
offica l business , and report monthly mileage figures for each
catagory to the Executive Directors of the Offic e of Energy
Co nservation and th e Department of Administration .
8.
The Office of Energy Conservation and the Department of
Administration shall compile all monitoring reports from the
var ious dep artments and report to the Governor, on the
imple-mentation of this Executive Order , each month.
THIS ORDER shall remain in effe c t unti l superseded .
GIVEN
under my hand and the
Executive Seal of the State
of Colorado, t his
/8
day
of May, A.D .,
T9.
'¢--~OJ-~
u ·1;a r 1.,111t:11 t. u I 11u111r111'...Lt(\t1 Oi l
9-l( c )
Off
icc of Energy Cons
1rv.-1t i011
·COMPIL/\TION OF
rnrns
FOi{ REDUCING MIL[J\GEPaul Morris, !3ui l din9s and Grounds Super intendent for the Un ·ivcrsity of Col rCldo
at !3oul der, has instituted a taxi sr.rv icc that resulted in the repl acement of four
trucks previously used for trans pol'tat i on by his depurtmcnt. The taxi is a 9- pu
sser.-ger van equi pped with two-way radio. The taxi normal ly hauls
80- 90
people during
t he day, \'1 ith a respon se time of
7-10
minutes. If anyone is interested in thi s
system , they can call Mr. Morris or· his ass i stant, Joe Sancl1cz , at
492-8171.
In meetings requ i r ing travel , eli minate dupli cation of peopl e from the same unit,
section or \·1ork group if it requires us ing more than one vehicle and pub.l ic t ran
s-portation is not available.
Consjder standard meeting days in Denver to enabl e the various divisio ns to hold
concurrent meet·ngs so the travel can be by departmental vans or int ra-divi sional
pool ing.
Utili zat ion of public transportation for loca l travel.
Make greater use of the te lephone and mai l system in li eu of vehicl e trips .
Rid e-sharing to common destinations, if substantia l conflicts in ti mes do not
exist.
Centralize and consolidate meetings.
Requ ire "front range " empl oyees to use public t ransit, \vhen possible, for meet ings
in Denver, Greel ey , Fort Collins, Colorado Spri ng s, Boulder or Pueblo .
Require ma intenance and const ruc t ion crews to use van pools and car pools from
field offices to construction or ma intenance si tes when schedul es permit .
Replace larg e cars with small , more fuel efficient vehi cles.
Requiri ng priority assignmen t of smal l cars for urba n work trips .
Purchase bicycles for short distan ce trips.
Arra nging van pool pick-up service for Highway employees hav ing meeting s at
head-quarters or other distr ict offices in the Denver area. Pre-arranged ti mes for
pi ck-up would be set ; therefore, Department employees would have to arrange
meet-ings conven ient with the van pool pick-up schedule.
Encourage
4- 10
hour work days for maintenance crews in the summer season . The
"off day" \<1ould be the same for all pa rticipat ing employees .
Each division wil l be requ ired to coordi nat _ trips to the same general area, to
use telephone cal ls i n li eu of travel, and to el iminate all unnecessary trips .
The number of mem bers of councils, comm ittees , etc ., for
who1~1the Depa rtment pays
9-1 (d)
A Departmen{ policy has been issued estol.Jlishing t he schedul i ng, one 1·1eek in
advance, for all trips
greate i~than 50 miles for car pool arranyernents .
Sch du li ng of all depa rtmental meeting s at the l ocation 1,i1hic h v1ill r equire the
l east amount of travel.
One Department i s dispos i ng of - and not replac i ng - the three ol des t and hi ghest
mileage velrtc l es of its present fleet of five vehicles .
Secretary's R port 10-1 Committees and General Business
SBA Meeting 8/16/79
MATTERS FOR ACTION:
USC terminal (computer) connection with Dartmouth College.
REC0}1MINDED ACTION:
None - information only.
EXPLAt~AT ION:
Report by Thomas Farley and Edmond Noel. See attached correspondence.
!< 1 E 'N 1 1
c
r , . ~r u
T A 1 1 < >Thomas T. Farley
Chairman, USC Comnittee
Univ ersity of Southern Colorado
Board of Agr i culture
650
Thatcher Building
Pueb l o, Colorado
81002
Dear Mr . Fa r ley:
10-1 (a)
f . .. , DARTMOUTH COLLEG E
Han ove r, New Hampshire 03755 Telephone (603) 646- 2&43
July
27, 1979
Thank you for the order from the Farl ey Foundation of Pueb l o, Colorado
on behalf of the University
~fSouthern Colorado . We are hopeful the Uni versity
wi 11 find the soft1·1are package useful in its computer program_ \·Je look foniard
to the connection between the two campuses beginn ing this Fal l through the
USC terminal/ at ional Telenet computer service also funded by the Farley
Foundation .
As a part of th is initial thrust USC shall have unti l Septembei-
15, 1980
the option to pick up the mult i ple termina l dedicated line/Pueblo node
communica-tion s compu t er that the Ki ew i t Computer Center at Dartmouth Col l ege offers
educational institutions . This ootion restricts Ki ewit from in stal li ng dedicated
s er v i c e by
111ea n s of a c omm u n i c a t i on s c
0111flu t e r a n d s ha
11
be ex c
1
u s i v e to U S C i n
Colorado, New Mexico, Arizona, Utah , Wyom ing and Montana for a
5
year peri od
if exercised prior to Septemher
15, 1980 .
lfo
are l oak i ng forward to th e "connection " 1.;i th USC.
?5cerely yours,
~ eel~
Eug~
Fucci
_(-Assistant Director
iecretary's Repor t
Committees and Genera] Business SHA Meeting 8/16/79
MATTERS FOR ACTION:
11-1
Minority enrollment within Colorado postsecondary education.
RECOMMENDED ACTION: Board discretion.
EXPLANATION:
The attached Highlights from a CCHE report on "Minority Enrollment within Colorado Postsecondary Education 1976-78" was presented at the April 1979 meeting of the CCHE .
Commissioners requested that copies of the initial minority enrollment data be .forwarded to the Governing Boards for review and comments . Each Board's comments are encouraged.
11- J ( •t)
DEPARTM E T OF HI GHER EDUCATION
COLORADO CO /\l\MIS0ION
0
HI GHER
EDUCf\T I O~
LE STER R. WOODWARD. Chai rm.ln /I NN LA IRD M/1N Vf:L. Vice Ch~irma n
JUDY AllM AG /\ST /\. DGAR OENTON EL MER CHEN/\ ULT-PHILLIP B. Gr,u EGOS. JR. REOECCA LOVI -KOURLIS J. TYLER M/\KE: PE: /\CE MICHAE L R. MOORE
MEMORA OUM
DENV ER, COLORl\l 0 802~ ·-....~
CC) "
Jui
y 1 6 , 1 9 7 9co{;·
"'~ ...
TO:
Governin g Board
ExecutivesZS~retaries
//,J;/
-FROM:
TELE: A REA 303 839-2723
SUBJECT:
~~~/~//
1/
Lee R.
Kersc h ne~fl-Y.>,:e' ut'i,lle~!Yi1~ector/C CHE" ~/'/ / / { '
Minori ty
~n~4\; th~
n Colorado Postseconda ry Education
{. ,•
/
The attached doc ument,
~AReport on Minority Enrol lment Withi n Colorado
Postseeondary Education
1976- 78 ,"\-Jas presented at the Ap ri l ,
1979,meeti ng
of the Col orado Commission on Higher Education . The report addresses Issue M
of the CCllE Master Pl an, in \'Jhich the Commiss ion recommends that "CCHE promote
the coll ection of reliable raci al and ethnic statistics re lating to demograph·ic
and economic changes in t he state, and that CCHE t ake a l eadership ro l e in
promoting the use of these data throughout state government i n order that
quali ty of the total data base is both improved and more usabl e for educati onal
pl anning . "
Commis sioners requested t ha t copies of t he i ni t i al minority enroll ment data
be forwarded to the governing boards for review and conments . Each board's
comnents are encouraged and will be mos t useful i f received i n my office by
Augus t
15, 1979 .In add 'ition, the Comnn ss ioners reques t ed th at a t ask force be created t o
revi ew the data withi n the report and govern i ng board comments , and make
recommendations to the CCHE for the ame
1
i orati on of enro 11 ment opportunities
for mi no rities . To this end, VJill you pl ease advi se me of a representative
from your governi ng board who might serve on such a task force as well as
one insti tutiona l representative from each insti t ut i on unde r your board's
purvi ew .
LRK/ MKH/j g
Enclosure
cc : Coll ege and Un i versity Pres i dents
11-l(b)
~ort
on
M_~_i:l..9J:~~-J~1.c_oll me ntWithin Colorado Postsecondary Enrollment
1976-1978
o Fall 1978-79 et hnic minoriti es comprised 13.5 percen t of Colorado public higher
education enrollment .
• Excl ud ing non-resident aliens for comparison of minorities in Colorado hi ghe r
educiltion to minorities within Colorado population -- the pa rticipation rate of
mi norities in statewide higher education is
n
. 5 percent compared to 18 .8
percent minority population within state -- for a ratio of .612 which is simi l ar
to the national ratio of .602.
From fall 1976 to fall 1978, the numbe r of ethnic minoriti es in Colorado higher
education grew at a faste r pace than did non-minorities. Incl uding non-resident
a 1 i ens, the minority headcount gre\i'J by 2, 220 students or ll . 9 percent -- excluding
non-resident a 1 i ens, the increase ove r the t1'10 years was 951 or 5. 8 percent.
No n-minori ty head count in comparison increa sed by 201 students or . 2 percen t .
o
The three ethnic groups
v~hichrnade the greatest gains in headcount were the
non-resident aliens , American Ind ian or Alaskan Native, and Asian or Pacific
Isl ander. From 1976 to 1978, the head count increase attributed to these three
ethnic categories was 2,036 or 91 percent of the total 2,220 minority student
headcount gai n.
s Compared to the private sector, the pub 1 i c sector ' s 1978 mi nority enro 11 men t
contained proportionately fewer non-resident ali ens and more Hispanics .
o Tv10-year
state supported institutions have an ethnic minority partici pation
rate of 17. 9 perce nt comparied to the four-year institutions ' 12.3 percent
partic i pation rate .
• Within the public sector, th e proportion of ethnic minority students cl ass ified
as graduate students i ncreased from 1976 to 1978 by 2 percent to reach a level
of 10 .1 percent of t o ta 1 minority enro 11 ment . 10 . 2 percent of non-minority
enroll ment is cl assified as graduate .
1
Additionally, in 1978 v.,iithin the public sector, ethnic minority females r ep resen t
41 .4 percent of total minority enro llment compared to 49 .l percent f emale
repre-sentation within the non-minority category . The 41
.4
pe rcent fema l e ethnic
minorities represented a 2. 3 percent increase over 1976.
t
Th e sta tus of f emu l e enro llment with in Co l orado public higher educatio n,
irrespect i ve of ethnicity, can be summarized as follows : In 1976, eight of t he
26 state-supported inst i tut ions included in the r eport reported enro ll ments of
over 50 percent f emale whi l e in 1978, 15 -- over one-half -- of the
state-supported i nstitut ions had enrollments of over 50 pe rcent f ema l e. In 1978,
49.l percent of tota l publ i c postsecondary enrollment ·was female .
11-1 ( c )
COLORADO COMMISSION ON HIGHER EDUCATION
1550
Lincoln Street , Room
210
Denver, Colorado
80203
A Report on Minority Enrollment
Withi n Colorado Postsecondary Education
1976 - 1978
Iss ue M of the CCHE master plan, A Plan and a Process for Postsecondary Educati on in
Col orado , asks: "l•lhat is the appropriate relationship for a state\.'1ide Master Plan
on Higher Education to Affirmative Action?
11Along with a statement of commitment to
affirmative action within Issue M, the Commission mad e a recommendati on that the
"CCHE promote the collection of r eliable racial and ethnic statistics relating to
demographic and economic change in the state , and that CCHE take a leadership role
in promoting the use of these data throughout state government in order that quality
of the total data base is both improved and more usable for educational pl anning .
11It is to Iss ue Mand the above-mentioned recommendation that this report speaks.
Thi s past fall publ ic and private postsecondary institutions \.'li thin Colorado, and
the nation, completed a Nat ional Center for Educational Statistics Higher Educatio n
General Information Survey (HEGIS) form entitled "Fall Enrollment and Compliance
Report of Institutions of Higher Education ,
1978.
11Using copies of the i ndividua l
i nstitutions
1responses to that survey, and comparing the data to data from the same
report required in
1976
(the report i s req uired in even -numbered years ), staff has
prepared the follow ing analysis of minority enroll ment withi n Colorado institutions
of hi gher education .
Four institutio ns -- one public and three private -- did not submit compli ance data
for f all of
1976 .
The total enroll ment as wel l as minority enrollment data for
1976
and
1978
for these i nst itutio ns has been excluded from th i s report . The
insti-t uinsti-tions are : Norinsti-theasinsti-tern Junio r College, Roc kmoninsti-t College, Jazarene Bibl e College,
and Intermountain Bible College .
During the fall term of
1978-79 , 20 ,855
minority students were enrolled wi th in
Colo rado higher education. Non-resident ali ens, numbering
3,541
of the total figure,
are i ncluded because they are , for purposes of t he federal survey, identi fied as one
of the six reporting categories .
To date, information has not bee n collected by the National Center for Education
Stati stics on the number and types of handicapped students within hi gher education.
Staff acknowl edges the lac k of data for this group and will support efforts for
such data coll ection in the future .
In fall
1978-79,
known ethnic minori ties as a percent of total enrollment comprised
13. 5
percent of the public sector and
11 .9
percent of the private sectJr. Removing
the non-res i dent alien catego ry, t hereby enabling a compariso n to the population of
the state , t he participation rates for minoriti es are adjusted to
11
.8 percent in
the publ ic sector compared to
8.9
percent in the pri vate sector, and
11
.5 percent
for the state as a whole .
The Colorado Department of Loca l Affa irs, in March of
1979,
issued population estimates
of ethnicity as of July
1, 1978 .
Those revis ed figu res indicate that minorities are
esti ma ted to comprise
18.8
percent of the total state population. Th e
18.8
percent
figu re repres ents a
1.6 percent gain in the minority population during the
11-l (d)
The 18.8 percent minor ity popul ation estimated July l, 1978 , along vJith the
break-down at the ti me of the l as t census in 1970 i s as follows:
Colorado
Minority Population as a Percent of State Population
Actual
Estimate
Ethnic Ca tegor_l'.
Aeri 1 1 ' 1970, Census
Jul y l, 1978
American Indian
.40
.47
Asi an American
.89
.93
Blac k American
3.
013.78
Span ish American
12. 97
13. 67
TOTAL
17 . 27
%18. 85
%The overall participation rate of mino rity students i n Colorado hi gher education is
lower than the overall minority representation in the state's population (11 . 5
pe~cen tcompared to 18.8 percent). The ratio of mi nority population in Colorado hi gher
educa-tion to mi nority popul aeduca-tion within the general popu lat ion in Colorado is .612 and is
essentially the same ratio as that of the nation .
The American Co unc il of Education ' s February 16 , 1979, issue of "Hi gher Education
and National Affa irs" announced a Ford Foundatio n project designed, in part, to study
the current status of minorities in highe r education . The Foundation stated tha t
"altho ugh there is considerable question as to the reli ability of the figure, the
four minority groups are said to account for about 9.7 percen t of higher education
enroll ment . .. . and 16 . l percent of the U.S. population . . .. " Thus, Colorado's ratio
of .61 2 (ll.5/1 8.8) is slightly hi gher but comparable to .602 for the U.S. (9. 7/16 .1).
The number of ethnic minorities in Colorado hi gher education is growing at a faster
pace than is the category of non-minority students . In reviewing and comparing the
1976 postsecondary data coll ected by the fe deral government to the 1978 data dis
-played in Table I, the number of minorities enrol l ed (again excludi ng non - resident
ali ens) i ncreased 5.8 percent compared to a total non-minor ity headcount increase for
Colorado postsecondary education durin g the same period of .2 percent (133,249 in
1976 to 133,450 in 1978) .
The years compared for the minority student analysis study are 1976 and 1978 -- years
in which the federal gove rnment required fall enroll ment data by student et hnic
category (reports required even-numbered years) . While it is true t hat opening fa ll
enroll ment from fa ll 1977 to fall 1978 dec lined 1. 2 percent statewide, the final
fall enrollment fi gures reflected in the compli ance reports (source documents for
the minority enrollment period ) of 1976 and 1978 represent a 1 .6 percent gain over
a two-year period.
Total minorities enrolled in 1978 represented an 11 .9 percent gain over the known
number enro lled in 1976 (non-resi dent al i ens included ) . Colorado higher educati on
enroll me ntlincreased by 1.6 percent or 2,421 students (1 51 ,884 to 154,305) during
this same period. The 2,220 additional known mi noriti es repre sent near ly all
(91.7 percent) of the hi gher education en roll ment ga i n. The total increase in the
number of mi no ri ties enroll ed , while impressive, can be more meaningful if anal yzed
to refl ect gr01-1th of minority groups by sector, by type of institution , and by ethnic
ca tegory.
1
Excl udes enroll ments at Northeastern Jun ior College, Rockmont Coll ege, Nazarene
and Interrnountain Bi bl e Coll eges .
11-1 ( c )
TABLE I
Enro
11ment Changes in 1,li nori
t_y
Headcount
in Colorado Postsecondary Education
Fall
1976 -
Fall
1978
COLORADO HIGHER EDUCATION
ENROLL~ENTFa 11
Fall
1976
1978
Total Enro
11
ment - A
11
Races
151,884
154, 305
Known Minori ties :
Non-Resi dent Alien
2,272
3,541
Black Ion-Hispanic
4,750
4,879
American Indian or Alaskan
Native
988
1,315
Asi an or Pacific Isl ander
1,597
2,037
Hi soanic
9,028
9,083
Sub-Total
18,635
20,855
Less Non-Resident Ali ens
16, 363
17,314
PUBL IC
SECTOR
Fall
Fall
1976
1978
Total Enroll ment - Al l Races
133,869
136 ,280
Known Minorities :
Ion-Resi dent Al i en
2,096
2,943
Blac k Non -Hispanic
4,307
4,271
American Indian or Alas kan
Native
911
1,181
Asi an or Pacific Isl ander
1,394
1,745
His panic
8, 574
8,569
Sub-Total
17 ,282
18,709
Less Non -Resident Aliens
15, 186
15,766
PRIVATE SECTOR.
Fall
Fall
1976
1978
Total Enroll ment - Al l Races
18,015
13,025
Known Minorities :
Non-Resident Alien
176
598
Bl ack Non -Hispanic
443
608
American Indian or Alaska n
r·Jative
77
134
Asi an or Pac ifi c Isl and er
203
292
Hi span ic
454
:Jl4 ,.. , "Sub-Total
I
1,353
2, 146
Less
~Io n- R esidentAli ens
1, 177
1 ' 5£18
Percent
of Chanae
+1. 6
+55. 9
+ 2.7
+33 .1
+27. 5
+ 0. 6
+11. 9
+ 5 .8
Percent
of Chanae
+ 1. 8
+40. 4
- 0.8
+29 .6
+25.2
- 0. 1
+ 8.3
+ 3. 8
Percent
of Chanqe
+ 0. 1
+239.8
+ 37 . 2
+ 74.0
+ 43. 3
+ 13 .. 2
+ 58.6
T31. 5
11-1 (f)
Growth of Minority Groucs by Sector
An analysis by ethn ic group is presented in Table II to reflect the portion of the
minority headcount each of the five NCES- identifi ed categories (the sixth is white
non-Hispanic) represents.
TABLE II
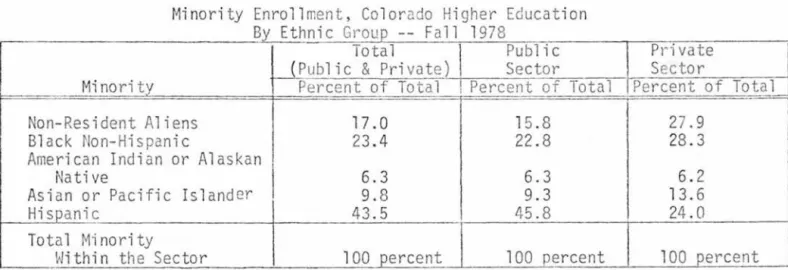
Minority Enrollment, Colorado Higher Education
iy t
n1c roup -- a
B E h . G
F 11 1978
Total
l
Publi c
Private
(Public
&
Private)
Sector
Sector
Minori ty
Percent of Total
!
Percent of Total Percent of Total
Non-Resident Aliens
17.0
15. 8
27.9
Black Non-Hispanic
23 .4
22.8
28.3
American Indian or Alaskan
Native
6.3
6.3
6.2
Asian or Pacific Island er
9.8
9.3
13. 6
Hispanic
43.5
45.8
24.0
Total Minority
Withi n the Sector
100 percent
100 percent
100 percent
The three ethnic groups compri sing the small est segments of the minority enrollmen t
statewide , made the greatest gains in actual numbe rs from 1976 to 1978. Those three
categories, non-resident aliens, American Indian or Alaskan Native , and Asian or
Pacific Islander, increased -- as can be seen from Table I -- by 55 .9, 33.l, and
27.6 percent, respectively. In actual headcount, these three groups accounted for
2,036, or 91 percent, of the 2,220 minority student headcount gain . A review of
Tabl e II above shov1s that fev1er Hispanics and appreciable more non-resident al ien s
are represented in the private sector's minority population . A more detailed profile
of the 1976 to 1978 change in ethnic group representatio n with in the public sector
is presented in Figure I.
Publi c and Private Sector -- Two and Four-Year
Institutio n Minority Participation Rates
Two-year institutions 1vithin the public sector have a minority participation rate
of 17.9 percent compared to the four-year institutions' 12.3 percent participation
rate (Tabl e III). Data seems to validate the American Council on Education statement
conta i ned in the aforementioned "Hi gher Education and Nationa l Affairs" February 16,
1979, issue that'' . . .. minority enrollment also tends to concentrate in the lower
years of higher education ....
11Table III further shows that the participation rate of Hispanics and black non
-Hispan ics is greater at the two-year as opposed to four-year state-supported
insti-tutions. Only in the ethnic category As ian or Pacific Islander is the participation
rate lo\'1er in the tv10-year sector.
9,000
8,000
7,000
(./)6,000
.µ s::: Q) E5,000
..-0 !.-.4,000
s::: w3,000
2,000
1,000
2, 096
1976 11978
rlorr-Res1dait
Alien
11-1(e)
FI GURE I
Minority Enrollment
byEthn ic Group
Colorado State-Sup ported Institutions
of Posts econda ry Education
1976 1978
Black
~bn-Hispa ni c
1976 1978
American
Indian
or
Alas kan
r·Jative
1976 1978
Asian or
Pacific
Is l ander
Ethni c Categories
1976 1978
Hispanic
11-1 (h)
..
TABLE II I
Knm<1n ,·linor ities as a Percent of Total
Postsecondary Enro ll me nt in Colorado
With Colorado Populat io n Compa risons
TOT L COLORADO 1978
Ethnic Categor1
State Popul ation*
Percen t of
I
Non-Res id ent Alien
N/A
Blac k Non -Hi soani c
3. 78
Amer ica n India n or Alaskan Nati ve
0.47
Asia n or Paci fic Islander
0. 93
Hi soa n i c
13 . 67
Total Colorado Minorities as a Percent of
Total Population/Higher Education
Enro llment
18 . 85PUBLIC SECTOR 1978
Percent of Total
Fou r- ~ear
Ethnic Cateqory
In stitu tio ns
Non -Resident Ali en
2. 1
Black Non-Hispanic
2.9
Amer ican Indian or Al as ka n Native
0.7
Asian or Pa cif ic Isiander
1. 4His panic
5.2
Total Minority Students as a
Percent of Enrollment at
State-Suooorted Institutions
12 .3
PRIVATE SECTOR 1978
Percent of ·iota
1Hiaher Education
2. 3
.:,. 2
0.8
- 1.3
5. 913.5
~ercentor Tota l
T1<10-Yea r
Institutions
2.4
3.9
1.4 1.1
9. l
17 .9
I
Percent of Tota
1Ethn ic Cateaory
Private Enroll ment
Non -Resident Alien
3.3Blac k rlon-His panic
3 .4American Indi an or Alaskan Nati ve
0. 7
Asi an or Pac ifi c Islander
l.bHispan ic
2.9
Tota
1Minority Students as a
Percent of Enrollment at
Private Instituti ons
11.911-l( i )
Minor i ty Enrollment by Ins titution
Tabl es IV and V \vere created to di splay ethnic minority enrol l ments by ins t itution .
TableII/ demonstrates that among the public four-year institutions in fall 1973,
Adams State College and the Un i versity of Southern Colo rado had t he largest
pro-portions of minority enroll ment -- 33 .3 pe rcent and 28 . 2 percent,
respe~tively .A more deta il ed analysis prese nted i n Tabl e V reveals, for example, that the minority
enroll ment at Adams Sta te Coll ege increased from 1976 to 1978 in the Hispa nic ethn ic
category . Addi t ional ly, in 1976 there were no reported non -resident aliens, compared
to 22 re ported in 1978 . Overall , from 1976 to 1978, minorities as a pe rcent of total
enroll ment increased 4 percent at Adams State. As total enroll ment at Adams State
declined during the report period, the minoriti es as a percent of total enrol lment
_increased.
Si mil arly, from a review of two-y ear inst itutions, Tri nidad State Junio r College and
Community College of Denver-Aurari a Campus had the greatest proportion of minority
enroll ment i n fall 1978 (61.4 percent and 40.5 percent) . Trini dad ' s minority enro
ll-ment (Table V ) grew substantially from 1976 to 1978 from 20 . 5 percent of total
en-roll men t to 61 .4 percent . A si gn ifi can t amo un t of this i ncrease i s attribu ted by the
staff of that institution to t he establ ishment of thei r Min ing and So il Tec hno l ogy
programs which have drawn heav il y from the Hispanic minin g emp loyees .
Within the private sector, Colorado Women' s College l eads the other instituti ons with
14.1 percent minority enroll ment . \·lhile the minority enro llment at the University of
De nver is not as great a percent of the total enro llment as at CWC , it increased
from 5.1 percent of total enroll ment in 1976 to 12. 8 percent in 1978 . With in the
minority en rollment i n 1978 at the Univers ity of De nver, 490 non- res i dent ali ens were
reported as compared to 92 in 1976. American Indians doubled in numbe r at the
University of Denver from 1976 to 1978 from 39 to 79.
Characteristics of the Ethnic Minority Enro ll ment
A profile of the minori ty enroll ment in the public sector has been developed and i s
displayed in Fi gu re II to compare t he minority and no n-minority enrollments and to
reflect changes occurri ng from 1976 to 1978 within ethnic minority enrollment .
From 1976 to 1978, cl assificat ion or l evel of minority enrol l ment shifted slightly.
Total minority enroll ment in 1978 vias 89 pe rcent undergraduate, 10 . l percent graduate ,
and .9 percent first prof ess i onal. The total minority enrollment in 1978 included
a smaller proportion of undergraduates than in 1976, but showed an increase of 2
percent in the minority graduate studen t representat ion .
In 1978, f ewer minorities attended full -ti me ; were male; and were Hispanic and
black than i n 1976 . Fi gure II furt he r revea ls that while as a percent of tota l
minority enroll ment femal e students shO\·Jed only a 2. 3 i ncrease ; in actua l numbe rs,
minority fe male students increased by 996 , a 14.7 percent increase in headcount
over 1976 . The ethnic minority fema les, v1ho comprise 41 .5 percent of all minority
enro 11 men ts, are , hmvever, a 1 mos t 8 percent behind the female representation vJithi n
the no n-minority group.
11-l(j)
TABLE IV
Minoriti es as a Percent of Enroll ment
byIn st itution
1976
1978
Percent of
To ta 1
Minority
t1inority Total
11i nority
Inst itution
Enroll ment Enroll ment Enrollment Enro ll ment Enrollment
PUBLIC
Four-Year :
Aaams Sta te
2,684
793
29 . 5
2,451
828
School of Mines
2,373
233
11. 9
2,690
316
CSU
17,426
1,009
5.8
18,283
1,239
Fort Le 1i s
2,839
338
11. 9
2.846
344
Mesa
2,649
150
5.7
3,37 2
93
Metro
12,921
2,292
17 .7
12,597
2,360
UC - Bou lder
21,061
2,297
10 .9
21,318
2,250
UC - Colo .
5~rin~s3,668
340
9.3
4,390
502
UC -- Denver
7, 963
826
10 .4
8 ,516
1,021
UC ..., Med . Center
1,430
188
13 . l
1, 490
205
UNC
10, 965
732
6. 7
10,794
945
USC
5,560
1,475
26 . 5
5, 484
l, 547
~Jes
t ern State
3,332
118
3.5
3,060
91
foo-Year :
Arapahoe Comm . Co 11
~5,343
386
7. 2
6,428
686
CCD - Aurar i a
4,1 G9
1,880
45 .8
3,528
1, 430
CCD - l'lorth
4 , 767
1,049
22 . 0
4,628
743
CCD - Red Rocks
6,863
651
9.5
5,204
493
Lamar
423
28
6.6
394
57
t·loraan
428
51
11. 9
468
118
Otero
1,184
346
29 . 2
I
810
23 7
.,__Pi kes Peak
5, 618
972
17 . 3
I5,052
1,039
Trinidad
1, 425
292
20 . 5
1, 609
988
Aims
3,81 3
556
14 . 6
4, 64 5
738
CMC - East
1,835
160
8 . 7
2,058
223
CMC -
\~est1, 968
29
1. 5
2, 460
177
Colo. Northwestern
1,222
41
3.4
i
1, 705
39
North easter n
N/A
N/A
fl/A
i
. N/A
N /.A.PRIVATE
I
Colorado Coll ege
l ,81l
142
7.8
1,884
200
CHC
570
82
14 .4
427
60
Loretto He1qhts
859
133
15. 5
18995
Reqis
1,068
83
7.3
1, 474
170
DU7,868
400
5.1
7 ,580
972
Conservati ve Ba ot .
294
16
5.4
379
N/A
Il iff
285
ll
3.9
I299
13 nSt. Thomas
200
17
8. 5
166
13
USAF A
4,592
44 1
9. 6
4 ,41 7
568
Co lo . Tech. Co 11 .
224
17
7.6
361
45
Rockmont
N/A
N/A
N/A
~~/AI
NI.I-\Yeshiva
40
1
2. 5
35
-0-r - - l~e s
tern Bi ble
204
10
4.9
214
10
Nazarene Bibl e
N/A
N/A
tl/
A
N/A
N/A
Intern1ountain
~!/AN/A
MIA
M//'.l, r~/A
SUB-TOTALS
I
Publi c - Four Yea r
94 ,871
10,841
ll .4
97 ,29 1
11.741
-
Private
Pub l ic - Two Year
38 ,998
lS.015
6, 44 1
1. 353
16 . 5
7. 5
33 .939
6 963
HL O? S