VT Nummer : Titel: Författare: Resursgrupp : Projektnumner : Projektnamn: Uppdragsgivare : Distribution: 5-93 Datum: 1993-09-01
Influence of activation of filler on the properties of asphalt concrete
A Akoulitch P Höbeda Asfaltbeläggning 11352 VTI Fri du Väg- och Trafik-/
[nå/"tutet
INFLUENCE OF ACTIVATION OF FILLER ON THE PROPERTIES OF ASPHALT CONCRETE
by
ALEXANDER AKOULITCH, BYELORUSSIAN POLYTECHNIC ACADEMY PEET HÖBEDA, SWEDISH ROAD AND TRAFFIC RESEARCH INSTITUTE
ACKNOWLEDGEMENTS
The authors wish to thank the Swedish Institute and Swedish Road and Transport Research Institute for financial and organizational support which has allowed us to realize this project.
SUMMARY
This paper describes the results of the research project at
VTI to study open and dense graded asphalt concretes with
different types of mineral filler. The aim of this project
was to extend the possibilities to determine the possibility of improving the quality of asphalt mixes by using activated
fillers. This paper contains the results of a study of a granite filler; the same granite filler activated by an amine agent during milling (activated filler), limestone filler and granite filler with additives of hydrated lime and Portland cement. Different test methods were used to study the fillers used in asphalt mastic and asphalt
concrete. Parallel with Swedish test methods, the Byelorussian test methods such as boiling test and
compressive strength after water immersion test were used, which allowed a more efficient comparison of the fillers, asphalt mastic and asphalt concrete. Mechanical properties
and stripping ability were tested to estimate the quality of asphalt mixes. Mechanical properties were determined at
temperatures from +2°C till +50°C. Water susceptibility was studied by water storage of asphalt specimens for 8 days at temperatures of +20°C and +40°C.
The main conclusions from this work are that activated
filler increases the mechanical properties and stripping
resistance of the asphalt concrete and permits a reduction
l. INTRODUCTION
Mineral filler for asphalt mixes is produced by milling of fine aggregates or by dust separation in the asphalt plant. Fillers have a fine grading and therefore also often
have high hygroscopic ability and a tendency to form lumps during storage. As a rule, limestone and dolomite are used for production of commercial fillers. It is possible to
manufacture fillers by milling other natural or artificial
mineral materials. In Byelorussia, there is experience from milling quartz sand and spent foundry sand. Fine powders,
such as fly ash, cement or lime kiln dust, Portland cement,
hydrated lime etc, can also be used as fillers. They may
have surface activity and can in some cases be used as adhesion promoting substances.
At present, dust from cyclones and bagvhouses is mainly used
in Sweden, but sometimes also limestone filler is used to
improve the quality of the asphalt mix. For example, in stone-mastic asphalt in HABS (Vägverket, Publ. 1988:42 ) at least half the filler mass must consist of limestone filler.
Using the HABS type mixes, surplus fine aggregate is
produced, e.g. 0-2, or 0-4 mm, and is often considered as a
waste, difficult to market. One possibility is to mill the fine aggregate to filler. It is widely believed that fillers obtained from acidic type aggregates such as granite (unlike fillers from basic type aggregates such as limestone) are inferior. One possibility is to activate an acidic type filler and change its surface properties.
Mineral filler is an important component of asphalt
concrete. The filler has a much larger total surface area
than the other components in the aggregate and therefore adsorbs most bitumen, behaving as an active component. It
also has a considerable influence on the properties of the asphalt concrete. The fine part of the mineral filler, together with bitumen, forms an asphalt glue which sticks the aggregate particles together. The durability of filler/ bitumen bonds depends on physical-chemical interactions (of the filler with bitumen) and is conditioned by the adhesion on the filler/bitumen interface. The durability of the
adhesion depends on the type of mineral filler. The basic
type fillers (limestone, dolomite etc) - are hydrophobic
(water hating) and are wetted by bitumen very easily also in the presence of water. Acid type siliceous fillers (granite,
quartzite etc) - are hydrophilic (water loving) and are
wetted by bitumen with more difficulty. Therefore, the
quality of the asphalt concrete depends on both the content and properties of the filler.
activation process. The technology of filler activation was
developed about 30 years ago by the Moscow professor L.B. Gezencvej. The main idea of activation is the full
realization of aggregate potentialities. A surface active
agent (SAA) is introduced in a ball mill while milling the
fine aggregate. During the milling process, fine particles
are produced and the fresh (new) surfaces of these particles have a high chemical activity and surface energy. An
interaction between an SAA and a fresh filler surface leads to very strong chemical bonds between the SAA and filler.
The choice of SAA is fairly complicated because it has to
suit both the filler and the bitumen.
Another action of the filler, not considered in this paper, is to stiffen the bitumen in the asphalt mix. This property has been more thoroughly investigated and voids in the
compacted filler (e.g. according to the Rigden method) are considered to correlate with the stiffening action. Very fine powders may also act as bitumen extenders
(micro-fillers) and can be used only in small proportions in the asphalt mix.
2. MATERIALS TESTED
The following materials were used in this project:
granite (Skärlunda), density 2.6340 g/cm3
granite (Skärlunda)limestone (CaC03 - 90%, density 2.660 g/cm3)
Bitumen - B85 (Nynäs)Asphalt concrete
open graded HAB 12Ö
dense graded HAB 12T
Coarse aggregate Mineral filler
To improve water resistance, the following additives were
used:
- Amine - 3020-AA from Bergvik Kemi AB. This chemical
substance is usually used as an emulsifying agent to prepare a bitumen emulsion.
- Hydrated lime Ca(OH)2 - 93%
3. TEST METHODS USED
A laser g r a n u 1 o m e t e r 715 (CILAS) was used to determine the specific surface area and mean particle size of the mineral filler.
The h y d r o p h 0 b i c c o n d i t i o n of mineral
fillers was determined according to the former Soviet
Standard GOST 16557-88. A glass with a volume of 500 ml is filled with distilled water to 50 mm below the brim. Two
grams of the filler is distributed on the surface of the
water. The filler is considered hydrophobic if it does not sink after 24 hours of storage.
A b 0 i l i n g test was used to determine the adhesion
between bitumen and filler. Tests were carried out in the following order: A sample of 200 9 of the filler is mixed
with 50 g of bitumen. The mixing temperature is 150°C. The
mastic sample is distributed thickly on the table and
divided into small pieces. The pieces are placed in the cup with boiling water. The level of water must be at least 10
mm above the mastic sample. After 5 min boiling, the sample
is removed from the surface of the water with a filter
paper. Then water is poured off from the cup and mastic
samples are distributed on the filter paper to dry. The next day, it is possible to assess the durability of the adhesive bond by comparing the appearance of mastic samples. A sample with a shiny, dark appearance has a better adhesive bond durability than a shiny, light one.
The r o l l i n 9 b 0 t t 1 e test was used according to Swedish Specification (FAS 455-89), not as in the usual manner for analysis of aggregates, but for samples of
mastic. After the test, the water with more or less degraded
mastic is poured from the glass bottle onto the filter paper
and after drying it is possible to assess the durability of the samples. The appearance of the samples provides
information on adhesive bond durability as in the former test. The assessment of the samples was carried out after
one, three and five days of rolling action.
A p e n e t r a t i o n test was used to obtain
information on the rheological properties of the filler/
bitumen mastic. Penetration test was carried out at temperatures of +20°C, +25°C and +30°C.
To estimate the mechanical properties of asphalt concrete
with different types of fillers and additives, the
compressive strength (according to the former Soviet
Standard), as well as indirect tensile strength and (FAS
The test specimens were compacted by an ITC-type gyratory compactor and both diameter and height of specimens were 100
mm. As the ITS equipment was not available throughout the investigation, Marshall compaction has also been used.
Specimens compacted according to different methods cannot be
compared. It is well known from other investigations that a gyratory compaction procedure gives lower values for
mechanical properties (more comparable to road conditions)
than Marshall impact compaction.
The c o m p r e s s i v e strength test was carried out using an hydraulic press. The test temperature was +50°C.
I n d i r e o t tensile strength was tested using a MTS
equipment. The test temperature was +10°C.
R e s i l i e n t modulus was tested using MTS equipment.
4. MILLING TECHNOLOGY FOR MINERAL FILLER
A laboratory ball mill (ordinarily used for aggregate testing according to FAS 259-62) was used to study the
influence of different variables in the milling process on the filler properties. Specific surface area, mean particle size and content passing sieve 0.075 mm were chosen as the
criteria for assessing filler properties. The influence of the number of revolutions (milling time) and rotation speed
was studied. Two sizes of steel balls were used at the same
time: diameter 15 mm and diameter 27 mm. The quantity
relationship between large and small balls influences the mean particle size produced and the content passing 0.075 mm
sieve. Large balls produce an increase in the passing content, while small ones have a greater influence on the mean particle size. Tests have shown that the best quantity
relationship between large and small steel balls is 1:2.2
(by weight). In our tests, 1 kg of fine aggregate, 2.25 kg of large balls and 5.0 kg of small balls were used.
As shown in Figure 4.1, the best results were obtained at
50 revolutions per minute. Increasing and decreasing the rotation speed results in a decrease in the specific surface area, content passing 0.075 mm sieve and an increase in the mean particle size.
The change of the number of revolutions (milling time) from
3,200 to 5,400 shows that the range of particle dimensions increases quickly only to 4,800 revolutions and then more slowly. However, thecontent passing 0.075 mm continued to
increase up to 5,400 revolutions (Fig. 4.2).
Addition of the surface active agent (SAA) influences the
milling conditions. Activated filler has a non-sticking surface and does not form lumps. This is well illustrated when sieving the fillers using different time settings (Fig.
4.3). Comparison of the contents passing 0.075 mm sieve for
activated and unactivated fillers shows that for unactivated
filler after 20 and 40 minutes the passing content changes
from 65% to 85%, while for activated filler the passing contents are practically equal. When the SAA content is increased, the passing content also increases. However, the
specific surface area decreases slightly. Thus, the Optimum
SAA content for granite filler is about 0.12-0.2% by weight (Fig. 4.4). Increasing the SAA content reduces the content passing 0.075 mm sieve and especially the surface area.
5. ACTIVATED FILLER PROPERTIES
The main idea of activation is a modification of the granite
filler surface from an hydrophilic to hydrophobic condition.
The test of hydrophobic condition (floating properties of filler on the water surface) has shown that the SAA additive
greatly influences the hydrophobic condition of the filler.
Table 5.1 shows the dependence of the hydrophobic condition
on SAA content.
Table 5.1
SAA content, % Hydrophobic condition
0 Hydrophilic, filler particles sink immediately.
0.06 Hydrophobic, but some particles sink immediately.
0.12 Hydrophobic, but after 24 hours some particles have sunk.
0.20 The best hydrophobic condition, ver
stable.
-0.30 __uu__
0.60 Hydrophobic, but after 24
hours some particles have sunk.
This test allowed us to optimize the SAA content for the
best hydrophobic condition of the filler.
The boiling water method was used to test the bitumen/filler
mastic. Boiling water has an ability to destroy the adhesive
bonds and penetrate between filler surface and bitumen film.
Photo 5.1 shows the results after 5 min boiling for
unactivated (1) and activated (2) granite fillers. The large difference between the samples is due to the extremely
severe test conditions. Nevertheless, the test well
illustrates the poor durability of the physical Van der
Vaal's forces which are believed to be the main reason for
adsorption of the bitumen film by the unactivated siliceous
granite filler. Strong chemical adsorption is created by
certain active components of the bitumen and the surface of the activated filler.
The Swedish rollingbottle test (modified for filler) gives
gentler but longer test conditions and the difference
between the unactivated fillers (samples 11, 12, 13) and activated fillers (samples 21, 22, 23) is not as great as in the boiling test. See Photo 5.2. However, after 24 hours of
rolling, and also after three and five days of rolling, the
activated filler is darker than the unactivated filler.
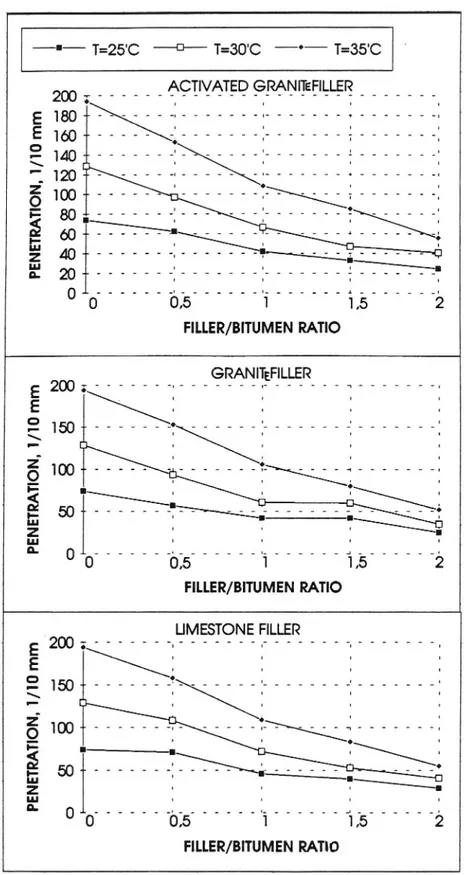
Study of the mechanical properties of the bitumen/filler mastic have been carried out by penetration test at
temperatures from +25°C to +35°C and a filler/bitumen ratio from 0 to 2.0 (Fig. 5.1)
The test results show that there is no appreciable
difference between the different types of filler.
6. ASPHALT CONCRETE TESTING
6.1 Test program for asphalt concrete.
An open graded asphalt concrete (HAB 12 Ö) and dense graded
asphalt concrete (HAB 12 T) were chosen to study the influence of the mineral filler on asphalt concrete properties. A rather high voids content was considered desirable to differentiate between the durabilities of the test mixes. Table 6.1 gives the aggregate grading for these
mixes.
Table 3.1
Particle size HAB 12 Ö HAB 12 T
Content, % Content, % 1 2 3 >11.3 O O 8-11.3 45 20 5.6-8 13 16 4-5.6 9 8 2-4 12 14 1-2 6 10 0.5-1 4 10 0.25-0.5 1 6 0.125-O.25 l 6 0.074-0.125 l 2 <0.074 8 8 12
Photo 5.1
F111er/bitumen mastic samp1e after boi1ing test 1) unactivated
fi11er, 2) activated fi11er.
vwmm
1+
m
Ph ot o 5:2 Fi 11 er /b it um en sa mp 1e s af te r r0 11 in g bo tt 1e te st (un ac ti va te d fi 11 er 11 , 12 , 12 ac ti va te d fi 11 er 21 , 22 , 23 ). af te r on e da y af te r th re e da ys af te r fi ve da ys
Table 6.2
Number of Number of Type of Bitumen Method of asph. mix. specimens filler content compaction
1 2 3 4 5
1 (open) 8 activated 5.5 Marshall
granite 2 (open) 8 -- 5.0 --3 (open) 8 -- 4.0 --4 (open) 10 -- 4.0 Gyratory 5 (open) 10 granite 4.6 --6 (open) 10 limestone 5.0 --7 (open) 10 granite* 4.5 --8 (open) lO limestone* 4.9 --9 dense) lO granite 6.2 --lO (dense) 10 activated 5.5 --granite
ll (open) 6 granite 4.6 Marshall 12 (open) 6 granite+ 5.4 --hydrated lime** 13 (open) 6 granite+ 5.2 --hydrated lime** 14 (open) 6 granite+ 5.1 --cement
* mixes 7 and 8 contain an activated bitumen (bitumen B85
**
The test program
6.2) The bitumen
according to the
Thus I 24 asphalt
Marshall Hammer and 70 specimens with the Finnish ICT Gyratory Compactor (not available throughout the
investigation). The following test schedule was made up for
these 94 specimens (see Table 3.3)
with additive of O.3% SAA).
combined fillers contain 75% granite filler and 25%
hydrated lime (mix 12) or 75% granite fine aggregate and
25% hydrated lime, and are milled together (mix 13) or
75% of granite filler and 25% of rapidly hardening
Portland cement (mix 14).
13
includes the following mixes (see Table
content was adjusted by trial and error
appearance of the mix.
Table 3.3
Number of Resilient Indirect Compressive Gyratory
le mcdulus tensile strength test
strength l 2 3 4 5 l - + - -2 - + - -3 - + - -4 + + + + 5 + + + + 6 + + + + 7 + + + + 8 + + + + 9 _ + - + 10 - + _ + 11 - + - -12 - + - -13 - + - -14 - + _ _ 14
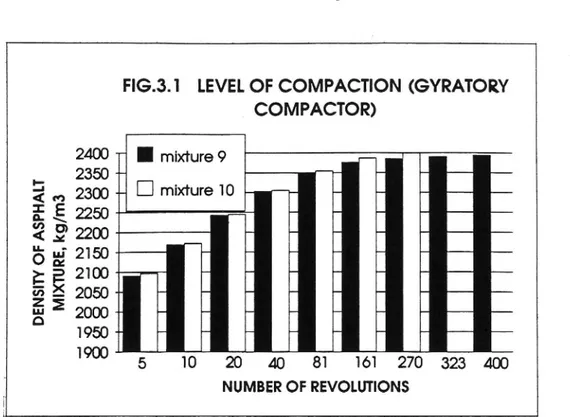
6.2 Gyratory test results.
The ICT Gyratory compactor was used for compaction of asphalt concrete specimens and for studying the
compactibility properties. Mixes 4-8 were compacted with 4-8 gyratory revolutions. Table 6.4 gives the theoretical void
free density, mean bulk density and mean air voids content. Mixes 9 and 10 were compacted to a density of 2.4 g/cm3 and
Fig. 3.1 gives the compactibility for asphalt mixes with activated and unactivated fillers. The difference between activated and unactivated fillers is not significant until
the end of compaction. Activated filler requires 270 revolutions to reach a bulk density of 2.4 g/cm3, while unactivated filler does not reach this value even after 400 revolutions, despite a higher bitumen content.
Physical properties of mixes with different fillers after gyratory compaction
Table 6.4
Number of Theoretical Mean bulk Mean air voids
mix void free density content, %
density 4 2.482 2.043 17.1 5 2.464 2.019 18.0 6 2.447 2.030 17.1 7 2.464 2.066 16.7 8 2.447 2.049 16.3 9 2.443 2.397 1.1 10 2.422 2.400 1.9
6.3 Mechanical properties of asphalt concrete
Resilient modulus was determined at temperatures of +2°C,
+10°C, +21°C, +28°C before and after water storage. The
asphalt concrete specimens were stored in water for eight days after a vacuum saturation period. The storage
temperature was +20°C. One per cent by weight of salt (NaCl) was added to the water to achieve a more aggressive
condition. In all cases, the mixes containing activated
filler have higher resilient modulus values compared with
mixes containing unactivated filler. All results are shown in Fig. 6.2 - 6.5. It should be noted that the temperature of the specimens exerts a considerable influence on the results from resilient modulus test. The equipment used to
control specimen temperature gave a variation of 2°C. This
is a rather large variation and must be taken into account
when analyzing the test results. Fig. 6.6 shows the influence of temperature on the resilient modulus for
asphalt mixes with activated and unactivated fillers.
The indirect tensile and compressive strength tests describe additional Characteristics of the asphalt concrete. The
compressive strength test was used to study the asphalt concrete at a temperature of +50°C. According to the former Soviet Standard, the asphalt mix with higher compressive strength at this temperature has a low sensitivity to
rutting. The indirect tensile strength test was carried out at a temperature of +10°C. Therefore, these two test methods describe the behaviour of asphalt concrete both at high and low temperatures. Both the tests were carried out before and after storage in water for eight days at temperature of
+20°C. Test results are shown in Fig. 6.7 and 6.8
(compressive strength) and Fig.6.9 and 6.10 (indirect
tensile strength). It will be seen from Fig. 6.2 - 6.5 that the specimens manufactured by impact (Marshall) compaction
have considerably higher modulus and strength values than specimens manufactured by ICT compaction.
It should be noted that the water storage condition has been fairly mild for high quality Swedish aggregate and bitumen and does not distinguish between the different types of fillers. This is why it was decided to make the water
storage condition more severe, as well as for comparing the activated filler with antistripping agents such as hydrated lime and Portland cement. Therefore, the water temperature was increased to +40°C for new water storage conditions. The
storage time was eight days as before. The indirect tensile strength test now permitted us to display more significant
differences between asphalt mixes with different types of
filler. See Fig. 6.11 and 6.12.
Finally, by comparing the change of the coefficient of water
resistance at different water storage temperatures, it is possible to determine the advantages of activated filler as a component in asphalt concrete (Fig. 6.13)
CONCLUSIONS
The technology of activation allows a modification of the granite filler surfaces from a hydrophilic to hydrophobic condition.
After activation, the granite filler has improved adhesion with bitumen.
Asphalt concrete with activated filler has better mechanical properties (compressive strength, indirect
tensile strength, resilient modulus) both at high and low
temperatures.
Use of an activated filler increases the stripping
(coefficient of water resistance) of asphalt concrete. The activated granite filler allows a decrease of 10-15% in bitumen content compared with the unactivated granite filler.
The comparison of the unactivated filler, activated
granite filler (AGF) with a granite filler, modified by addition of hydrated lime or Portland cement, shows that
AGF has a lower coefficient of water resistance, but at a
lower bitumen content. This fact is illustrated in Figure 7.1, which also gives a summary of the more important
results obtained.
Fig. 1.1. influence of the rotation frequency on the specific surface area, mean particie size and content passing through 0,075 mm sieve.
( 1 - 40 rev/min; 2 - 50 rev/min; 3 - 65 rev/min )
A) number of revolutions: 3200
U0 3300 «
' m'3 \ 3200 -
o
3% 3100--
;g *2
M
0 s 3000 <-
3; E
-ä
:3 3 2900 -
g
å_
3 2800 4
å få
9). 2700B) number of revolutions: 4800
23 i' m e a n pa rt ic ie si ze , m m * 1 0 pa ss in g s p e c i f i c sur fa ceFig. 1.2. lnfluence of the number of revolutions on the specific surface area, mean particle size and content passing through 0,075 mm
sieve.
( 1 - 3200 revolutions; 2 - 4800 revolutions; 3 - 5400 revolutions )
% ful l pa ss , sp ec if ic sur fa ce ar ea , cm ^2 lg me an pa rt ic le si ze , mm "' 10 °3
Fig. 1.3. Influence of the surface active agent on the amount passing 0,075 mm sieve.
NUMBER OF FILLER
Nr. 1 and 3 - sieving time 20 min
Nr. 2 and 4 - sieving time 40 min
Nr. 1 and 2 - without SAA
Fig. 1.4.
Influence of SAA content on the ñller properties.
96 1-E E I!) N O. O 0: .E 8 oo. o :0 N N 01 e 0 H 5 s 5 s 5 o O 0 o o
surface active agent content,%
8 3100 --.§3 3000 " :i 2900 *>
Ȋ
0 . 2800 "2:: 2;
,d H 2700 " 8 m 2600 '-o. m 2500 * o se N N en ut o .-4 . . . N N O O O 0 oFig. 2.1.
Penetration of the filler/ bitumen mastic at different
temperatures.
--- T=25'C -D- T=30'C
o 1:350
200 x . _ . . - - êçT'YATEC? ?PAN'TEF'ELEE _ . _ _ . _ -i
E |E
0S
2'
.Q
.-äm
2 LIJ O. FILLER/BITUMEN RATlO GRANITEFlLLER 2(1) : ° ' ' - - - -n - - - '- - - 1 - - . . . . -. PE NE TR AT IO N, 1/ 10 m m FILLER/BITUMEN RATIO?m UMESTONE FILLER
E
: ' ' ' ' ° ' *u ' ° ' ' ' ° 'u'
' ' ° ' 'u ° ' ' ' ' ' '
E
I
'
'
'
o \? I- ' ' ' ' ' ° ° ..\..3 100- - -
-.-=
'
.
:
E 50-
:
- - -
--2 aä 0 L _ _ _ _ _ - -: _ _ _ _ _ _ _ _ . _ _ _ . _ _: . _ _ . . _ _:
0 0,5 1 1 5 2 FlLLER/BITUMEN RATlOFig. 3.1.
Level of compaction (gyratory compactor).
Mixture 9 - granite ñller Mixture 10 - activated granite ñller
FIG.3.1 LEVEL OF COMPACTION (GYRATORY
_ COMPACTOR)
ä
" I mixTure 9
2350 W._ EJ mix'rure 10
8 8
BI
S
8
8
MI XT URE, kg /m 3 N N N NDE
NS
IT
YO
F
AS
PH
AL
T
ä
?5
o
0
.a
.a
8
8
8
8
8
5 10 20 40 81 161 270 323 400 NUMBER OF REVOLUTIONSFIG.3.2 RESILIENT MODULUS AT TEMPERATURE +2°C BEFORE AND AFTER WA'I'ER STORAGE (8days,+20° C)
I BEFORE [3 AFTER
\1
ñv
2
3,
4
5
6
7
8
\_,_./
9
10
grahau hammcr MER OF ASPHALT MIXTURE dens:
FIG. 3.3 RESILIENT MODULUS AT TEMPERATURE +10'C
BEFORE AND AFTER WA'I'ER STORAGE (8days,+20'C)
14000
I BEFORE
12000
10000
8000
6000
-4000
'2000
-D AFTER
RE SI Ll EN T MO DU LU S, M P a\1 \2/ 3, 4 5 o 7 8 M
FIG. 3.4 RESILIENT MODULUS AT TEMPERATURE +21*C BEFORE AND AFTER WATER STORAGE
(Bdays, +20° C)
6000
I BEFORE
rg 5000 E] AFTER§ 4000.
3 m 3000E 0
2 1000 - I°J\1
3,,
4
5
6
7
8
\9
10,
Marshall hummer MER OF MIXTURE dense ACFIG. 3.5 RESILIENT MODULUS AT TEMPERATURE +28°C BEFORE AND AFTER WATER STORAGE (8days,+20°C)
0 3000
I BEFORE
LE_ 2500
[I] AFTER
(O3 2000-
-D 0 0 1500 " E5 1000«
5°°'
I I' I1 i'
0 0.
I I I I
6 7 8 9d_
N2
34
4
5
Marshall hummer NUMBER OF ASPHALT MIXTURE
\ 10 ,
dense AC
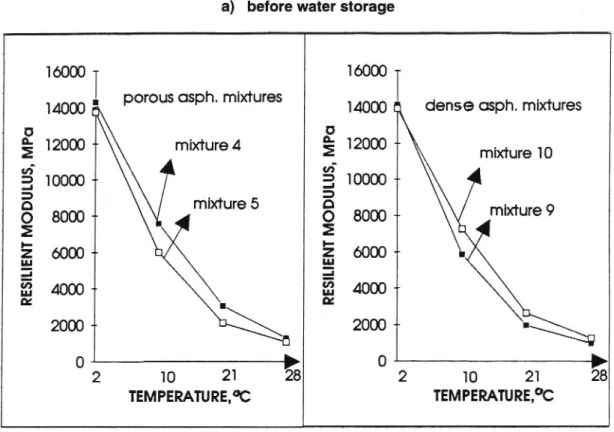
Fig. 3.6.
Influence of the temperature on the resilient modulus for mixtures
with activated filler (number 4 and 10) and with unactivated filler
(number 5 and 9) for gyratory compacted specimens.
a) before water storage
10000 T 16000 {
14000 . porous osph. mixtures 14000 dense osph. mixtures
°
.
2
..
g 12000 -> mlxturea §- 12000 minure 10§ 10000 -r
'å 10000
-D . g muxture 5 O 0 80m __ O ._ mixture 9 2 E'-2 4000 --
E 6000 v
2
E
:T: 4000 -
E 4000
-o: 0: 2000 -- 2000 *r 0 0 2 10 21 28 2 10 21 28 TEMPERATURE,°C TEMPERATURE,°Cb) after water storage (8 days, +20°C)
14000 3 16000
porous mph' minures
dense osph. mixtures
12000
14000 *
O mixture 4 0 o. 0.. -. ' 2 10000 q_ 2 12000 mnxture 10 en' en' 3 3 10000--2 8000 0
minure 5
g
mixture 9
g (2) 8000 -> 6000--'i
E 6000 »
2 L .E* 4000
E* 4000
-o: 0:2000 '
2000
0
»
0
2 10 21 28 2 10 21 28 TEMPERATURE,°C TEMPERATURE,°CFig. 3.7. Compressive strength of asphalt mixtures before and after water
storage ( 8 days, +20°C ) for gyratory compacted specimens.
(temperature of test: +50°C)
I BEFORE D AFTER ____
å
å
-J N N O O O O8
8
8
8
8
§
CO MPRE SS IV E ST RE NG TH , KPCIs
å
O 4 5 b 7NUMBER OF ASPHALT MIXTURE
Fig. 3.8.
Coefficient of water resistance after compressive strength test.
k) d 1 .0 oo CO EF FI CI EN T OF WA TE R RE SI ST AN CE o o I: 0 o ?0 O
FIG. 3.9 INDIRECT TENSILE STRENGTH BEFORE
AND AFTER WATER STORAGE (8days, +20'C)
FOR GYRATORY 5PEC|MENS
2500
- densc AC E A9
2000
I before D after
I
_
E
:3
1500 -
-= 2
å 2
E 1000 - * |_8
ä
500-E0 J
5
6
7
8
9
10 '
NUMBER OF ASPHALT MIXTURE
FIG.3.10 COEFFICIENT OF WATER RESISTANCE AFTER lNDIRECT TENSILE TEST
M
E
3 8
0 zå ä
Ö :3 E o:'5
0
NUMBER OF MIXTURE2500 2000 1500 1000 IN DI RE CT TE NS IL E STRE NG 'I 'H , MP a 500
FIG.3.11 INDIRECT TENSILE
STORAGE(8 days,+40°C)
FOR MARSHALL SPECIM ENS
STRENGTH BEFORE AND AFTER WA'I'ER
I BEFORE
D AFTER
1 2 3 1 12
13
NUMBER OF ASPHAL'I' MIXTURE
14
FIG.3.12 COEFFICIENT or wnmER
RESISTANCE, Z
L 4 C O E F F I C I E N T O F W A T E R R E S I S T A N C E99
99
99
9°°
O H wa U I m l e D D -l l lFig. 3.13.
Coefficient of water resistance for asphalt mixtures with activated
(1) and unactivated (2) fillers after 8 days of water starage at
different temperature.
I 200
D 400
CO EF FI CI EN T OF WA TE R RESI ST AN CE o 0sp ec if ic sur fa ce ar ea , cm 2/ g 3250 B) number of revolutions: 4800 2500 sp ec if ic sur fa ce ar ea , cm 2/ g N 00 3250 000 750 O) O) C 01
A) number of revolutionsz 3200 (1 - 40 rev/mm0 9 2 - 50 rev/mm,0 3 - 65 rev/min )
mean particle size and content passing 0,075
Influence of the revolution speed on the specific surface area,
mm Sleve.
FIG. 4.2
Influence cf the number cf revclutions on specific surface area,
mean particle size and content passing 0.075 mm sieve.
( 1 - 3200 revolutions; 2 - 4800 revolutions; 3 - 5400 revolutions )
N 00 80 3250 \1 01 3000 21 2750 sp ec if ic sur fa ce ar ea , cm 2/ g pa ni cl e me an si ze , m m
2500 ...L (0 co nten t pa ss in g 0. 07 5m m si eve ,% x: 0
co nten t pa ss in g 0. 07 5 m m si eve , °/o 120 100 80 60 40 20
Influence of the surface active agent on the
content passing 0.075 mm sieve.
Fig. 4.3.
without SAA
'*wr.'i! wy .-,n'.s. A.:W531. ' i" -.
,n
a
L
'1 I
min .4 33:!? ?Ginna-a* m *;artigt « 7
1 *Ej* eg:- 4_ r Wnå*'hvnrngu'qugç i ,... sieving time: 40 min sieving time: 20 min sieving time:
Fig. 4.4. Influence of SAA content on the filler properties. co nt en t pass in g 0. 07 5m m 0 0,12 0,2 0,3 0,4
surface active agent content,%
3200 3000 2800 sp ec if icsur fa ce ar ea ,c m2/g 2600 0 0,06 0,12 0,2 0,3 0,4
Fig. 5.1. Penetration of the filler / bitumen mastix at different temperatures.
+ T=25°C _D_ T=30°C
-4- T=3_5°C
Activated granite filler
200. E \ E 120 EJ\\ç\c \ .9 -o-ø _I_
:2:: 40
0 0,5 1 1,5 2 Finer/bitumen ratio Granite filler 200 4 E \5
E3\
" 12080
I
,4
E 40
O 0 0,5 1 1,5 2 Filler/bitumen ratio Limestone filler 200 4 g \ S 160:-
CN
.9.*as
c 4*
3
:§3
i
O 0
0,5 1 1,5 2 Filler/bitumen ratioNumber of revolutions 323 400 1 800 O m s må 2 8 2 5 : 3 3 : 6 _ åäö 2400 2300 2200 21 00 2000 2500
E] Mix 9 (granite filler)
Mix 10 (activated granite filler)
Fig. 6.2. Resilient modulus at temperature +2°C before and after
water storage ( 8 days, +20°C ).
EI before water storage gå efter water storage
20000
å? 16000
2.9. 12000 -
3 'DE
._ 8000 -C .<2 :ä D: 4000 -O 1 2 3 4 5 6 7 8 9 10Number of asphalt mix
Fig. 6.3.
Resilient modulus at temperature +10°C before and after
water storage ( 8 days, +20°C ).
E] before water storage after water storage
16000
6.
2 12000 a; 26
0 8000 r7
E'2173 4000 F
5
0=
0
2 3 4 5 o 7 8 9Number of asphalt mix
Fig. 6.4.
Resilient modulus at temperature +21 °C before and after
water storage ( 8 days, +20°C)
EI before water storage after water storage
Re si lien t mo dul us , M P a
Number of asphalt mix
Fig. 6.5.
Resilient modulus at temperature +28°C before and after
water storage ( 8 days, +20°C )
D before water storage after water storage
4000 0) O O O _L
8
0 r 3: 35 5 .. Tr. Re si li en t mo dul us , M P a m8
O 4.kr: . _' ;1 53 15 ' ä; 1 1 2 3 4 5 o 7 8 9 10Number of asphalt mix
Fig. 6.6. Influence of the temperature on the resilient modulus for mixes
with activated filler (number 4 and 10) and with unactivated filler
(number 5 and 9) for gyratory compacted specimens.
a) before water storage
1 6000
I
i
1 6000
l
i
N porous osph. mixes \ dense osph. mixes
ä 12000 5? 12000 2 mix 4 E mix 10
-ä
å
E 8000
mix 5
E 8000
mix 9
E' E .<2 gä
'ä
0: 4000 0: 4000 0 0 2 10 21 28 10 21 28 Temperature, °C Temperature, °Cb) after water storage (8 days, +20°C)
16000 I 1 16000 I I
porous osph. mixes dense asph. mixes
5 12000 ä 12000 1
E
E
mix 10
en' , mix 4 m' 2D _3_D8 8000
8 8000
E
E
mix 9
å
8
E mix 5 :-.-=0
i
8
0: 4000 0: 4000 0 0 2 10 21 28 10 21 28 Temperature, °CTemperature, °C
Fig. 6.7.
Compressive strength of asphalt mixes before and after
water storage ( 8 days, +20°C ) for gyratory specimens.
(temperature of test - +50'C)
after water storage
500 400 300 200 'MV katth-;n 100 Comp re ss ive st re ng th , KP a
Number of asphalt mix
Fig. 6.8.
Coefficient of water resistance after compressive strength test.
0,8 .0 a) t of wa te rre si st an ce Ic re n .0 .b Co ef f .0 N .O 0
Fig. 6.7. Indirect tensile strength of asphalt mixtures before and after
water storage ( 8 days, +20°C ) for gyratory specimens.
(temperature of test - +50'C )
D befare water storage after water storage
2400 2000 1600 1'
1200 " .ni??? 'än
i. HjäH'M' ;ih LHi* \ ap 4 ; vJL:
i."ri v: a. va ra ' A r m kn i. .. 1. 44 1; a mi ga uáh r 'm' A-a r-sia .
1; 800 r.fi
du; 400 7 In di re ct te ns il e st re ng th, KP a
Number of asphalt mix
Fig. 6.8.
Coefficient of water resistance after compressive strength test.
0,8 53 .p ' l a. 'ct '(1,3 '4 '24:33 4* ;4 ut! i. ?är :inlägg:får .0 ru Co ef fi ci ent of wa te r re si st an ce .0 O) .0 o 4 5 6 7 8 9 10
Fig.
6.9.
lndirect tensile strength of asphalt mixes before and afterwater storage ( 8 days, +20°C ) for gyratory specimens.
ln di re ctte ns il e st re ng th , M Pa 2400 2000 1 600 1 200 800 400
E] before woter storage after woter storage
umber of asphalt mix
Fig. 6.10.
Coefficient of water resistance after indirect tensile test.Co ef fici en t of wa te r re si st an ce ...L 0 .C oo .0 0) .O 4:. .0 ro .0 o
Fig. 6.11. Indirect tensile strength of asphalt mixes before and after water storage (8 days, +40°C ) for Marshall specimens.
El before water storage after water storage
2400 2000 -1600 -
1200 -'FWNF MM
800 - .czwr
tå
35r: ?é :FG F7 3
400 -In di re ct te ns il e st reng th , M P a 3
Number of asphalt mix
Fig. 6.12. Coefficient of water resistance.
_L M _. L 0 .0 oo .O .rs Co ef fi ci en t of wa te r re si st an ce .0 .O N O) .O 0
Fig. 6.13.
Coefficient of water resistance for asphalt mixes with
activated (1) and unactivated (2) fillers after 8 days of
water storage at different temperatures.
20°c
_ L M to f wa te r re si st an ce .0 .O 0 ) C DI
IC Ie n C0 ef f .0 m|
Fig. 7.1.
Ccefficient of water resistance. RESUME.
_ I 53 00 granne granite .. ñller ñller:activat'e'd
modifled
modified
-
"i,
-
by
by
Ti;
granlte U" ;5 t i 1 d
_j- (i ted hydrated .j;; 5; POI't an
.0 0
p b.
I
granite f; in: lim?
.0 m Co ef fi cien t of wa te r re si st an ce