Differences in higher education and
relative gender unemployment
An investigation of the periods before and after the Great Recession
Bachelor Thesis Within: Economics Number of credits: 15 ECTS
Programme of study: International Economics
Authors: Elias Amundson 960305 & Pontus Möller 960221 Tutors: Line Bjerke & Jonna Rickardsson
Bachelor Thesis in Economics
Title: Differences in higher education and relative gender unemployment: An investigation of the periods before and after the Great Recession Authors: Elias Amundson & Pontus Möller
Tutor: Lina Bjerke & Jonna Rickardsson Date: May 2018
Key terms: relative higher education, relative gender unemployment, regional differences, recession
Abstract
In the past decade, there has been a shift from a higher female unemployment in 2007 to a higher male unemployment in 2016 on a national level in Sweden. However, from the regional point of view, there are indications of a lower relative unemployment in favor of women in both years. That gap widened over time, and this was likely impacted by several structural, social, and economic changes like the Great Recession and its effects on the labor market. Just like relative gender unemployment, the number of women with a higher
education relative to men increased. Hence, the purpose of this study is to find if this relative higher education had a significant effect on relative gender unemployment in all municipalities of Sweden, and if this effect differed in 2007 and 2016. Theories surrounding human capital, gender differences in unemployment, and regional differences are used to lay the foundation for and support the empirical method. The regressions are run using cross-sectional data for the years 2007 and 2016. The results show that relative higher education has a significant effect on relative gender unemployment in both years. Additionally, the effect of that variable does differ between those two years.
Table of Contents
1 Introduction
... 12 Literature Review
... 42.1 Gender Differences and Unemployment ... 4
2.2 The Effect of Education on Unemployment ... 6
2.3 Regional Differences... 7
3 Methodology
... 9 3.1 Hypothesis ... 9 3.2 Data... 9 3.3 Model ... 11 3.4 Model Variables ... 12 3.5 Method ... 154 Empirical Results
... 16 4.2 Correlation Analysis ... 16 4.3 Regression Analysis ... 175 Discussion
... 206 Conclusion
... 237 Bibliography
... 25Figures
Figure 1………..1Tables
Table 1……….10 Table 2……….15 Table 3……….16 Table 4……….18Appendix
1.1………271
1 Introduction
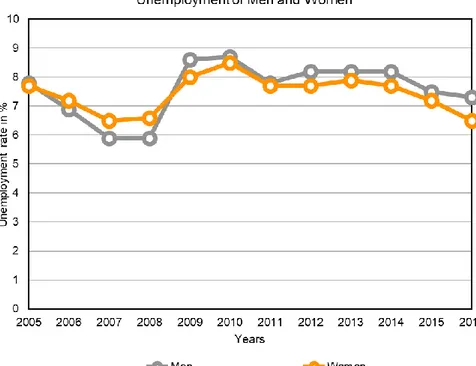
Over the last decade, the Swedish labour market showed two apparent trends. The first is that the unemployment rate has risen considerably compared to previous years. The second is that, since 2009, the unemployment rate of men has been greater than that of women. An interesting trend can be observed in the figure below: from the years 2006 to 2008 men had a lower unemployment rate than women, but after the financial crisis in 2008 those positions switched.
Figure 1. Unemployment by gender, Years 2005-2016
Source: Statistics Sweden (2017)
After Sweden experienced the financial crisis of 2008, the unemployment rate began to rise rapidly. A short while after, the number of registered students in Sweden reached its historical peak in 2009 (Universitetskanslersämbetet, 2017). Since the beginning of the 2000s, the distribution of registered students between women and men has been 60 percent to 40 percent, respectively. These numbers indicate a big gap in the level of education between women and men. So, it is interesting to examine if the lower unemployment rate for women can be explained by the fact that highly educated individuals are able to enter different job markets with greater flexibility, hence make use of their higher human capital. There is an
2
obvious gap between male and female unemployment in both 2007 (in favor of men) and 2016 (in favor of women).
The purpose of this study is therefore to find what effect relative higher education has on relative gender unemployment in all Swedish municipalities, and specifically to see if this effect differed before and after the Great Recession. With relative gender unemployment, we are referring to the total number of work-seeking unemployed women and men expressed as a ratio. Relative higher education refers to the total number of women and men who have a post-secondary education of at least three years, which is expressed in the same way. We intend to add to previous studies of unemployment differences between the genders and studies of educational differences. This is done by creating a combination of those two aspects at a municipal level in Sweden. The information shown in Figure 1 provides the national gender unemployment differences, but this paper goes further and investigates how this disparity is observed throughout all municipalities. A closer look at the regional data reveals that the majority of municipalities have a lower relative female unemployment in both 2007 and 2016. Only 75 and 24 municipalities in the respective years have a higher relative female unemployment or an equal amount on both sides. Therefore, we can see that there is a stark difference between the national and regional perspectives. In this way, a more nuanced subject can be explored and there will be further contribution to the pre-existing research.
Economic crises can be big indicators of why this difference exists. By taking a specific look at the 2008 crisis and its aftermath, one can see a clear difference in the unemployment level of men and women in Sweden. According to the data provided by Statistics Sweden, unemployment spiked after 2008, and women have had a slightly lower unemployment rate than men in the years that have followed. To a certain degree, this can be explained by the fact that many women have positions in certain sectors that are not as vulnerable in recessions, and because they can benefit from the advantages of a higher education. (Albanesi and Şahin, 2013).
Research shows that the beginning of the 1990s was a boom for higher education, and the number of registered students in Sweden increased dramatically from this point onwards. Using some numbers as reference, in 1985 there were 150 000 registered students and in 2016 that number was 343 200. Additionally, there have been more women than men among students ever since the university reformation of 1977, where woman-dominant educations
3
like teaching and healthcare were introduced to university curriculums. Before this point, men generally had a higher education than women. In 2010 the estimated number of students were at a maximum level of 365 000; and as shown in Figure 1, the average unemployment rate was at its highest point for both genders at this time.
The main interest of this study lies in figuring out if the difference in higher education between genders indeed does have a big impact on relative gender unemployment, and if the relationship between those two variables differs in the years 2007 and 2016. It is important to examine the regional (municipal level) unemployment rates and educational levels because a national perspective can be too broad in certain cases. It is easier to make the wrong assumptions about the state of the country when using such terms, so using a regional perspective to see the differences within Sweden is more appropriate when investigating the finer details of Swedish society. As will be discussed in the Literature Review, areas can differ just as much regionally as nationally. Municipalities are both socially and economically diverse, so the regional viewpoint is important to examine.
4
2 Literature Review
The literature and research in this paper cover the subject of gender, educational and regional differences in unemployment. More specifically, how relative gender unemployment is influenced by these factors. The relevance of the studies is motivated by various forms of research in relevant fields.
2.1 Gender Differences and Unemployment
Previous research that has gathered information regarding gender differences has mainly been focused on labour participation and unemployment. The research that has been done regarding unemployment has mostly covered topics on the U.S. and its higher unemployment rate, examples being Johnson (1983) and Niemi (1974). Johnson (1983) and Niemi (1974) provides studies regarding unemployment differentials in the united states in the period 1970-1980. They exemplify that women across time has had a higher unemployment rate due to many reasons. The three factors most likely to be responsible for the relatively high unemployment rate for women are: high level of frictional unemployment due to movement in and out of the labour force, a relative lack of training and cyclical layoffs.
Due to the ever-narrowing gap of inequality between men and women in the U.S., the focus on studies within unemployment differences have become less prevalent. However, some studies have included differences between men and women, in terms of both unemployment and education. Azmat, Güelloch and Manning (2006) investigates the difference in gender unemployment within OECD countries. The study is built on panel data at an individual level and the results are based on analysis regarding in- and out-flow from unemployment. The main factors that explain the unemployment differences are human capital as well as the labour market institutions in place (minimum wages and trade unions). Since labour market institutions are similar across Sweden, this is not a relevant variable to discuss. Human capital, in the form of educational level differences between men and women, is relevant however and will be discussed.
Some studies have also investigated the change in relative gender unemployment over time. Albanesi and Şahin (2013) investigates the gender unemployment gap in the U.S. from 1948 to 2010. The study shows that women had a higher unemployment rate until 1980. After that,
5
the gap between gender unemployment became narrower, with the exception of recessions, where the unemployment rate for men has generally been higher than that of women. Since this development has stabilized in that way, the authors imply that the difference in unemployment has a structural form. To investigate this structural behavior, they have created a model to test for different hypotheses involving education, labour extension, and the structure of the economy. The results of this study show that the educational aspect has a great impact on the narrowing of the gap in gender unemployment. This means that a higher educational level decreases the chance of being unemployed. Regarding the skill-based labour that results from more education, the concept of “Skill-Biased Technical Change” has to do with the shift in the production technology that favors skilled (e.g. more educated, more able, and more experienced) over unskilled labor (Violante, 2008). That is, industries develop methods that require more skills, such as digital and mechanical advancements. These evolutions are beneficial to those that have higher competencies. The changes witnessed in those situations are structural. Structural changes do not come without their share of costs, and those costs often include a high and persistent unemployment (Zagler, 2009).
The question regarding recessions - and why men have a higher level of unemployment compared to women in that stage - can be explained in part by gender specialization within the labour market. This means that women have often dominated professions that need a higher form of education (e.g. health care and education), and in a recession these types of occupations do not suffer the same effect that a more male-dominated industry (e.g. construction and factory jobs) would (Albanesi and Şahin, 2013). Sahin, Song, and Hobijn (2010) also concludes that the large unemployment gap is a result of a higher unemployment inflow rate for men. That higher rate is thought to reflect the deterioration of male-dominated industries during the recession.
In addition to male-dominated industries, young men and women are apparently more adversely affected during an economic downturn. According to the Swedish Public Employment Service (2017), the unemployment rate of young men and women between the ages of 18 and 24 was particularly higher than the average unemployment rate of all men and women. The study showed a significantly higher unemployment rate for younger men (13.6%) compared to younger women (8.6%) in the same category. Verick (2009) finds that young men are hit hardest during a recession. The study was measured for the “Big 5 crisis” and represents Spain, Norway, Finland, Japan and Sweden. The results showed that both young
6
men and women had a higher unemployment rate compared to middle-age men. In the wake of the present downturn, young men have been particularly affected, which has been driven by a range of factors including the high share of young men in heavily impacted sectors such as construction. Bellante and Links (1981) suggest that the employment is greater in the public sector than in the private sector. According to their study, an individual's degree of risk aversion is a crucial factor when it comes to employment in public vs. non-public sectors.
Another reason for the higher unemployment level for youths could be the lack of experience and skills; this results in a lower amount of jobs, and in turn a higher unemployment level arises (Johnson and Kneebone, 1991).
2.2 The Effect of Education on Unemployment
According to studies about education, unemployment is higher within low-education labour than in high-education labour (Albanesi and Sahin, 2013) and the level of education in absolute terms may be less important than relative education attainment (Shimer, 1998). Shimer (1998) continues to argue that an increase in the overall percentage of job seekers with a higher education not only increases competition between other seekers with the same situation, but also puts workers with only a lower education at a disadvantage. Verick (2009) finds that workers with a lower education have a greater chance of being unemployed during financial downturns. Industries that are dominated by low-skilled labour and overrepresented by men, such as the construction sector, are the ones that were most affected after the financial crisis of 2008.
A Dutch study performed by Wolbers (2000) proves the same point regarding the educational level. Here the study implies that women in general terms have a harder time finding jobs. But when looking at highly educated women, they seem to have an advantage compared to men. This indicates that educational level has a significant impact on whether or not an individual manages to get a job. Mincer (1991) finds that a higher educational level is effective in decreasing the unemployment risk for men and women. A reduction in the incidence of unemployment is considered far more important than a reduced duration of unemployment when creating the educational differentials in unemployment rates. Therefore, the lower incidence of unemployment of more educated workers is due to their greater attachment to the firms employing them, and to the lesser risk of becoming unemployed when leaving the current firm.
7
A study made by Partridge and Rickman (1997) finds that individuals with higher human capital are more likely to adapt with changes in the labour market. Human capital plays an important role in deciding whether men and women either become employed or stay employed in recessions. This means that the educational level has an important role on the demand for labour. Furthermore, Eklund, Karlsson and Pettersson (2015) finds that the educational aspects of unemployment were crucial factors in their study of the 1990 financial crisis. Their results showed that people with a higher educational level had a lower risk of losing their jobs (and therefore becoming unemployed during a recessionary period) when compared to people with a lower educational level.
Borjas (2013) explains the educational aspect of labour as an efficiency / competence question. Labour with a higher educational level will, according to the study, have a higher grade of competence and efficiency, which would result in a more competitive edge. So, a higher education is related to that competitive edge, and people who obtain it should have a lower chance of unemployment. An alternative reasoning in the same study by Borjas (2013) is that higher-education labour does not necessarily have a higher competence and efficiency. However, employers often assume that a higher education leads to more efficiency or competence, which is the reason why they choose to employ those people over individuals with a lower education.
2.3 Regional Differences
When the unemployment level of a country is expressed in aggregated data, a few simplified assumptions are made. The first assumption is that there are no discrepancies within unemployment in the labour market. The second assumption is that individuals in the labour market all react the same way when it comes to structural changes. Hence, it does not matter where in the country a certain person lives or what type of labour group it belongs to. (Elhorst, 2008). However, previous research (Elhorst, 2003) finds that regional differences within a country can be just as big as national differences. This basically means that there is no national labour market and it does not represent the same quantities and characteristics as the whole nation (Noback, Broersma and Van Dijk, 2013). The most accurate result regarding unemployment within a country comes from the ability to break the data down to a regional level. The disparities within a country's regional unemployment are therefore quite normal. The reason for this is that the cost of moving is too high. When the benefit becomes greater
8
than the cost for an individual, it becomes more opportune to move, according to Elhorst (2003).
The regional placement of universities has apparent effects on the local labour markets as well. Regner and Gartell (2002) claims that the decision to establish universities in Sweden was motivated by the fact that a university could contribute to the regional growth. That growth would lead to an increase in the supply of a highly educated labour force, and therefore an increase in the region’s attractiveness for new businesses. If those regions become denser and filled with more human capital, even more growth in the form of knowledge spillover can occur. Jacobs (1969) discusses the impact of knowledge spillovers. A denser area provides knowledge spillovers that are ultimately a result of a variety of different educations, and as a result, different industries. This means that individuals with a higher education most likely will move to denser areas since job opportunities are more abundant and better there. Niebuhr (2003) finds that inhabitants per square kilometer has a significant relationship with unemployment on a regional level. The result of the study showed that higher population density results in a higher unemployment level. According to the study, denser areas tend to have a higher in- and outflow of labor.
Job opportunities are also a part of the regional perspective. One of the biggest and most relevant examinations of the relationship between unemployment and vacancies comes in the form of the Beveridge curve. This curve shows a negative relationship between the two. Beveridge (1944) actually defined full employment as a state where there are slightly more vacant jobs than there are available workers. Individuals with a post-secondary education from a university have a higher possibility of getting a job compared to those without one. (Universitetskanslersämbetet, 2015)
9
3 Methodology
3.1 Hypothesis
According to theory, a high education level has a significant impact on unemployment. This should therefore mean that relative higher education has a significant impact on relative gender unemployment, ceteris paribus. Because of this, the null hypothesis should be that there is a significant effect. To test the theories, the null hypothesis and alternative hypothesis are expressed as following:
· H0 : Relative higher education has a significant effect on relative gender
unemployment.
· H1 : Relative higher education does not have a significant effect on relative gender
unemployment.
3.2 Data
The collected data for this investigation are cross-sectional, where the variables are sampled at two different points in time. The first is the year 2007, which is used as a representation of the economic stability of Sweden before the Great Recession. The other year is 2016, and this year is used as a representation of economic stability after the Great Recession (where the economy has recovered for some time). The data were collected for all 290 municipalities in Sweden. So, there are 290 observations for each year.
To get an overview of what the data set looks like, the descriptive statistics for both the dependent variable (RUNEMP) and variable of interest (HIGHEDU) will be discussed. In the following tables, data for all municipalities are included. If there are any extreme or otherwise noteworthy values for the control variables, then they will also be mentioned.
10
Table 1. Descriptive Statistics (2007 & 2016)
Relative gender unemployment (RUNEMP) has a mean of 0.866 in 2007 and 0.0727 in 2016. This suggests that for the most part, across all municipalities in Sweden, the relative unemployment ratio is smaller than 1 and there are less unemployed women than men. Since this value decreased from 2007 to 2016, it means that the relative value decreased over time. The maximum and minimum in 2007 was 1.702 and 0.167, respectively. Both values being relatively far from 0 indicates that relative gender unemployment in Sweden can stretch from extreme relative male unemployment as well as extreme relative female unemployment.
Relative higher education (RHIGH) has a mean of 1.589 in 2007 and 1.731 in 2016. The fact that the averages for all municipalities are both above and relatively far from 1 suggests that there are more highly educated women than men in most municipalities. The increase from 2007 to 2016 means that there has been an increase in the number of women with a
post-Mean Median Std.dev Max Min
RUNEMP 0.866 0.853 0.226 1.702 0.167 RHIGH 1.589 1.585 0.305 2.452 0.964 RLOW 0.849 0.856 0.074 1.024 0.595 RPUB 3.030 2.969 0.873 5.562 1.014 RUNEMPy 0.800 0.750 0.287 2.333 0.167 VAC 0.034 0.031 0.018 0.120 0.005 POPD 130.718 26.250 441.294 4228.200 0.200
Mean Median Std.dev Max Min
RUNEMP 0.727 0.724 0.179 1.257 0.222 RHIGH 1.731 1.719 0.322 2.729 1.021 RLOW 0.803 0.808 0.062 0.951 0.591 RPUB 2.846 2.847 0.731 4.912 0.756 RUNEMPy 0.621 0.614 0.202 1.857 0.111 VAC 0.055 0.051 0.026 0.240 0.012 POPD 151.088 27.900 545.953 5496.400 0.200 Descriptive Statistics - 2007 Descriptive Statistics - 2016
11
secondary education relative to men, or that there has been a decrease in the number of men with a post-secondary education relative to women. The maximum of 2.452 and minimum of 0.964 in 2007 shows that there are almost no municipalities where there are more highly educated men than highly educated women. In fact, when looking at the 2016 values, one can see that there are NO municipalities where there are more men with a high education than women since the minimum is 1.021.
The control variable Relative public-sector employment (RPUB) has some interesting values that are worth mentioning. The standard deviation is 0.856 in 2007 and 0.731 in 2016, which points to a very wide spread of values across the municipalities. The differences between the maximum and minimum values support that. The data clearly shows that there are many more women than men working in the public sector, and in 2007 this is exemplified by the fact that there are NO municipalities where the opposite is true.
All data is gathered from Statistics Sweden (SCB).
3.3 Model
The following regression model is used to obtain a view of regional differences between men and women:
RUNEMPr = β0 + β1RHIGHr + β2RLOWr + β3RPUBr + β4RUNEMPyr + β5VACr +
β6POPDr + µr
This Linear multiple regression model, through the ordinary least squares method, is run with the data for the years 2007 and 2016. Therefore, there are two sets of data for all municipalities that are being measured individually. In the model, the r subscript represents each region (municipality). The equations are Ordinary Least Squares regression models, with RHIGH being the variable of interest and RLOW, RPUB, RUNEMPy, VAC, and POPD being included as control variables.
The variables that are referred as relative terms in the descriptions are unique because they are ratios that represent the number of women over the number of men, and they are expressed as the division of absolute values. The actual number that is given by this ratio will either be
12
below or above 1, and this depends on which sample group (women or men) has a greater quantity. A value above 1 indicates that the variable in question is larger for women, and a value below 1 indicates that the variable is larger for men.
Here are some examples for clarification: a RUNEMP value of 1.5 (e.g. 150 women divided by 100 men) indicates a higher female unemployment relative to men, and a RUNEMP value of 0.75 (e.g. 75 women divided by 100 men) indicates a lower female unemployment relative to men.
A value of 1 indicates total equality, meaning that the number of unemployed women and men are equal. A value of 0 indicates total inequality, where there are no unemployed women per unemployed men. In municipalities where the explanatory variables are positively related to relative gender unemployment, a higher value of those variables will correspond to a larger relative value (even more women per men). When the explanatory variables are negatively related, a higher value of those variables will correspond with a smaller relative value (even less women per men).
3.4 Model Variables
Relative gender unemployment (RUNEMP)
The dependent variable of this study is Relative gender unemployment at the municipal level. It is estimated as a ratio of the number of unemployed women divided by the number of unemployed men (absolute values). In this case unemployment can be defined as all people age 25 and older who are currently not employed and actively searching for work. The threshold is chosen in order to have the most relevant and logical sample to investigate due to the group of interest being people with different kinds of educational levels.
𝑁𝑢𝑚𝑏𝑒𝑟 𝑜𝑓 𝑢𝑛𝑒𝑚𝑝𝑙𝑜𝑦𝑒𝑑 𝑤𝑜𝑚𝑒𝑛 (𝑎𝑔𝑒𝑠 25+) 𝑁𝑢𝑚𝑏𝑒𝑟 𝑜𝑓 𝑢𝑛𝑒𝑚𝑝𝑙𝑜𝑦𝑒𝑑 𝑚𝑒𝑛 (𝑎𝑔𝑒𝑠 25+)
Relative higher education (RHIGH)
The variable Relative higher education is our variable of interest and refers to all women and men who have a post-secondary education of at least three years in each municipality. This will therefore represent a measure of human capital in each municipality between men and women.
13
The variable is also a ratio, estimated as the number of highly educated women divided by the number of highly educated men (absolute values). It is important to note that the sample does not include people with a post-secondary education of two years or less. The educational level is a key factor when measuring unemployment between men and women since the human capital of an individual affects how desirable he or she is on the labour market.
𝑁𝑢𝑚𝑏𝑒𝑟 𝑜𝑓 𝑤𝑜𝑚𝑒𝑛 𝑤𝑖𝑡ℎ 𝑎 𝑝𝑜𝑠𝑡 𝑠𝑒𝑐𝑜𝑛𝑑𝑎𝑟𝑦 𝑒𝑑𝑢𝑐𝑎𝑡𝑖𝑜𝑛 𝑜𝑓 𝑎𝑡 𝑙𝑒𝑎𝑠𝑡 3 𝑦𝑒𝑎𝑟𝑠 𝑁𝑢𝑚𝑏𝑒𝑟 𝑜𝑓 𝑚𝑒𝑛 𝑤𝑖𝑡ℎ 𝑎 𝑝𝑜𝑠𝑡 𝑠𝑒𝑐𝑜𝑛𝑑𝑎𝑟𝑦 𝑒𝑑𝑢𝑐𝑎𝑡𝑖𝑜𝑛 𝑜𝑓 𝑎𝑡 𝑙𝑒𝑎𝑠𝑡 3 𝑦𝑒𝑎𝑟𝑠
Relative lower education (RLOW)
The variable Relative lower education is linked with the variable Relative higher education because they are both measurements of human capital. However, this variable acts as the first control in the regression. Relative lower education refers to all women and men that only have a secondary education of three years in each municipality. The variable is a ratio estimated as the number of lower educated women divided by the number of lower educated men (absolute values). Again, this does not include those people who have no secondary education, nor does it include people with a secondary education or other vocational training of two years or less.
𝑁𝑢𝑚𝑏𝑒𝑟 𝑜𝑓 𝑤𝑜𝑚𝑒𝑛 𝑤𝑖𝑡ℎ 𝑜𝑛𝑙𝑦 𝑎 𝑠𝑒𝑐𝑜𝑛𝑑𝑎𝑟𝑦 𝑒𝑑𝑢𝑐𝑎𝑡𝑖𝑜𝑛 𝑜𝑓 3 𝑦𝑒𝑎𝑟𝑠 𝑁𝑢𝑚𝑏𝑒𝑟 𝑜𝑓 𝑚𝑒𝑛 𝑤𝑖𝑡ℎ 𝑜𝑛𝑙𝑦 𝑎 𝑠𝑒𝑐𝑜𝑛𝑑𝑎𝑟𝑦 𝑒𝑑𝑢𝑐𝑎𝑡𝑖𝑜𝑛 𝑜𝑓 3 𝑦𝑒𝑎𝑟𝑠
Relative public-sector employment (RPUB)
The variable Relative public-sector employment entails all women and men who work in the public sector on the municipal level. It is calculated by dividing the number of women working in the public sector by the number of men working in the public sector. Therefore, this variable is in relative terms as well. Jobs related to healthcare and education are mainly a part of the public sector, and they tend to have a greater employment chance when compared to non-public sectors. Since the majority of workers in the non-public sector are women (as the data reveals), this should result in a lower relative gender unemployment as well.
𝑁𝑢𝑚𝑏𝑒𝑟 𝑜𝑓 𝑤𝑜𝑚𝑒𝑛 𝑤𝑜𝑟𝑘𝑖𝑛𝑔 𝑖𝑛 𝑝𝑢𝑏𝑙𝑖𝑐 𝑠𝑒𝑐𝑡𝑜𝑟 𝑁𝑢𝑚𝑏𝑒𝑟 𝑜𝑓 𝑚𝑒𝑛 𝑤𝑜𝑟𝑘𝑖𝑛𝑔 𝑖𝑛 𝑝𝑢𝑏𝑙𝑖𝑐 𝑠𝑒𝑐𝑡𝑜𝑟
14
Relative gender unemployment of young people (RUNEMPy)
The variable Relative gender unemployment of young people refers to all the women and men between the ages of 19 and 29 who are currently not employed and actively searching for work. It is like the dependent variable, but it takes a closer look at the younger population. We believe that the variable measuring the young social group of 19 to 29-year-olds is relevant mostly because the unemployment prevalence in the young population is significantly higher than the average unemployment rate. Therefore, the relative gender unemployment of young people is used to control for that disproportionate number of unemployed people.
𝑁𝑢𝑚𝑏𝑒𝑟 𝑜𝑓 𝑦𝑜𝑢𝑛𝑔 𝑢𝑛𝑒𝑚𝑝𝑙𝑜𝑦𝑒𝑑 𝑤𝑜𝑚𝑒𝑛 (𝑎𝑔𝑒𝑠 19 − 29) 𝑁𝑢𝑚𝑏𝑒𝑟 𝑜𝑓 𝑦𝑜𝑢𝑛𝑔 𝑢𝑛𝑒𝑚𝑝𝑙𝑜𝑦𝑒𝑑 𝑚𝑒𝑛 (𝑎𝑔𝑒𝑠 19 − 29)
Share of vacancies (VAC)
Share of vacancies refers to the amount of available jobs in the region divided by the total regional population of people from the ages of 15 to 74. It is reasonable to imagine that the number of vacancies affects unemployment. Depending on whether there is a high or low number of vacant jobs in an area, there will either be a high or low number of opportunities for job searchers. Thus, an area that has very few open positions will beget a higher probability of unemployment.
𝑁𝑢𝑚𝑏𝑒𝑟 𝑜𝑓 𝑎𝑣𝑎𝑖𝑙𝑎𝑏𝑙𝑒 𝑗𝑜𝑏𝑠 (𝑣𝑎𝑐𝑎𝑛𝑐𝑖𝑒𝑠) 𝐿𝑎𝑏𝑜𝑢𝑟 𝑓𝑜𝑟𝑐𝑒 (𝑎𝑔𝑒𝑠 15 − 74)
Population density (POPD)
The Population density variable shows how concentrated or sparse each municipality is in Sweden, and it is measured as the inhabitants per square kilometer. It is a useful measurement to have because the number of people in the same space is a factor that determines the extent of human capital, job opportunities, etc. Since more women than men continue studying in Sweden and there are more options in dense areas, it is likely that there will be an overall lower unemployment rate for women than for men there Expanding on that, a denser area should have a more equal relative gender unemployment because of the diversity of the labour market. That diversity means the areas are not limited to certain sectors. There is no need for us to calculate these values as we did with the previous variables because this data is provided directly from Statistics Sweden.
15
The theories presented in the Literature Review chapter and the descriptions in the Variables section above provide different predictions about the effects of the independent variables on relative gender unemployment. Table 1 provides a summary of the expected signs of the variables based on theory.
Table 2. Abbreviations, definitions, and expected effect of variables
3.5 Method
Relative gender unemployment is examined for all 290 Swedish municipalities in the years 2007 and 2016, using a cross-sectional regression analysis. This is done through an “Ordinary Least Squares” method. Correlations between the dependent variable and independent variables are found and discussed (which include all 290 municipalities). The regressions are run as two different versions in each year. One includes all variables and Population density (POPD) is logged, while the other excludes POPD entirely. Analyses of the regressions are then done to interpret the results. Furthermore, all regressions are tested to detect and avoid problems with multicollinearity, heteroscedasticity and normality.
Abbreviations Definitions Expected effect
RUNEMP (Y) Relative gender unemployment, ages 25+
RHIGH Relative higher education, post-secondary level (at least 3 years) -RLOW Rekative lower education, secondary level only (3 years) + RPUB Relative public-sector employment -RUNEMPy Relative gender unemployment of young people, ages 19-29 +
VAC Share of vacancies
16
4 Empirical Results
4.2 Correlation Analysis
The correlations between the dependent and independent variables for 2007 and 2016 and their significances according to the Pearson method are presented in the table below. All municipalities are included, just like in the previous descriptive statistics section.
Table 3. Correlations between dependent and independent variables
In Table 3, bivariate correlations between the dependent variable RUNEMP and the independent variables are illustrated. The results show that the variable of interest RHIGH is significant in both 2007 and 2016. Just as the variable of interest, the variables RLOW and RUNEMPy are significant in both years. The correlation level of POPD is significant in 2016 but not before, and in the other direction RPUB is significant in 2007 but not after. One of
RHIGH RLOW RPUB RUNEMPy VAC POPD * Significant at 1% level N = 290 DF = 290-2 = 288
Source: Statistics Sweden (SCB) 2018
Relative gender unemployment (RUNEMP) Pearson Correlation
Correlation 2007 Correlation 2016 -0.244* 0.254* 0.297* 0.500* 0.082 0.057 -0.448* 0.470* 0.056 0.574* -0.045 0.255*
17
the independent variables, VAC, has different signs for each year. This could imply that the Great recession that followed 2007 disrupted the normal correlations in some way.
The results show that the overall significance level between RUNEMP and the independent variables has not been different before and after the Great Recession, as 3 variables were significant in both years. The correlation levels between the dependent variable and independent variables have had an overall increase from 2007 to 2016. The variables that had the highest correlation in both observed years was RLOW (0.254, 0.470) and RUNEMPy (0.500, 0.574), with respective numbers representing 2007 and 2016. When the correlation between independent variables was reviewed, the numbers indicated low correlation. This means that there is no multicollinearity between any variables, and this is supported by the “Variance inflation factor” test.
4.3 Regression Analysis
In this section, the results from both the 2007 and 2016 regressions are shown and analyzed. Two different equation forms are used for each year, as mentioned in the Method section. In Equation 1, all variables are included and the last one (POPD) is logged since the values differ greatly among all municipalities. In Equation 2, Population density is removed entirely. This is done because higher education can be highly correlated with population density. Even though the dependent variable in this study measures the differences in higher education (and there was no detected multicollinearity between those variables), it can still be beneficial to exclude it to see what effect its removal has. When checking for non-normality,
heteroscedasticity, and multicollinearity there are no significant problems that could cause bias or make the results misleading.
18
Table 4. Regression Models
The results for Equation 1 (2007) provide the following information. The variable of interest, RHIGH, is significant at the 5 percent level of significance. The negative sign on the coefficient implies that there is a negative relationship between RUNEMP and RHIGH. So, when RHIGH is bigger, RUNEMP tends to be smaller. This therefore means that if relative higher education increases, relative gender unemployment decreases. The control variables RPUB, RUNEMPy, and POPD are significant as well (all at the 5 percent level of significance). All coefficients for these control variables are positive, hence when they are bigger, RUNEMP will also be bigger.
Variables Eq. (1) Eq. (2) Eq. (1) Eq. (2)
Constant 0.496 0.660 0.072 0.208 RHIGH -0.124 -0.233 -0.063 -0.168 (0.0156**) (0.0000**) (0.0873*) (0.0000**) RLOW 0.028 0.109 0.530 0.653 (0.8577) (0.4814) (0.0002**) (0.0000**) RPUB 0.062 0.070 0.020 0.029 (0.0000**) (0.0000**) (0.0844*) (0.0121**) RUNEMPy 0.302 0.319 0.334 0.374 (0.0000**) (0.0000**) (0.0000**) (0.0000**) VAC 0.443 0.479 -0.457 -0.560 (0.4515) (0.4235) (0.1136) (0.0586*) POPD 0.030 - 0.029 -(0.0016**) - (0.0000**) -R² 0.394 0.372 0.524 0.494 Adj R² 0.381 0.361 0.514 0.485 P-values in parathesis ** Significant at 5% level * Significant at 10% level N = 290 for all variables
Source: Statistics Sweden (SCB) 2018
2016 Regression Models 2007 Regression Models
19
In Equation 2 (2007), where population density is removed from the model, all the same variables as in the previous equation are significant. All the coefficients have the same signs as well. However, there is a notable change in the coefficient values. They have become greater, indicating that there is a stronger relationship between these independent variables and the dependent variable RUNEMP. By looking at the R2, we can see that the independent
variables have generally become less explanatory of the dependent variable. The variable of interest RHIGH is both more significant (at 5 percent) and has a much stronger relationship with RUNEMP.
Now the results for the 2016 regression models are discussed. The change from 2007 to 2016 is an aspect that will covered here as well.
In Equation 1 (2016) the variable of interest RHIGH is significant at the 10 percent level of significance for this year. A notable change from 2007 is that this variable’s relationship with RUNEMP has become weaker. Hence, relative higher education has less of a relation with the relative gender unemployment than before. Interestingly, RLOW, the control variable that was previously insignificant, is now highly significant. Just like the 2007 regressions, RPUB, RUNEMPy, and POPD are once again significant with the same coefficient signs. However, VAC has become negative. It is still insignificant, but now this means that relative gender unemployment will be smaller when the share of vacancies is greater. The meaning behind this shift will be discussed further in the discussion chapter. The R2 is now 0.524, suggesting
that the data are a better fit to the regression line than in 2007.
The last regression model, Equation 2 (2016), also provides some interesting results. In this model POPD is removed yet again. Now the variable of interest RHIGH is highly significant, and its negative relationship with RUNEMP is stronger than in the previous model. An interesting quality of this model is that all the variables are now significant, so VAC is also significant for the first time (at the 10 percent level).
20
5 Discussion
The null hypothesis in this investigation states the following: Relative higher education has a significant effect on relative gender unemployment. Since relative higher education is significant in all 4 regressions, it is clear to see that we cannot reject the null hypothesis. This means that relative higher education had a significant effect in both 2007 and 2016.
When looking at relative higher education, the variable of interest, it is clear that there is a negative relationship with relative gender unemployment in both 2007 and 2016. The variable is also significant in all cases (4 out of 4). Combining the results from the descriptive statistics with the regression models gives an overview to interpret. In most of the Swedish municipalities, there are more women with a post-secondary education as well as a lower number of unemployed women than men. The data indicate that when relative higher education goes up, there is a negative effect on relative gender unemployment. The regression results clearly coincide with theories regarding unemployment and human capital as well as previous research within this topic (Mincer, 1991; Albanesi and Şahin, 2013). The relationship between unemployment and a higher education is applicable to relative gender unemployment and the relative higher education relationship as well. The reasoning behind that being that if the relative higher education increases (which favors women), relative gender unemployment decreases (which favors women).
As mentioned in the introduction, an interesting take-away from the data set is that 24 out of 290 municipalities had a higher relative female unemployment in 2016. 12 out of those are located in the Stockholm area. Those municipalities also had relative higher education values that were lower than other areas, meaning the education difference was not as big as all the regions overall. These places are relatively dense, and people with a higher education tend to be drawn to denser areas. There are more job opportunities in those areas, and hence a greater extent of knowledge spillovers (Jacobs, 1969). Since denser areas provide a diverse selection of sectors and industries, the differences between men and women will not be as extreme.
Relative higher education clearly favors women in both 2007 and 2016. In 2007 there were only 3 municipalities (Danderyd, Linkoping and Karlsborg) where more men than women had a higher level of education. In the post-recession period of 2016, all municipalities had RHIGH values over 1, meaning that there was not a single municipality where there were
21
more men with a post-secondary education than women. This is proven through the minimum value of RHIGH in the descriptive statistics section as well (Table 2). So, what does this indicate? Well, even though relative gender unemployment has decreased over time, in exceptions like recessions, male unemployment tends to go up (Albanesi and Sahin, 2013). If the Great Recession caused structural changes in the labour market, it would explain why relative gender unemployment decreased from 2007 to 2016 (See Table 2). As mentioned in the Literature Review, possible examples of such changes could be the new advantages that skilled people had when the workplace criteria increased (Violante, 2008) and the deterioration of male-dominated sectors in the aftermath of a recession (Sahin, Song & Hobijn, 2010). At the same time, relative higher education increased. This means that there were now even more women than men with a higher education. If more women than men were actively furthering their educations, it is reasonable to think that this increase was just as important as the other factors mentioned in explaining the lower relative gender unemployment.
The second part of the purpose was to see if the effect differed before and after the Great recession. From the regression results one can see that the effect of RHIGH on RUNEMP became smaller from 2007 to 2016. This diminished negative relationship can be due to many reasons. RLOW became highly significant in 2016, and its positive relationship with RUNEMP was very strong with a coefficient of 0.530 in Equation 1 (Table 4). It is not unreasonable to think that the mean value of RLOW decreased from 2007 to 2016 (0.849 to 0.803) because low-skilled jobs became even more popular for the male population after the stabilization of the economy had happened. While the economy was strong in 2007, the recovery from an economic shock like the Great recession could have made the 2016 period even stronger and more secure. This is perhaps why relative higher education had less of an impact compared to other factors that relate to relative gender unemployment.
All control variables, except for VAC and RPUB, are consistent with the theories and they correlate with relative gender unemployment in the predicted ways. That is why those two exceptions are discussed in further detail. First share of vacancies (VAC) will be covered. An interesting observation in the regression analysis is the shifting sign for vacancies from 2007 to 2016. In 2007 the slope coefficient for the variable had a positive sign, meaning that the share of vacancies was positively related to relative gender unemployment. So, if the share of vacancies went up, relative gender unemployment increased (more women per men). But after the Great Recession something happened. In 2016 the coefficient shifted from positive to
22
negative, meaning that a higher number of vacant jobs in society corresponded with a smaller relative gender unemployment (less women per men). Since there was a higher overall education requirement for jobs in the aftermath of the recession, it is reasonable that the greater number of highly educated women would be able to get the vacant jobs. This would therefore result in a lower relative unemployment.
The second variable to discuss is relative public-sector employment (RPUB). Interestingly enough, this variable appears to be positively related to relative gender unemployment. While previous research regarding public sector labour indicates that its workers are less likely to be unemployed (Bellante and Links, 1981; Albanesi and Sahin, 2013), the regressions tell us otherwise. From the descriptive statistics (Table 2), the mean, maximum and minimum have all clearly decreased from 2007 to 2016. This indicates that more men have moved from non-public to non-public jobs for a more risk-averse work environment. That assumption coincides with what Bellante and Links (1981) found regarding risk in those sectors.
23
6 Conclusion
In Sweden, there is a clearly observable difference in relative gender unemployment. This is seen on a national level, but even bigger disparities are seen on the municipal level. According to the theories surrounding unemployment and its gender differences, there are several factors that affect relative gender unemployment. Human capital (in the form of a higher education and lower education), employment sectors (public versus non-public), employment of young people, the amount of job opportunities (vacancies), and the concentration of inhabitants tend to have major effects.
This paper investigates the effect of the regional relative higher education on the regional relative gender unemployment in all municipalities of Sweden. A sample of control variables that are based on theory are included to account for other factors that explain the dependent variable. Ordinary Least Squares regressions are run for both 2007 and 2016, to see if relative higher education differs in the pre- and post-recession periods. While there are many studies on national relative gender unemployment, this paper investigates the regional differences of Sweden specifically. The data collected for each municipality is gathered from Statistics Sweden (SCB).
The results show that both the extent of relative gender unemployment and what side it favors can differ significantly. However, most municipalities have a ratio that is lower than 1. In 2007 there were 75 out of 290 municipalities where more women than men were unemployed. In 2016 that number was only 24. From that data alone, one can see that something happened to lower the unemployment for women and/or raise unemployment for men. The beta values show that relative gender unemployment of young people (RUNEMPy) has the strongest relationship with relative gender unemployment in this study. This is of course unsurprising because the variables are very similar, with the explanatory one controlling for a sample of the dependent variable. But that indicates that unemployment numbers for young people account for a big portion of the total unemployment gap that is being investigated. The variable of interest, relative higher education, clearly showed a significant effect on relative gender unemployment. In regions where RHIGH is higher, relative gender unemployment will be smaller – indicating that there are even less unemployed women per men. The effect of relative higher education is proven to have an effect both theoretically and empirically.
24
In conclusion, while it is clear that many different variables affect relative gender unemployment, the disparity between the number of women and men with a higher education (relative higher education) certainly has its own share of influence. Women tend to have both a lower unemployment and a higher education across the majority of municipalities in Sweden. In the comparison between two periods of stability (2007 before the downturn and 2016 after the downturn), the results showed that the effect of relative higher education did indeed differ. The coefficient in 2007 had a greater negative value than in 2016. Hence, it had a smaller effect on relative gender unemployment, and other variables were likely more prominent in 2016.
For future research, it might be beneficial to include different types of educations as a variable to see what women and men tend to specialize in. This was not included in this study because we were mainly focused on the impact of relative higher education on relative gender unemployment. To get an even more nuanced study, that aspect could be included if the data is available.
25
7 Bibliography
Albanesi, S., Sahin, A. (2013). The Gender Unemployment Gap. (Staff Report No. 613). Retrieved from Federal Reserve Bank of New York:
https://www.newyorkfed.org/medialibrary/media/research/staff_reports/sr613.pdf
Bellante, D., Link, A. (1981). Are public sector workers more risk averse than private sector workers?. Industrial and Labor Relations Review, 34(3), 408-412.
Beveridge, W. H. (1944). Full Employment in a Free Society. Great Britain: George Allen & Unwen Ltd.
Borjas, G. J., (2013). Labor Economics. New York: McGraw-Hill Education.
Elhorst, J. (2008). A spatiotemporal analysis of aggregate labour force behaviour by sex and age across the European Union. Journal of Geographical Systems, (10), 167-190.
https://doi.org/10.1007/s10109-008-0061-9
Elhorst, J. (2003). The Mystery of Regional Unemployment Differentials: Theoretical and Empirical Explanations. Journal of Economic Surveys, 17(5), 709-748.
https://doi.org/10.1046/j.1467-6419.2003.00211.x
Eklund, E., Karlsson, P., Pettersson, L. (2015). Arbetslöshet, vakanser och utbildning. (Research Report Series No. 2015-1). Retrieved from Jönköping International Business School: http://ratio.se/app/uploads/2015/10/slutversion-arbetsloshet-vakanser-och-utbildning.pdf
Holmlund, B. (2009). The Swedish unemployment experience. Oxford Review of Economic Policy, 25(1), 109-125.
Jacobs J. (1969) The Economy of Cities. New York: Vintage Books.
Johnson, J.L. (1983). Sex Differentials in Unemployment Rates: A Case for No Concern. Journal of Political Economy, 91(2), 293-303. https://doi.org/10.1086/261144
Johnson, J. A., Kneebone, R. D. (1991). Deriving Natural Rates of Unemployment for Sub-national Regions: The Case of Canadian Provinces. Applied Economics, 23(8), 1305-1314.
Mincer.J. (1991). Education and unemployment of women. (Working Paper No. 3838). Retrieved from the National Bureau of Economic Research: http://www.nber.org/papers/w3838.pdf
Niebuhr, A. (2003). Spatial Interaction and Regional Unemployment in Europe. European Journal of Spatial Development, No. 5, 1 – 26.
Niemi, B. (1974). The Female-Male Differential in Unemployment Rates. Industrial and Labor Relations Review, 27(3), 331-350.
Noback, I., Broersma, L. & Van Dijk, J. (2013). Gender-Specific Spatial Interactions on Dutch Regional Labour Markets and the Gender Employment Gap. Regional Studies, 47(8), 1299-1312.
26
Partridge, M., Rickman, D. (1997). The Dispersion of US State Unemployment Rates: The Role of Market and Non-market Equilibrium Factors. Regional Studies, 31(6), 593-606.
Regnér, H., Gartell, M. (2002). Arbetsmarknaden för högskoleutbildade. inkomstutveckling och geografisk rörlighet under 1990-talet. (Rapport 2002). Retrieved from Sveriges Akademikers Centralorganisation (SACO):
https://www.saco.se/globalassets/saco/dokument/rapporter/2002_arbmhogskoleutb.pdf Sahin, A., Song, J., & Hobijn, B. (2010) The Unemployment Gender Gap during the 2007 recession. Current issues in Economics and Finance, 16(2), 1-7.
Shimer, R. (1998). Why is the U.S. Unemployment Rate So Much Lower?. NBER Macroeconomics
Annual, 13, 11-61.
Statistics Sweden. (2017). Arbetslösheten tog fart under finanskrisen. Retrieved February 20, 2018, from
https://www.scb.se/hitta-statistik/sverige-i-siffror/samhallets-ekonomi/arbetslosheten/ Statistics Sweden. (2017). Var fjärde i Sverige är högutbildad. Retrieved February 11, 2018, from
https://www.scb.se/hitta-statistik/sverige-i-siffror/utbildning-jobb-och-pengar/befolkningens-utbildning/
Swedish Public Employment Service. (2017). Stora skillnader i arbetslöshet mellan unga kvinnor och män. Retrieved April 13, 2018, from
https://www.arbetsformedlingen.se/Omoss/Pressrum/Pressmeddelanden.html?id=424F93 DDD18DA86E
Universitetskanslersämbetet (2015). Universitet och högskolor. (Årsrapport 2015:8). Retrieved from
http://www.uka.se/download/18.12f25798156a345894e4ae8/1487841868714/arsrapport-2015.pdf
Universitetskanslersämbetet (2017). Universitet och högskolor. (Årsrapport 2017:8). Retrieved from
https://www.uka.se/download/18.667441fa15af4fb7b21126b3/1497612948871/arsrapport -2017.pdf
Verick, S. (2009). Who Is Hit Hardest during a Financial Crisis? The Vulnerability of Young Men and Women to Unemployment in an Economic Downturn. (IZA Discussion Paper No. 4359). Retrieved from Institute of Labor Economics (IZA):
https://www.econstor.eu/bitstream/10419/35874/1/612362876.pdf
Violante, G.L. (2008). Skill-biased Technical Change. Retrieved from the Centre for Economic Policy and Research (CEPR):
http://citeseerx.ist.psu.edu/viewdoc/download?doi=10.1.1.577.3936&rep=rep1&type=pdf Wolbers, M.H.J. (2000). The Effects of Level of Education on Mobility between
Employment and Unemployment in the Netherlands. European Sociological Review, 16(2), 185-200.
Zagler, M. (2009). Economic growth, structural change, and search unemployment. Journal of Economics, 96(1), 63-78.
27
Appendix
1.1
RUNEMP RHIGH RLOW RPUB RUNEMPy VAC POPD
RUNEMP 1 -0.244 0.254 0.297 0.500 0.082 0.057 RHIGH -0.244 1 -0.221 0.306 -0.003 -0.065 -0.355 RLOW 0.254 -0.221 1 0.193 0.230 0.081 0.132 RPUB 0.297 0.306 0.193 1 0.297 -0.136 -0.192 RUNEMPy 0.500 -0.003 0.230 0.297 1 0.141 0.028 VAC 0.082 -0.065 0.081 -0.136 0.141 1 0.160 POPD 0.057 -0.355 0.132 -0.192 0.028 0.160 1 Correlation Table - 2007
RUNEMP RHIGH RLOW RPUB RUNEMPy VAC POPD
RUNEMP 1 -0.448 0.470 0.056 0.574 -0.045 0.255 RHIGH -0.448 1 -0.296 0.316 -0.292 -0.080 -0.363 RLOW 0.470 -0.296 1 0.214 0.313 0.042 0.181 RPUB 0.056 0.316 0.214 1 -0.053 -0.074 -0.186 RUNEMPy 0.574 -0.292 0.313 -0.053 1 0.027 0.233 VAC -0.045 -0.080 0.042 -0.074 0.027 1 0.072 POPD 0.255 -0.363 0.181 -0.186 0.233 0.072 1 Correlation Table - 2016