Linköping University | Department of Physics, Chemistry and Biology Bachelor´s Thesis, 16 hp | Master of Science in Chemical Biology Spring term 2016 | LITH-IFM-x-EX—16/3178--SE
Method Development for
Determining the Stability of Heat
Stable Proteins Combined with
Biophysical Characterization of
Human Calmodulin and the Disease
Associated Variant D130G
Ehlimana Aleckovic, Linnea Andersson, Sherley Chamoun,
Ellen Einarsson, Ebba Ekstedt, Emma Eriksen, Maria
Madan-Andersson
Examinator, Magdalena Svensson Tutor, Cecilia Andrésen
Datum
2016-05-26
Avdelning, institution
Division, Department
Department of Physics, Chemistry and Biology Linköping University
URL för elektronisk version
ISBN
ISRN: LITH-IFM-G-EX--16/3178--SE
_____________________________________________________________
Serietitel och serienummer ISSN
Title of series, numbering ______________________________
Språk Language Svenska/Swedish Engelska/English ________________ Rapporttyp Report category Licentiatavhandling Examensarbete C-uppsats D-uppsats Övrig rapport _____________ Titel
Method Development for Determining the Stability of Heat Stable Proteins Combined with Biophysical Characterization of Human Calmodulin and the Disease Associated Variant D130G
Författare
Ehlimana Aleckovic, Linnea Andersson, Sherley Chamoun, Ellen Einarsson, Ebba Ekstedt, Emma Eriksen, Maria Madan-Andersson
Nyckelord
Calmodulin, wild type, D130G variant, method, affinity, trifluoperazine, p-HTMI.
Sammanfattning
Calmodulin is a highly conserved calcium ion binding protein expressed in all eukaryotic species. The 149 amino acid residues in the primary structure are organized in seven α helices with the central highly flexible α helix connecting the two non-cooperative domains of calmodulin. Each domain contains two EF-hand motifs to which calcium ions bind in a cooperative manner, hence the binding of four calcium ions saturate one calmodulin molecule. In the cardiovascular area calmodulin is involved in the activation of cardiac muscle contraction, and mutations that arise in the genetic sequence of the protein often have severe consequences. One such consequential mutation that can arise brings about the replacement of the highly conserved aspartic acid with glycine at position 130 in the amino acid sequence. In this research, the thermal and chemical stability within the C domain of the D130G variant of human calmodulin was investigated using a new method only requiring circular dichroism spectroscopic measurements. Affinity studies within the C domain of the D130G variant of human calmodulin were performed using fluorescence spectroscopy. The ligands chosen for the affinity studies were trifluoperazine and p-HTMI. All analytical experiments were performed with the C domain of wild type human calmodulin as a reference. From the new method, it was concluded that the C domain of the D130G variant of human calmodulin has a slightly decreased stability in terms of Tm and Cm values compared to the C domain of wild type human calmodulin. The affinity analyses indicated that neither trifluoperazine nor p-HTMI discriminates between the C domain of the D130G variant of human calmodulin and the C domain of wild type human calmodulin in terms of dissociation constants. The pivotal outcome from this research is that the new method is applicable for determination of the stability parameters Tm and Cm of heat stable proteins.
Abstract
Calmodulin is a highly conserved calcium ion binding protein expressed in all eukaryotic species. The 149 amino acid residues in the primary structure are organized in seven α helices with the highly flexible central α helix connecting the two non-cooperative domains of calmodulin. Each domain contains two EF-hand motifs to which calcium ions bind in a cooperative manner, hence the binding of four calcium ions saturate one calmodulin molecule. In the cardiovascular area calmodulin is involved in the activation of cardiac muscle contraction, and mutations that arise in the genetic sequence of the protein often have severe consequences. One such consequential mutation that can arise brings about the replacement of the highly conserved aspartic acid with glycine at position 130 in the amino acid sequence. In this research, the thermal and chemical stability within the C domain of the D130G variant of human calmodulin was investigated using a new method only requiring circular dichroism spectroscopic measurements. Affinity studies within the C domain of the D130G variant of human calmodulin were performed using fluorescence spectroscopy, and the ligands chosen for this purpose were trifluoperazine and p-HTMI. All analytical experiments were performed with the C domain of wild type human calmodulin as a reference. From the new method, it was concluded that the C domain of the D130G variant of human calmodulin has a slightly decreased stability in terms of Tm and Cm
values compared to the C domain of wild type human calmodulin. The affinity analyses indicated that neither trifluoperazine nor p-HTMI discriminates between the C domain of the D130G variant of human calmodulin and the C domain of wild type human calmodulin in terms of dissociation constants. The pivotal outcome from this research is that the new method is applicable for determination of the stability parameters Tm and Cm of heat stable proteins.
Acronyms and Abbreviations
CaM Intact human calmodulin
CaMwt C domain of wild type human calmodulin
CaMD130G C domain of the D130G variant of human calmodulin
Ca2+ Calcium ion
LCO Luminescent conjugated oligothiophene
p-HTMI Pentameric luminescent conjugated oligothiophene TFP Trifluoperazine
ANS 8-Anilinonaphthalene-1-sulfonic acid
GuHCl Guanidinium hydrochloride CaBP Calcium ion binding protein GANTT Project schedule chart rpm Revolutions per minute IEC Ion exchange chromatography GFC Gel filtration chromatography SEC Size exclusion chromatography cv Column volume
SDS-PAGE Sodium dodecyl sulphate-polyacrylamide gel electrophoresis CD Circular dichroism
L-CPL Left-handed circularly polarized light R-CPL Right-handed circularly polarized light pET29b(+) Expression vector
BL21-Gold (DE3) E-coli bacteria strain
IPTG isopropyl-β-D-thiogalactopyranoside E.coli Escherichia coli
LB Luria-Bertani broth
Tm Transition midpoint temperature
Tm(GuHCl) Transition midpoint temperature in the presence of GuHCl
Tm(H20) Transition midpoint temperature in water
Cm Transition midpoint concentration
∆"# $%&'( Enthalpy at a transition midpoint temperature in the presence of GuHCl pI Isoelectric point
DichroWeb Analyzing tool for CD spectroscopic measurements
CDSSTR Analysis program for quantitative and graphical estimation of secondary structure content
Table of Contents
1. Introduction ... 6
1.1 Aim ... 6
1.2 Background ... 6
2. Theory ... 8
2.1 Calmodulin – Structure and Function ... 8
2.2 Ion Exchange Chromatography ... 10
2.3 Gel Filtration Chromatography ... 11
2.4 SDS-PAGE ... 11
2.5 Circular Dichroism Spectroscopy ... 11
2.5.1 The CDSSTR Analysis Program ... 13
2.6 Fluorescence Spectroscopy ... 13
2.7 Protein Stability ... 15
2.7.1 Protein Stability in Terms of Thermodynamics ... 15
2.7.2 Measures of Protein Stability ... 17
2.8 Ligands ... 18
2.8.1 Trifluoperazine ... 18
2.8.2 p-HTMI ... 19
3. System and Process ... 20
3.1 Flow Plan ... 20
3.2 Risk Analysis ... 21
4. Experimental Procedures ... 23
4.1 Ethical Statement ... 23
4.2 Protein Expression and Purification ... 23
4.7 Circular Dichroism Measurements ... 24
4.7.1 Method ... 24
4.10 Affinity Studies ... 26
4.8 Protein Structure Modelling ... 26
5. Results ... 27
5.1 Process Analysis ... 27
5.2 Experimental Results ... 28
5.2.1 Ion Exchange Chromatography ... 28
5.2.2 Size Exclusion Chromatography ... 29
5.2.3 Protein Amount ... 30
5.2.4 Secondary Structure Determination Using CD Spectroscopy ... 30
5.2.5 Stability Analyses Using CD Spectroscopy ... 32
5.2.6 Calmodulin and TFP ... 35
5.2.7 Calmodulin and p-HTMI ... 35
5.2.8 Structure Analysis with PyMOL ... 36
6. Discussion ... 37
6.2 Experimental Results ... 38 6.4 Future Prospects ... 39 7. Conclusion ... 40 8. Acknowledgements ... 41 9. References ... 42 Appendix 1 ... 46 1.1 Solutions ... 46
Protein Expression and Purification ... 46
Circular Dichroism Measurements ... 46
Affinity Studies ... 47
1. Introduction
1.1 Aim
The aim of this research is to investigate the possibility to develop a method for determining the thermal as well as chemical stability of heat stable proteins. The representative proteins of choice in this research are therefore the heat stable C domain of the D130G variant of human calmodulin and the C domain of wild type human calmodulin. In addition, changes regarding biophysical characteristics within the C domain of the D130G variant of human calmodulin will be investigated with respect to the C domain of wild type human calmodulin.
Circular dichroism spectroscopy will be used to monitor the secondary structure of the C domain of wild type and D130G variant of human calmodulin, whereas fluorescence spectroscopic experiments will be performed in terms of investigating differences between the C domain of wild type and D130G variant of human calmodulin regarding ligand affinities.
1.2 Background
Essential for understanding the structure and function of proteins is the knowledge of the key aspects of their stability [1]. The structural integrity of a particular protein is maintained
exclusively within its specific thermal span, outside of which denaturation and consequent loss of function occurs [2]. The transition midpoint temperature (Tm) of a protein is a measure of its
thermal stability; a physical parameter enabling stability comparison between different proteins, or between single site mutants and their corresponding wild type [3,4].
Calmodulin (CaM) is a highly stable Ca2+ binding protein expressed in all eukaryotic species [5].
In the cardiovascular area CaM is essentially involved in the activation of cardiac muscle contraction, which together with its evolutionary preservation speaks for its important
physiological role [6]. CaM consists of two domains (the N- and C domain) connected through a highly flexible linker. CaM adopts an elongated structure prior to the non-cooperative binding of a target protein, reflecting the fact that the domains are mutually independent as regards other activities as well [7]. Each domain is composed of two helix-turn-helix super secondary
structures commonly termed EF-hand motifs. The turn connecting the helices in each of the four EF-hand motifs (EF1, EF2, EF3, and EF4) forms a loop that accounts for the binding of one Ca2+, hence a total of four Ca2+ saturates one CaM molecule [8]. Seven sites in the Ca2+ binding loop, preferably provided by the negatively charged side chains of aspartate and glutamate, together chelate the Ca2+ ion, inducing a conformational change exposing the hydrophobic pocket to which the target substrates of CaM bind. Hence, the cooperative binding of Ca2+ activates CaM [8,9,10]. CaM fulfilling such fundamental functions along with its preservation throughout evolution has led to the belief that mutations would be lethal to the extent that no living
individuals would be afflicted. However, genetic studies have recently uncovered de novo CaM mutations, one such resulting in Long QT syndrome (LQTS). LQTS is a heart condition caused by one of three known variants of CaM, termed CaM D96V, CaM D130G, and CaM F142L,
respectively [6]. LQTS is characterized by a delayed repolarization of the heart upon polarization, resulting in an increased risk for lethal heart arrhythmias [11]. Although all three aforementioned variants are associated with LQTS, the focus will in this research be on CaM D130G (CaMD130G),
a variant in which the mutation is located in the fourth EF-hand motif of CaM. In CaMD130G,
aspartate at position 130 in the amino acid sequence, one of the seven contributors to the Ca2+ chelation in EF4, has been replaced with a glycine residue [8,9]. Therefore, it is believed that CaMD130G has an altered affinity for Ca2+, and although the phenotypes are well studied, the
actual effect of the mutation on stability and binding properties of CaMD130G are yet to be
unraveled.
The aforementioned fact that the N- and C domains of CaM are non-cooperative in the aspect of binding target proteins implies that studies on the domains can be pursued separately [7]. This is imposed in this study, as all experiments will be pursued only on the C domain of human CaM. Therefore, the terms wild type CaM (CaMwt)and CaMD130G will hereafter refer exclusively to the
C domain of human CaMwt and human CaMD130G, respectively, whereas the term CaM will refer
to the intact wild type calmodulin present in homo sapiens.
A factor that may be affected by the altered ability of CaM to bind Ca2+ is the stability of CaM
[12]. Denaturation can occur as a result of various factors, such as temperature and impact from various chemical compounds. By using circular dichroism spectroscopy to detect the changes in secondary structure content at increasing temperature, a transition midpoint temperature (Tm
-value) for CaMwt as well as for CaMD130G can be obtained. The obtained Tm-values can then be
used to draw a conclusion regarding the effect on stability [3].
However, due to the high stability of CaMwt and CaMD130G it may be difficult to measure their
respective thermal stability in a conventional manner [11]. It can therefore be useful to combine a chemical and thermal denaturation process by measuring the thermal induced change of
secondary structure content in the presence of different concentrations of denaturant with the aim of calculating a Tm and Cm value. As the mutation in CaMD130G brings about the replacement of an
aspartate to a glycine residue, which directly affects the Ca2+ chelation thereby preventing the formation of the stable structure of CaMwt, it is expected that the mutation should, if anything,
decrease the stability.
Proceeding from the stability measurements, a biophysical characterization of CaMD130G and
CaMwt in terms of ligand affinities will also be explicated. The reduced ability of CaMD130G to
bind Ca2+ leads to the inquiry of how this fact is reflected in the exposure and functionality of the aforementioned binding of substrates to the hydrophobic pocket of CaM. Ligand affinities will therefore be compared between CaMD130G and CaMwt, and the ligands chosen for this approach
are trifluoperazine (TFP) and p-HTMI.
TFP is a strong CaM antagonist, which belongs to the phenothiazine class of pharmaceutical agents. The obstruction of active CaM to interact with its target proteins prevents the stimulatory effects otherwise evoked by active CaM molecules [13]. It is therefore very intriguing to
p-HTMI is another ligand of which there is great interest to investigate. p-HTMI is a Luminescent Conjugated Oligothiophene (LCO), which is a class of conjugated polymers acquiring the ability of identifying the conformational state of biomolecules. The concept of LCOs has been developed at Linköping University and in the aspect of monitoring biological events, neither CaMwt nor CaMD130G has ever been used.
As conjugated polymers acquire an optically sensitive conformation, LCOs can provide the possibility to investigate the biochemical activity of various biological events [14].
The affinity of TFP and p-HTMI for CaMwt and CaMD130G can be studied with fluorescence
spectroscopy. By increasing the ligand concentration over time and measuring the corresponding fluorescence intensity, values of the dissociation constant (Kd) for CaMwt and for CaMD130G can
be determined and potential differences between CaMwt and CaMD130G regarding ligand affinity
can be revealed.
As the D130G mutation affects the binding of Ca2+ to CaM, which is cardinal for further binding of CaM to its downstream targets, it is expected that the affinity for both TFP and p-HTMI is decreased [15].
2. Theory
2.1 Calmodulin – Structure and Function
CaM belongs to the Ca2+ sensor group of calcium ion binding proteins (CaBPs), hence the presence of Ca2+ is essential for its activity [8]. Ca2+ are involved in a vast array of cellular
functions including muscle contraction, cell differentiation, proliferation, apoptosis, and in dysregulation-related cases, cancer. The intracellular concentration of Ca2+ is maintained at approximately 0,1 µM in the absence of stimuli, such as extracellular signaling molecules, intracellular messenger molecules, or membrane depolarization [8]. As a result of the
extracellular influx of Ca2+ through voltage dependent Ca2+ channels [5], or alternatively, upon the release of Ca2+ from the sarcoplasmic- or endoplasmic reticulum, the intracellular
concentration of Ca2+ is increased to approximately 10 µM. CaM binds Ca2+ at a stoichiometric relationship of 1:4, having an affinity for Ca2+ in the µM range.
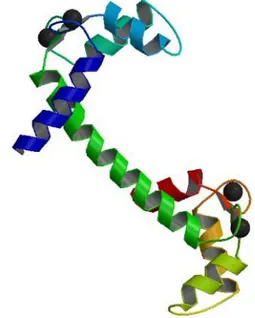
CaM is a relatively small ubiquitous protein, containing only 149 amino acid residues. These interact to form seven α helices, six of which are organized in two structurally similar domains, the N and C domain.
As visualized in green in figure 1, the two domains are linked by an eight-turn α helix, which is highly flexible, resulting in a
dumbbell-shaped tertiary structure. Within the CaM domains, the C terminus of one α helix is linked to the N terminus of a subsequent ) helix through a 6- or 9 residue non-helical region. The 6 residue non-helical regions serve as linkers between adjacent α helices, whereas the 9 residue non-helical regions form 75 percent of a 12 residue Ca2+ chelation loop [5].
Ca2+ are visualized as black spheres in figure 1. The Ca2+ chelation loop can, in an alternative nomenclature, be termed as an EF-hand motif - a helix-turn-helix super secondary structural Ca2+ binding unit.
CaM contains four EF-hand motifs in total, termed EF1, EF2, EF3, and EF4. This eventuates in the presence of two EF-hand motifs in each domain of the CaM molecule [8]. The C and N domains of CaM bind two Ca2+ each through strong electrostatic interactions with seven
negatively charged side-chain oxygen atoms per EF-hand motif [5]. Consequently, EF-hand motifs have a distinguishable preference for carboxylate amino acid residues such as aspartate and glutamate. However, aspartic acid residues have a more substantial contribution to the chelation of Ca2+ as compared to glutamic acid residues, reflecting the preference of EF-hand motifs for residues with less bulky side chains [8].
Within the 12 residue Ca2+ chelating loops, electrostatic interactions between the negatively charged side-chain oxygen atoms of residues 1, 3, 5, 7, 9, and the two negatively charged oxygen atoms of the glutamic acid at position 12, coordinate Ca2+ within each EF-hand motif,
preferentially in a pentagonal bipyramidal fashion [9].
Two Ca2+ bound within a domain of CaM are separated by a distance of 11 Å due to the
continuous pair-formation between EF-hand motifs. The pair-formation between EF-hand motifs within the C-and N domain respectively, result in the packing of amphipathic helices, forming a so called four-helix bundle super secondary structure containing a hydrophobic pocket [8]. More specifically, the hydrophobic pockets of CaM are formed between helices 2 and 3 as well as between helices 4 and 5 [5].
Figure 1. A secondary structural visualization of calmodulin refined at 2,2 Å resolution. Ca2+ ions are represented as black
The binding of Ca2+ to the respective domains of CaM takes place in a cooperative manner, as binding of one Ca2+ facilitates binding of the second. Two bound Ca2+ to each EF-hand motif
within a domain cause alterations in interhelical angles, resulting in a conformational change exposing the hydrophobic pocket of the domain. That is, CaM undergoes a transition from a ‘closed’ to an ‘open’ state, rendering it activated [10]. In the presence as well as in the absence of Ca2+, CaM acquires an elongated conformational structure, with the highly flexible central alpha-helix connecting the non-cooperative N- and C domain of CaM [7]. Upon activation, the exposed hydrophobic pockets of the CaM molecule bind to and activate a wide variety of enzymes and structural proteins [10].
Active CaM acquires a compact globular structure upon binding downstream targets. Even though there is a wide variety of CaM effectors, activated CaM bind its targets with relatively high affinities, with dissociation constants in the nanomolar range [17]. Activated CaM binds each target molecule in a distinct manner, involving both hydrophobic and hydrophilic
interactions. CaM in the absence of Ca2+ can bind some target proteins. However, metal ions are absolutely required to enable CaM to act as an enzymatic regulatory subunit in vitro [5].
2.2 Ion Exchange Chromatography
Ion exchange chromatography (IEC) is a purification method used for the separation of molecules on the basis of their net surface charge. The net surface charge of proteins is pH dependent as amino acids, containing amine (-NH2) and carboxylic acid (-COOH) functional groups, are the
building blocks of proteins.
Separation based on the net surface charge of proteins is achieved by reversible electrostatic interactions between charged groups and oppositely charged media. A positively charged medium (anion exchanger) will bind proteins at pH above their isoelectric point (pI) and a negatively charged medium (cation exchanger) will bind proteins at pH lower than their pI [18]. The ion exchange medium is packed into a column comprising a matrix of spherical particles. The spherical particles are either positively or negatively charged due to the presence of ionizable functional groups on the immobile matrix, being either porous or non-porous. The porous
matrices provide an internal surface area resulting in high binding capacity, whilst non-porous matrices enable high resolution separations and are preferred when diffusion effects are to be avoided [18].
Prior to the separation process, the medium is equilibrated with buffer, which is selected to enable the binding of proteins to the ion exchange medium as well as to enable the elution of impurities. When the sample is added onto the column, proteins having a compatible net surface charge adhere to the column, whilst molecules not having a compatible net surface charge are eluted.
The proteins adhered to the column are eluted on the basis of increasing net surface charge by increasing the ionic strength of the buffer or by changing the pH [18].
2.3 Gel Filtration Chromatography
Gel filtration chromatography (GFC) is one type of size exclusion chromatography (SEC), a method used to separate proteins, peptides, and oligonucleotides on the basis of size.
GFC utilizes an aqueous mobile phase and a hydrophilic stationary phase to enable separation, fractionation or measurement of the molecular weight distribution of soluble molecules. The hydrophilic stationary phase consists of cross-linked pore-containing gel particles usually in bead form.
When a sample is applied to the column, packed with the stationary phase, smaller molecules are able to enter the pores resulting in a longer migration path as compared to larger molecules, which are restricted to the outer space of the porous beads. Consequently, molecules are separated on the basis of decreasing size [19,20,21].
2.4 SDS-PAGE
Sodium dodecyl sulphate-polyacrylamide gel electrophoresis (SDS-PAGE) is a method used to analyze the purity of an isolated protein. The method also enables determination of the
monomeric molecular weight of a protein [4].
The principle of the technique is to separate proteins according to their molecular weight by applying a protein sample on a polyacrylamide gel under the influence of an electric field. The electric field enables the migration of proteins through the gel at different speeds according to their molecular weight. By comparing the protein sample to a reference ladder the molecular weight of the protein can be estimated [4].
Sodium dodecyl sulphate is a negatively charged detergent that binds to proteins and thereby eliminates the effect of the native conformation and charge of the proteins on the separation [4].
2.5 Circular Dichroism Spectroscopy
Circular Dichroism (CD) is the difference in absorbance of left-handed circularly polarized light (L-CPL) and right-handed circularly polarized light (R-CPL) [22]. As can be seen in figure 2, circularly polarized light can be viewed as two vectors of equal length tracing out circles. One of the vectors rotates clockwise (R-CPL) whereas the other rotates counterclockwise (L-CPL). When optically active molecules interact with light, absorption of R-CPL and L-CPL occurs unequally which results in the alteration of the vector lengths. Consequently, the vectors post absorption are no longer of equal length. Further rotation of the unequally long R-CPL and L-CPL vectors result in the tracing out of an ellipse, and thus the light is said to be elliptically polarized. CD can therefore be expressed in molar ellipticity, [θ], or the difference in absorbance between L-CPL and R-CPL, ΔA [23].
CD spectroscopy is a spectroscopic technique used to measure the CD of molecules over a range of wavelengths [22]. The measured CD signal can be either positive or negative depending on whether the molecule mainly absorbs L-CPL (negative CD signal) or R-CPL (positive CD signal).
CD spectroscopy is extensively used to study optically active molecules of all types and sizes. However, the most important application of CD spectroscopy is found in the study of chiral biological macromolecules. CD spectroscopy provides kinetic, structural, and thermal
information about a molecule, but the primary use is in analyzing the secondary structure content in macromolecules, such as proteins. CD can also be used to monitor the pH or thermal induced change in secondary structure content [22].
CD in different ranges of the ultra violet (UV) spectrum, commonly termed far UV (170-260 nm) and near UV (320-260 nm), reflect different aspects of protein
structure. CD in the far UV range reflects secondary structure content, whereas CD in the near UV range reflect the tertiary structure of the protein. However, CD is most commonly monitored in the far UV range to analyze the secondary structure content of proteins. Characteristic CD spectra in the far UV range can be seen in
figure 3. In addition, CD spectroscopy in
the visible range of the electromagnetic spectrum monitors metal ion-protein interactions [25,26].
Figure 2. A schematic picture of a CD spectroscopic instrument. The light is polarized and then separated into R-CPL and L-CPL. The vectors passing through the CD active medium are unequally absorbed, and the differences are further identified with a detector [24].
Figure 3. CD spectra of samples with representative conformations. α-rich proteins show negative bands at 222 nm and 208 nm and a positive band at 193 nm. β-rich proteins have negative bands at 218 nm and positive bands at 195 nm [26,27].
2.5.1 The CDSSTR Analysis Program
Monitoring the CD of a protein in the far-UV range, as previously mentioned, generally reflects its secondary structure content. Quantitative estimation of the secondary structure content with the protein CD spectra as input is generally implemented with an analytical program, such as SELCON 3, CONTIN, CONTINLL, VARSLC or CDSSTR. Each analysis program uses a different reference set of 15 to 33 proteins having a good representation of α-rich, β-rich, and mixed αβ proteins, denatured proteins being included as well [28].
The CDSSTR analysis program originates from the VARSLC analysis program, where the variable selection and singular value decomposition techniques are combined. In the variable selection technique, an initial database of proteins with known CD spectra and secondary structure content is selected followed by the systematic elimination of some protein spectra resulting in new, reduced databases [29]. Proteins possessing characteristics not reflected in the input protein spectra as well as proteins not possessing characteristics reflected in the input protein spectra are systematically eliminated [30,31]. The secondary structure content is further assessed by decomposing singular values in each reduced dataset. The outcome from the singular value decomposition of each reduced dataset compatible with the three basic selection criteria for a good fit is averaged, resulting in an algorithmic fit. The singular value decomposition algorithm assigns secondary structure [29]. Combining the variable selection and singular value
decomposition techniques has led to great improvements in the estimation of protein conformation.
The main disparity between VARSLC and CDSSTR is that CDSSTR requires only eight reference proteins for a good fit to be performed, and that a minimum number of solutions fulfilling the selection criteria for a good fit are subjected to another selection rule based on the helical content. The average of all solutions satisfying the selection rules is the final fit [28]. CDSSTR performs the most accurate secondary structure fits, and in some cases, where other algorithms fail to analyze proteins. CDSSTR is therefore a good choice of program for the graphical as well as quantitative estimation of secondary structure content [30,31].
2.6 Fluorescence Spectroscopy
Fluorescence spectroscopy is an optical detection technique based on the fluorescence of
molecules. When molecules are exposed to electromagnetic radiation, a photochemical process is initiated.
Electromagnetic radiation, which classical physics treats as waves, also display characteristics of particles, known as photons. Planck’s law, E=hѵ shows that each photon has its own specific energy. The energy of a photon is denoted as E, with ѵ being the oscillation frequency of the photon and h is Planck´s constant. The oscillation frequency determines at what wavelength the photon oscillates in accordance with the relationship λ=c/ѵ, c being the speed of light in vacuum. By combining Planck´s law and the relationship λ=c/ѵ, the equation E=hѵ =hc/ λ is obtained. The previously mentioned equation visualizes the importance of the properties of the incident
Figure 4. Molecular orbital energy levels for organic molecules [33].
Figure 5. HUMO, highest unoccupied molecular orbital and LUMO, lowest unoccupied molecular orbital. Each electron is represented as a red arrow and the direction reflects the internal spin.
light. Depending on the light source the photons will contain different energies leading to different effects on the exposed molecule [33].
Schrödinger equation describes how the quantum state of a system changes with time. The solution to Schrödinger´s equation is called the wave function *, which contains all the dynamic information about the system it describes. By solving the Schrödinger equation for electrons, displaying both particle and wave-like features, in accordance with the constraints on the wave function certain acceptable solutions along with their corresponding energies will be obtained. This exclusive permission of some solutions and their corresponding energies reflect the quantization of electrons within atoms.
The wave function for one electron in an atom is referred to as an atomic orbital. When a molecule is exposed to electromagnetic radiation, it will exclusively absorb photons of specific energies, leading to a change in the electron distribution [33].
If the energy contained in the photon is equal to the gap between two energy levels, the absorption will cause a formation of an electronically excited state. In organic molecules the transition occurs between orbitals and in principle there are six types of
electronic transitions, with different energy levels as can be seen in figure 4.
Two important orbitals are usually involved, termed HUMO – highest unoccupied molecular orbital and
LUMO – lowest unoccupied molecular orbital shown in figure 5. Each energy level can be occupied by two electrons with opposite spin, illustrated as upwards and downwards-pointing
arrows in figure 5. When an electron is excited to a higher energy level, the spin remains unaltered retaining the net spin quantum number at zero [33].
Due to the higher energy state of the molecule, the electrons will recede to a lower, more stable energy level. The excess energy is then released resulting in emitted light [32].
A fluorescence spectrophotometer is used to detect emitted light. The spectrophotometer is equipped with a Xenon lamp, being the light source, and an excitation monochromator with an elliptical mirror. The excitation monochromator with the elliptical mirror ensures efficient collection of wavelengths. The reflective surface of the elliptical mirror also keeps all wavelengths focused on the slit, which in turn regulates the amount light focused onto the sample, leading to more detailed results. Before reaching the sample, the light goes through a photodiode reference detector that measures the intensity as a function of time and wavelength. The ray is then focused onto a cuvette containing the sample of interest inducing excitation of electrons. The emitted light will be scattered in all directions and some light will go through an emission monochromator, followed by a transducer detecting the emitted light located 90 degrees from the xenon lamp. In fluorescent spectrometry the emitted light always has less energy than the absorbed light due to energy losses to vibrations or internal conversions [34].
When using fluorescence spectroscopy, it is crucial to have a label for detection. When studying proteins with this method, it is suitable to use naturally fluorescent amino acids. Aromatic rings have a tendency to absorb light at a specific wavelength range due to their conjugated π-electrons [35]. The aromatic amino acids tyrosine and tryptophan are thus commonly used for detection purposes with absorption wavelengths of 277 nm and 280 nm respectively [36].
By monitoring the change in fluorescence intensity of a protein-containing sample at a specific wavelength, it is possible to draw conclusions regarding biophysical characteristics when adding ligands or other types of molecules. Fluorescence spectroscopy is a highly sensitive and selective analytical technique and is therefore widely applied throughout the scientific field.
2.7 Protein Stability
The tertiary structure of a protein is formed by the interaction between amino acid residues widely separated in the primary structure. In other words, specifying the tertiary structure of a protein is analogous to specifying its three-dimensional structure.
The stability of the three-dimensional structure of a protein is dependent of the interactions governing its formation. Such interactions include hydrogen bonds between secondary structures of the protein, disulfide bridges, van der Waals interactions, electrostatic interactions, and
hydrophobic interactions [4].
2.7.1 Protein Stability in Terms of Thermodynamics
Proteins acquire their specific tertiary structure, which is determined by the primary structure, spontaneously. The protein fold contains both favorable and unfavorable interactions. However, for the protein fold to be stable, the cumulative effect of the favorable interactions must outweigh the cumulative effect of the unfavorable interactions.
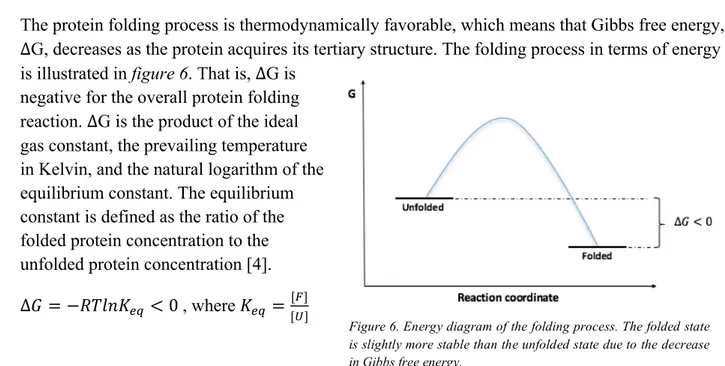
The protein folding process is thermodynamically favorable, which means that Gibbs free energy, ∆G, decreases as the protein acquires its tertiary structure. The folding process in terms of energy is illustrated in figure 6. That is, ∆G is
negative for the overall protein folding reaction. ∆G is the product of the ideal gas constant, the prevailing temperature in Kelvin, and the natural logarithm of the equilibrium constant. The equilibrium constant is defined as the ratio of the folded protein concentration to the unfolded protein concentration [4]. ∆+ = −./01234 < 0 , where 234 = [9]
[;]
Disulfide bridges are strong covalent bonds between the thiol groups of cysteines, contributing to the overall protein stability. However, the disulfide bridges, and covalent bonds in general, are strong enough to remain intact when the protein is unfolded unless detergents able to break covalent interactions are present. Therefore, disulfide bridges contribute equally to the stability of the folded- and unfolded state of the protein in the absence of such detergents. The factors
governing protein stability are consequently mainly considered to be non-covalent interactions. The non-covalent interactions include hydrogen bonds between secondary structures of the protein, van der Waals interactions, hydrophobic interactions, and electrostatic interactions [4]. As the protein folds to form its native state, the disorder of the polypeptide chain decreases, which translates into a decrease in entropy, ∆< < 0. The decrease in entropy is therefore a factor favoring the unfolding process, which means that it works against the formation of the tertiary structure of the protein.
Hydrophobic interactions give rise to the burial of hydrophobic side chains in the interior of the protein, resulting in the exposure of hydrophilic side chains on the protein surface. The
surrounding water molecules consequently become less ordered leading to the increase in entropy. Therefore, entropic contributions favoring the folding process of the protein include hydrophobic interactions.
Enthalpic contributions favoring the protein folding process include hydrogen bonds and electrostatic interactions.
The cumulative effect of both enthalpic and entropic contributions favoring the protein folding process must outweigh the conformational entropy favoring the unfolding process in order for the folding process to take place. In other words, the protein folding process is required to be
thermodynamically favorable [4].
Figure 6. Energy diagram of the folding process. The folded state is slightly more stable than the unfolded state due to the decrease in Gibbs free energy.
2.7.2 Measures of Protein Stability
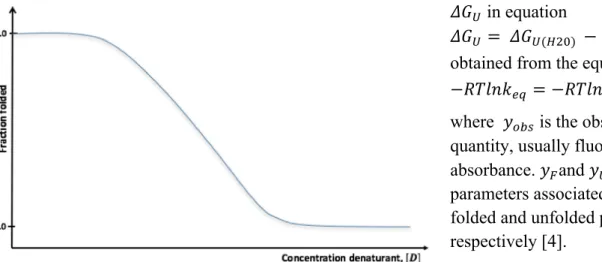
The stability of a protein can be elicited by measuring the change in ellipticity as the protein unfolds at increasing temperature. The Tm value
is the temperature at which the native protein concentration is equal to the unfolded protein concentration, which is obtained from the thermal
unfolding curve shown in figure 7 [3]. The thermal stability of proteins in terms of Tm values can be compared
only if all measurements have been performed identically [4].
An alternative method is to measure changes in fluorescence as the protein unfolds at increasing concentrations of denaturant. From such measurements a transition midpoint concentration (Cm)
can be calculated.
The Cm value, in analogy with the Tm value, is the concentration denaturant at which the native
protein concentration is equal to the unfolded protein concentration.
In the approach of comparing homologous proteins or single site mutants, this method provides a valid means of comparing protein stabilities.
The equation =+; = =+;(&?@) − B34[C] can be used to estimate relative protein stabilities of related proteins at zero denaturant concentration in terms of Cm values [4]. =+;represents the free
energy associated with the unfolding process in the presence of denaturant and
=+;(&?@) represents the free energy associated with the unfolding process in the absence of denaturant. The B34 constant reflects the association between protein and denaturant and high values of this constant indicate a sharp transition between folded and unfolded states of the protein. [C]denotes the concentration denaturant. The Cm value is further assessed from the
x-axis intercept, indicating the toleration of the protein for the specific denaturant. The higher the Cm value, the higher the tolerance for the denaturant [4].
Figure 7. Thermal unfolding curve. The Tm -value can be estimated in the
=+; in equation =+; = =+;(&?@) − B34[C] is obtained from the equation =+ = −./01D34 = −./01(EFGEHIJ
EHIJGEK),
where LMNO is the observed quantity, usually fluorescence or absorbance. L9and L;are
parameters associated with the folded and unfolded protein, respectively [4].
Figure 8. Chemical denaturation curve.
The parameters L9, L;, and LMNO are obtained from a chemical denaturation curve illustrated in
figure 8.
2.8 Ligands
2.8.1 Trifluoperazine
TFP is a phenothiazine classified antipsychotic drug commonly used to treat mental disorders such as schizophrenia. It is known that TFP binds to CaM with the resulting effect being an antagonistic disruption of the association between CaM and its protein targets [13]. The two-dimensional molecular structure of TFP is shown in figure 9. The binding affinity of TFP for CaM is proved to be decreased in the absence of Ca2+, which speaks for the importance of the Ca2+ induced conformational change of CaM
2.8.2 p-HTMI
p-HTMI is a Luminescent conjugated oligothiophene (LCO). LCOs are highly emissive molecules and are capable of staining cells without affecting the cell’s viability [14]. Their main purpose is found in using them as optical dyes for identification and characterization of various biomolecules. LCOs are generally constituted of a
thiophene backbone of some specified length with side chains designed to provide each LCO with specific binding preferences. p-HTMI is a pentameric LCO and the side chains contain methylated imidazoles of positive charge. The molecular structure of p-HTMI is presented in
figure 10. In its unbound state, p-HTMI occupies a flexible structure, but becomes restricted upon
binding. The conjugated backbone of LCOs renders them fluorescent and thereby suitable as biomolecular probes [14].
LCOs can discriminate various types of cells by binding cellular targets unequally, but the exact mechanism of this occurrence is presently unclear and still an ongoing area of research [14].
3. System and Process
3.1 Flow Plan
An initial flow plan, seen in figure 11, was composed to provide an overview of the different tasks in the project, showing the estimated time for the tasks as well as the deadlines in the project.
3.2 Risk Analysis
A risk analysis, shown in table 1 was made to enlighten different risks throughout the project. The probability and the consequence was estimated for each risk and a risk factor value was calculated as the product of probability and consequence.
Risk Probability (P) (1-5) Consequence (C)(1-5) Risk Factor (P*C) (1-25)
Prevention and correction
Equipment malfunctions
4 2 8 Follow the equipment manuals carefully.
If possible, use other equipment. Prioritize other measurements and make a new plan for remaining activities.
Loss of protein sample
3 5 15 Mark the samples properly, read the lab
manual carefully. If possible, use backup sample. Otherwise consult with the steering group.
Low final concentration of protein
1 4 4 Be thorough in the purification process.
Prioritize protein analyses. (e.g. focus on 1 ligand)
Inactive protein
3 5 15 Be thorough in the purification process.
Take sample from another group or take backup sample.
Contaminated protein sample
3 5 15 Be thorough when handling the protein.
If possible, purify the protein sample once again. Not enough time to perform all necessary analytical experiments
4 4 16 Plan all the experiments thoroughly and
make sure in advance that we have sufficient time.
Prioritize protein analyses.
Ambiguous results from protein analyses
3 3 9 Be sure to label and handle samples
properly.
Perform the specific experiment again for better understanding.
Technical malfunctions
2 2 4 Store all the documents on the group
drive and on your own computer to secure important data.
If problems with computer programs ask Table 1. Risks during the project, estimated risk factors and strategies for prevention and correction
mentor for help.
Ligand does not bind
3 3 9 This is a result and is not something we
should prevent.
A backup ligand is available.
Illness 3 4 12 Have a resource for each scheduled
task.
Make up a plan to catch up with the schedule.
Work from home. Doctors
appointment
3 2 6 Have a resource for each scheduled
task.
Work from home. Plan ahead. Activities
outside of the project
4 2 8 Have a resource for each scheduled
task.
Work from home. Plan ahead. Conflicts
within the group
4 3 12 Have an open dialog within the group
throughout the project.
Look to the group contract to see how to best solve a conflict.
4. Experimental Procedures
4.1 Ethical Statement
The BL21-Gold(DE3) strain of E.Coli used in this study is derived from an attenuated bacterial strain and does not normally colonize the human intestine. BL21-Gold(DE3) E.Coli are neither human nor animal pathogens and lack the ability to produce pathogenic quantities of toxins rendering them impotent to act infectious [38].
The genetically modified bacteria were handled in accordance with good industrial hygiene and safety practices, stipulated in the prevailing safety policies at Linköping University. Subsequent to the completion of the experimental procedures, all vessels that had been in contact with bacteria were autoclaved and the antibiotic kanamycin was sent to destruction.
Studies regarding identification of mutations as well as the diagnostication of resulting lethal genetic diseases may lead to ambiguous ethical statements, from which conflicts regarding obscured course of medical action may arise. Identification of mutations as well as the
diagnostication of resulting lethal genetic diseases might interfere with individual rights in the aspect of denied privileges, such as healthcare and life insurance. Method development for determining the stability of heat stable proteins as well as identification of alterations regarding biophysical characteristics using CaMwt and CaMD130G as model proteins does not cause conflicts
of the kind previously mentioned, which is why this research dissociates from ambiguous ethical statements causing such disputes.
4.2 Protein Expression and Purification
The genetic sequence encoding CaMD130G was cloned into pET29b(+). Recombinant CaMD130G
was further expressed in BL21-Gold(DE3) E.Coli. The cells were briefly grown in Luria-Bertani (LB) medium containing kanamycin (30 µg/mL), prior to induction with
isopropyl-β-D-thiogalactopyranoside (IPTG) (0.5 mM), and incubated at 37 °C. 3 h post induction, the cells were harvested by centrifugation (3000 rpm for 40 minutes at 4 °C) in an IEC DPR-6000 centrifuge. The resulting pellet was resuspended in resuspension buffer (See Appendix) and 1 M HCl. The cells were lysed by sonication. The obtained lysate was centrifuged (10000 g for 40 minutes at 4 °C) in a Sigma® 6-16 K centrifuge. The protein solution was buffer exchanged into dilution buffer (See Appendix) and filtered with a 45 µm filter. The HiTrap Q Sepharose FF 5x5 mL column was equilibrated with 5 column volumes (cv) (25 mL) of equilibration buffer (See
Appendix). The filtered protein solution was loaded onto the column and eluted with a linear
gradient from 0-30% elution buffer (See Appendix) over 25 cv. The eluted fractions were collected in a 96 well plate. The purity of the 63-90 mL elution was then investigated by SDS-PAGE. Pure fractions containing CaMD130G were pooled in a CentriPrep concentration tube and
concentrated by centrifugation (2500 g for 40 minutes at 4 °C) in a Sigma® 6-16 K centrifuge. The HiLoad 16/60 Superdex 75 column was equilibrated with 1 cv (120 mL) of running buffer. The protein sample was loaded onto the column and the flow rate was set to 1 mL/min. The
column was run with 1 cv of running buffer. The eluted fractions were collected in a 96 well plate. The purity of the 75-90 mL elution was then investigated by SDS-PAGE. Pure fractions containing CaMD130G were pooled in a CentriPrep concentration tube and concentrated by
centrifugation (2500 g for 40 minutes at 4 °C) in a Sigma® 6-16 K centrifuge.
The protein concentration was further determined by UV spectrophotometry with the IMPLEN P330 Nanophotometer using a molar extinction coefficient at 280 nm of 2980 (cm M)-1 [39].
4.7 Circular Dichroism Measurements
All CD measurements were performed with the Chirascan Applied Photophysics
spectrophotometer using a 0.4 cm path length cuvette. CD was measured on both CaMwt (4 µM in
1 mL 20 mM Bis-Tris, 20 mM CaCl2, dist-H20, pH 7.1) and CaMD130G (4 µM in 1 mL 20 mM
Bis-Tris, 20 mM CaCl2, dist-H20, pH 7.1) in the far-UV (190-260 nm) range to determine the
secondary structure. Quantitative estimation of the secondary structure content of both CaMwt and
CaMD130G was performed with the analysis program CDSSTR in the wavelength range 190-240
nm.
The change in secondary structure was further monitored in the temperature interval 16-94 °C on both CaMwt (8 µM in 1 mL 20 mM Bis-Tris, 20 mM CaCl2, dist-H20, pH 7.1) and CaMD130G (8
µM in 1 mL 20 mM Bis-Tris, 20 mM CaCl2, dist-H20, pH 7.1) at 222 nm. The change in
secondary structure was also monitored in a non-conventional manner, applying the approach of performing thermal denaturation in the presence of the denaturant GuHCl. CD measurements in the temperature interval 16-94 °C on both CaMwt (8 µM in 1 mL 20 mM Bis-Tris, 20 mM CaCl2,
dist-H20, pH 7.1)and CaMD130G (8 µM in 1 mL 20 mM Bis-Tris, 20 mM CaCl2, dist-H20, pH 7.1)
at 222 nm were performed at four different GuHCl concentrations, spanning the interval 0.5-1.5 M. Thermal stability measurements in the presence of GuHCl were performed with the aim of developing a method for determining true transition midpoint temperatures (Tm(H2O)) and Cm
values of heat stable proteins.
4.7.1 Method
The thermal denaturation curves obtained from the thermal stability measurements in the
presence of GuHCl were evaluated for transition midpoint temperatures (Tm(GuHCl)) and enthalpies
at Tm(GuHCl) (∆Hm(GuHCl)) with the software program CDpal. However, prior to the evaluation, the
change in heat capacity at constant pressure (∆Cp) was set to 0 J/mol·K, assuming ∆Cp of the
protein remains constant during the unfolding process. The assessed Tm(GuHCl) values as a function
of GuHCl concentration were fitted to linear equations and extrapolated to 0 M GuHCl. The y-axis intercept of the extrapolated lines was further interpreted as /#(&QR).
The assessed ∆Hm(GuHCl) values were used for the calculation of theoretical transition midpoint
concentrations (Cm) at 25 °C. Following equations were used:
Δ" /? = Δ" /T + YQΔVWX/ YZ {1} ∆< /? = ∆< /T + ∆'[ Y X/ YQ YZ {2} ∆+ = ∆" − /∆< {3}
In equations {1} and {2}, T1 was taken to be Tm(GuHCl), T2 was taken to be T, and ∆Cp was taken
to be constant, giving the following equations: Δ" / = Δ" /#($%&'() + YY ΔVWX/
\(]^_`a) = ∆" /# $%&'( + ∆VW∙ (/ − /# $%&'( ) {4}
∆< / = ∆< /#($%&'( + ∆'[ Y X/ = ∆< /# $%&'( + ∆VW∙ 01 Y Y\(]^_`a) Y Y\(]^_`a) {5}
At any transition, when the concentration folded protein is equal to the concentration unfolded protein, ∆G = 0 J/mol in accordance with equation ∆+ = −./01[c][d]. Equation {3} can thus be rearranged into
∆"(/# $%&'( = /# $%&'( ∙ ∆< /# $%&'( ↔ ∆< /# $%&'( = ∆&(Y\ ]^_`a)
Y\(]^_`a) {6}
By inserting equation {4} and {5} in equation {3}, the following equation is obtained: ∆+ = ∆" /# $%&'( + ∆VW∙ / − /# $%&'( − / ∙ (∆< /# $%&'( + ∆VW∙ 01Y Y
\ ]^_`a) {7}
By further applying equation [6] in equation [7], and upon additional rearrangements, following equation is obtained:
∆+ / = ∆"# $%&'( 1 −Y Y
\ ]^_`a − ∆VW[ /# $%&'( − / + / ∙ 01
Y
Y\ ]^_`a] {8}
Equation {8} enables the calculation of ∆G at any temperature, T. As it was previously mentioned, ∆Cp was assumed to be 0 J/mol·K and T was taken to be 25 °C (298.15 K). By
applying this, equation {8} can be rearranged into the following equation: ∆+ 298.15 2 = ∆"# $%&'( 1 −Y?lm.Tn o
\ ]^_`a {9}
Equation {9} was further used for the calculation of ∆G corresponding to each GuHCl concentration. The calculated ∆G values as a function of GuHCl concentration were fitted to
linear equations and extrapolated to ∆+ 298.15 2 = 0 J/mol. The intercept with the x-axis was interpreted as Cm.
4.10 Affinity Studies
All binding studies were performed with the Fluoromax-4 spectrophotometer using a 0.4 cm path length cuvette. The binding of CaMwt and CaMD130G to TFP and p-HTMI was monitored by
measuring the tyrosine-fluorescence in the wavelength range 290-350 nm upon excitation at 277 nm. Each fluorescence measurement was performed three times, of which the average was automatically calculated. The slit width was set to 5 nm.
To assess the affinity for CaMD130G, TFP (0-260 µM) was titrated into a solution of CaMD130G (5
µM in 1 mL 20 mM Bis-Tris, 20 mM CaCl2, pH 7.1). To evaluate the affinity for CaMwt, TFP
(0-120 µM) was titrated into a solution of CaMwt (5 µM in 20 mM Bis-Tris, 20 mM CaCl2, pH 7.1).
To assess the affinity for CaMD130G and CaMwt, p-HTMI (0-27.5 µM) was titrated into a solution
of CaMD130G (5µM in 1 mL 20 mM Bis-Tris, 20 mM CaCl2, pH 7.1)and CaMwt (5µM in 1 mL 20
mM Bis-Tris, 20 mM CaCl2, pH 7.1), respectively.
The resulting affinity curves were fitted to equations applying baseline sloping, resulting in estimated dissociation constants for both CaMwt and CaMD130G. The margin of error for
respective dissociation constant was evaluated using the jackknife method [40].
4.8 Protein Structure Modelling
Using the coordinates of CaMwt as a template, a model for CaMD130G was obtained with
SWISS-modelling [41,42]. An estimation of the secondary structure and three dimensional structure of CaMwt and CaMD130G was further obtained with the molecular graphics system PyMOL [43].
5. Results
5.1 Process Analysis
The initial flow plan seen in figure 11 was updated throughout the project. Some activities were subdivided into smaller tasks whereas other activities were merged. To avoid future delays, the activity ‘determine report structure’ was brought forward. The activity ‘study for exam in project management’ was added to the flow plan, as it was an activity that required time otherwise spent on other project related activities. A significant change in the final flow plan seen in figure 12 is the duration of the activity ‘protein analysis’. More working hours were assigned to this activity due to the time consuming method development as well as encountered difficulties regarding the fluorescence measurements.
Estimations of protein amounts were performed prior to the initiation of the activity ‘protein analysis’ to avoid planning of time consuming analytical experiments that would not be
accomplished due to insufficient amounts of protein. It was estimated that 4 mg CaMD130G would
be sufficient for further experimental analyses. The amount of CaMwt required to collect
reference results was also estimated to 4 mg which in analogy to CaMD130G was sufficient. Figure 12. The final flow plan (GANTT). Sgm is short for steering group meeting.
5.2 Experimental Results
5.2.1 Ion Exchange Chromatography
The prosperity of the separation of CaMD130G with IEC was analyzed by measuring the optical
density at 280 nm of each eluted fraction. A peak in the region 63-90 mL, corresponding to fractions D6-E12 in the 96 well plate, was detected in the resulting chromatogram seen in figure
13. It was further concluded that fractions D6-E12 contained CaMD130G.
The purity of the fractions D6, D5, D4, D3, D1, E2, E4, E6, E8, E9, E10, E11 and E12 was further investigated with SDS-PAGE. The polyacrylamide gel post separation is shown in figure
14. The first well seen in figure 14 was loaded with a reference ladder (See Appendix), hence the
presence of ten thick bands
corresponding to different molecular weights. The band in the lower region of the first well corresponds to a molecular weight of approximately 10 kDa, shown in figure 14. CaMD130G
has a molecular weight of
approximately 8 kDa. Therefore, the thick bands corresponding to each loaded fraction seen in figure 14 most likely reflect the presence of pure CaMD130G.
Figure 13. Chromatogram from IEC. The peak in the region 63-90 mL, corresponding to fractions D6-E12 in the 96 well plate, indicates presence of protein.
Figure 14. Polyacrylamide gel post separation with SDS-PAGE. The bands represent the purity of fractions D6, D5, D4, D3, D1, E2, E4, E6, E8, E9, E10, E11, E12.
5.2.2 Size Exclusion Chromatography
SEC was performed for further assurance regarding the purity of the sample. A peak in the region 75-90 mL, corresponding to fractions E3-E12 in the 96 well plate, was detected in the resulting chromatogram seen in figure 15.
The purity of the fractions E3, E5, E7, E9, E11 and E12 was investigated with SDS-PAGE, and the resulting polyacrylamide gel is shown in figure 16. The thick bands corresponding to each loaded fraction migrated to a height corresponding to approximately 10 kDa and as CaMD130G has
got a molecular weight of approximately 8 kDa, it was concluded that the bands reflected the presence of pure CaMD130G.
Figure 15. Chromatogram from SEC. The peak in the region 75-90 mL, corresponding to fractions E3-E12 in the 96 well plate, indicates presence of protein
Figure 16. Polyacrylamide gel post separation with SDS-PAGE. The bands represent the purity of fractions E3, E5, E7, E9, E11, and E12.
5.2.3 Protein Amount
The protein concentration was determined using a nanophotometer. The resulting concentration was 382,55 µM in a volume of 5 ml, corresponding to a total amount of 15,3 mg CaMD130G.
5.2.4 Secondary Structure Determination Using CD Spectroscopy
The secondary structure of both CaMwt (4 µM) and CaMD130G (4 µM) was monitored in the
wavelength range 190-260 nm using CD-spectroscopy. The obtained ellipticity was further converted to mean residue ellipticity, i.e. a parameter dependent on protein concentration. The resulting CD spectra of CaMwt
and CaMD130G can be seen in figure
17. The negative bands at
wavelengths 208 nm and 222 nm seen in figure 17 reflect high α-helical content. A conclusion that can be drawn from the spectra in
figure 17 is that, CaMwt and
CaMD130G do not differ significantly
as regards secondary structure content.
Quantitative estimation of the secondary structure in CaMwt and
CaMD130G was performed using the
CDSSTR analysis program available on the online server DichroWeb [30,31]. The resulting CDSSTR fit performed on CaMwt
in the wavelength range 190-240 nm was largely identical to the true CD spectra of CaMwt as can be
seen in figure 18.
Figure 17. Far-UV circular-dichroism spectra of CaMwt and CaMD130G. Red
line represents secondary structure content of CaMwt, whereas blue line
represents the secondary structure content of CaMD130G.
Figure 18. CDSSTR fit performed on CaMwt. Blue curve represents the
secondary structure spectra of CaMwt and the red curve represents the fit
The resulting CDSSTR fit performed on CaMD130G in the
wavelength range 190-240 nm was, in analogy to the CDSSTR fit performed on CaMwt, substantially
identical to the true CD spectra of CaMD130G as can be seen in figure
19.
The quantitative estimation of secondary structure in terms of percent is presented in table 2. As the CDSSTR fits performed on CaMwt and CaMD130G, shown in figures 18 and 19, resulted in CD
spectra that were substantially identical to the true CD spectra of CaMwt and CaMD130G, the
obtained quantitative estimation of secondary structure in terms of percent was highly reliable.
Secondary structure CaMwt (%) CaMD130G (%)
α helices 48 48
β strands 11 13
Turns 16 16
Unordered 24 22
Figure 19. CDSSTR fit performed on CaMD130G . The blue curve represents
the secondary structure spectra of CaMD130G and the red curve represents
the fit from the CDSSTR algorithm.
5.2.5 Stability Analyses Using CD Spectroscopy
Thermal stability measurements were performed on both CaMwt (8 µM) and CaMD130G (8 µM) at
222 nm with 1 °C increments in the temperature interval 16-94°C using CD spectroscopy. The ellipticity was measured for 30 seconds at each temperature. The fractional change was obtained by normalizing the ellipticity parameters and was further displayed as a function of temperature. A graphical visualization of the thermal stability measurements can be seen figure 20.
Tm values could not be estimated from the obtained data in figure 20 as it cannot be determined
where the derivative of each curve attains a maximum value. Neither CaMwt nor CaMD130G will
denature in the temperature interval 16-94 °C due to their high thermal stability. Furthermore, the CD spectrophotometer could not establish a temperature above 94 °C. To evade this technical limitation a new method for determining thermal stability was developed. In thismethod, thermal denaturation in the presence of
different GuHCl concentrations was taken into practice. The measurements were performed in the temperature interval 16-94 °C with 2 °C
increments. The ellipticity was measured for 60 seconds at each temperature. The fractional change was obtained by normalizing the ellipticity parameters and was further displayed as a function of
temperature. The resulting thermal denaturation curves are shown in
figures 21.A and 21.B.
Figure 20. Thermal denaturation curves for CaMwt (red squares) and
CaMD130G (blue triangles).
Tm(GuHCl) and ΔHm(GuHCl) values along with their respective jackknife error, presented in table 3
were further obtained by analyzing each thermal denaturation curve in figure 21 with the software program CDpal.
[GuHCl] (M) uv(wxyz{) |u (°C) }yv(wxyz{)|u (kJ/mol) uv(wxyz{)~ÄÅw (°C) }yv(wxyz{)~ÄÅw (kJ/mol) 0.5 80.9±1.1 194.3±10.9 71.1±0.8 153.0±9.7 1.0 73.3±1.3 138.9±9.7 66.3±1.0 102.5±6.7 1.25 70.4±1.3 107.0±6.5 56.0±2.8 95.0±30.9 1.5 63.7±1.3 105.0±8.4 49.4±0.7 76.8±3.5
From the obtained ΔHm(GuHCl) values, ΔG at 25 °C (= 298.15 K) was calculated for each Tm(GuHCl)
value using the equation =+(298.15 2) = ="#($%&'()⋅ (1 −Y?lm.Tn o
\(]^_`a)). As each Tm(GuHCl) value
corresponds to a GuHCl concentration, each calculated ΔG value corresponds to the same GuHCl concentration. The resulting ΔG values are presented in table 4.
[GuHCl] (M) uv(wxyz{) |u (°C) }wÑÖ (J/mol) uv(wxyz{) ~ÄÅw (°C) }w~ÄÅw (J/mol) 0.5 80.9±1.1 30666,5 71.1±0.8 20504.6 1.0 73.3±1.3 19366.0 66.3±1.0 12477.9 1.25 70.4±1.3 14140.2 56.0±2.8 8950.9 1.5 63.7±1.3 12067.3 49.4±0.7 5822.2
The Tm(GuHCl) and ΔG values presented in table 4 were further graphically visualized as functions
of GuHCl concentration and fitted to linear equations. The resulting plots are shown in figures
22.A and 22.B.
Table 3. Tm(GuHCl) and ="B(+Ü"V0)values for CaMwt and CaMD130G at increasing GuHCl concentrations.
To obtain /#(&QR)for CaMwt and CaMD130G, the fitted lines in figure 22.A were extrapolated to 0
M GuHCl. The intercept with the y-axis in figure 22.A corresponds to /#(&QR). To obtain Cm for
CaMwt and CaMD130G, the fitted lines in figure 22.B were extrapolated to ΔG(298.15 K) = 0
J/mol. The intercept with the x-axis in figure 22.B corresponds to Cm. The /#(&QR)and Cm values
were calculated from the linear equations to which the data was fitted. The margin of error for the /#(&QR) values was estimated using monte carlo simulation [44], whereas the margin of error for the Cm values was determined using the jackknife method. The results are presented in table 5.
Equation fitted to Tm(GuHCl) values
uv(yáà) (°C) Equation fitted to
ΔG(298.15 K) values
Cm (M)
CaMwt y = -16,458x + 89,556 89,6 ± 1,8 y = -19254x + 39517 2.1±0.2
CaMD130G y = -21,982x + 84,081 84,1 ± 1,2 y = -14790x + 27653 1.87±0.07
5.2.6 Calmodulin and TFP
The binding of TFP to CaMwt (5 µM) and CaMD130G (5 µM) was monitored by measuring the
tyrosine-fluorescence in the wavelength range 290-350 nm upon excitation at 277 nm. To estimate Kd values, the obtained data was fitted to equations applying baseline sloping. From
these fits, the Kd values 2,84 ± 0,37 µM for CaMwt and 12,88 ± 6,8 µM for CaMD130G were
obtained. The resulting affinity curves are shown in figures 23.A and 23.B.
5.2.7 Calmodulin and p-HTMI
The binding of p-HTMI to CaMwt (5 µM) and CaMD130G (5 µM) was, in analogy to the binding
studies performed with TFP, monitored by measuring the fluorescence of the tyrosines in the wavelength range 290-350 nm upon excitation at 277 nm. The data was further fitted to equations applying baseline sloping in order to estimate Kd values. From these fits, the Kd values 0,51 ±
0,50 µM for CaMwt and 2,08 ± 0,21 µM for CaMD130G were obtained. The resulting affinity
curves are shown in figures 23.C and 23.D.
Figure 23. (A, B) TFP and (C, D) p-HTMI binding curves of (A, C) CaMwt and (B, D) CaMD130G obtained from the
5.2.8 Structure Analysis with PyMOL
The three-dimensional visualization of the secondary structure of CaMwt and CaMD130G in the
presence of Ca2+ does not exhibit any pronounced differences as can be seen in figure 24. However, a conspicuous difference is the absence of one Ca2+, seen in figure 24.B reflecting the reduced ability of CaMD130G to bind Ca2+.
Hydrophobic regions of CaMwt and CaMD130G are visualized in red in figure 25. By coloring the
surface of CaMwt and CaMD130G in accordance with hydrophobicity, the approximate location and
accessibility of the hydrophobic pocket can be revealed. The presence of a cavity in the hydrophobic pocket of CaMD130G is the only property distinguishing it from the hydrophobic
pocket of CaMwt.
Figure 24. Visualization of the secondary structure of (A) CaMwt and (B) CaMD130G. The red spheres represent Ca2+. The
three dimensional visualization of the secondary structure was performed in PyMol [43].
Figure 25. The surface of (A) CaMwt and (B) CaMD130G colored in accordance with hydrophobicity, accomplished with


![Figure 10. The molecular structure of p-HTMI [14].](https://thumb-eu.123doks.com/thumbv2/5dokorg/5539888.144499/20.892.473.773.147.312/figure-the-molecular-structure-of-p-htmi.webp)