Methodology and Applications of
Visual Stance Analysis: an Interactive Demo
Kostiantyn Kucher and Andreas Kerren
Department of Computer Science
Linnaeus
University, Sweden
{kostiantyn.kucher,andreas.kerren}@lnu.se
Carita Paradis
Centre for Languages and Literature
Lund University, Sweden
carita.paradis@englund.lu.se
Magnus Sahlgren
Gavagai AB, Sweden
mange@gavagai.se
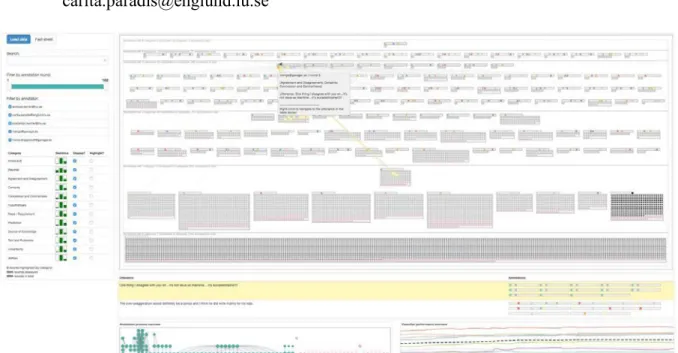
Figure 1: Visualization of text annotation data in our visual analytics system ALVA.
ABSTRACT
Analysis of stance in textual data can reveal the attitudes of speakers, ranging from general agreement/disagreement with other speakers to fine-grained indications of wishes and emotions. The implementation of an automatic stance classifier and corresponding visualization techniques facilitates the analysis of human communication and social media texts. Furthermore, scholars in Digital Humanities could also benefit from such an approach by applying it for literature studies. For example, a researcher could explore the usage of such stance categories as certainty or prediction in a novel. Analysis of such abstract categories in longer texts would be complicated or even impossible with simpler tools such as regular expression search.
Our research on automatic and visual stance analysis is concerned with multiple theoretical and practical challenges in linguistics, computational linguistics, and information visualization. In this interactive demo, we demonstrate our web-based visual analytics system called ALVA, which is designed to support the text data annotation and stance classifier training stages (Kucher, Kerren, Paradis, & Sahlgren, 2016). In contrast to existing tools used for similar tasks, ALVA combines multi-label annotation, active learning, and visualization of annotated data. ALVA supports separate user roles of data annotators (for instance, linguists without prior training in information visualization) and analysts to facilitate the annotation and training processes. It provides annotators with a clean, simple interface to label utterances with multiple stance categories. It also provides the analysts with several visualizations to support exploratory visual analysis of collected annotation data and facilitate classification improvements. Figure 1 demonstrates how our visualization representation based on the semantic substrates principle (Shneiderman & Aris, 2006) groups text annotations by combination of tagged
stance categories. We are currently using text data in English collected from blogs with our previous tool uVSAT (Kucher et al., 2016), but our approach could also be used to train the classifier based on another text genre, language, or set of categories.
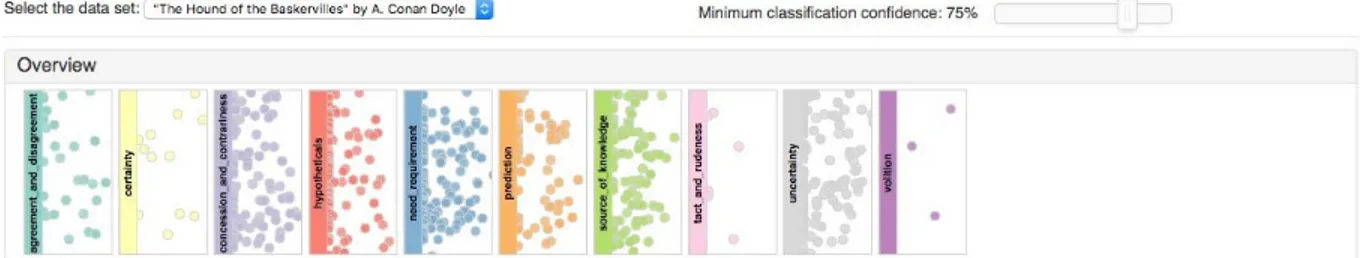
We also demonstrate how visual stance analysis could be practically applied to literature studies by combining the automatic stance classifier with text visualization principles (Kucher & Kerren, 2015). Our prototype depicted in Figure 2 provides an overview of stance classification results for a fiction text (divided into utterances). The overview consists of scatter plots for individual stance categories, resembling the document overview in uVSAT (Kucher et al., 2016). Each positively classified utterance is represented by a dot marker in the corresponding plot, and its position in text is mapped to the dot’s position. The overview supports details on demand and navigation over the text. The prototype also provides a detailed text view with stance category labels and details on demand, thus supporting both distant and close reading approaches (Jänicke, Franzini, Faisal, & Scheuermann, 2015). Furthermore, classification confidence values reported by the classifier are mapped to the opacity of overview markers. They are also used for filtering to focus only on more reliable results. The prototype can be used to estimate the number of utterances with detected stance in a given text, compare the results for several stance categories, and explore the text in detail. With the stance classification accuracy improving over time, we believe such an approach could be useful for scholars in Digital Humanities.
Figure 2: A prototype visualization of stance classification results for literature.
REFERENCES
Jänicke, S., Franzini, G., Faisal, C., & Scheuermann, G. (2015). On close and distant reading in digital humanities: A survey and future challenges. Proceedings of the EG/VGTC Conference on Visualization
(EuroVis ’15) — STARs, DOI 10.2312/eurovisstar.20151113.
Kucher, K., & Kerren, A. (2015). Text visualization techniques: Taxonomy, visual survey, and community insights. Proceedings of the 8th IEEE Pacific Visualization Symposium (PacificVis ’15), 117–121, DOI 10.1109/PACIFICVIS.2015.7156366.
Kucher, K., Kerren, A., Paradis, C., & Sahlgren, M. (2016). Visual analysis of text annotations for stance classification with ALVA. Poster Abstracts of the EG/VGTC Conference on Visualization (EuroVis ’16), 49–51, DOI 10.2312/eurp.20161139.
Kucher, K., Schamp-Bjerede, T., Kerren, A., Paradis, C., & Sahlgren, M. (2016). Visual analysis of online social media to open up the investigation of stance phenomena. Information Visualization, 15, 2, 93-116, DOI 10.1177/1473871615575079.
Shneiderman, B., & Aris, A. (2006). Network visualization by semantic substrates. IEEE Transactions on
Visualization and Computer Graphics, 12, 5, 733-740, DOI 10.1109/TVCG.2006.166.