School of Innovation, Design and Engineering
INCREASE CONTROL IN PACKAGING HANDLING PROCESSES:
ADDING VISIBILITY AND CONTROL THROUGH CLEARER RESPONSIBILITIES AND
CATEGORIZATION OF PACKAGING
A CASE STUDY AT SCANIA CV AB
Master thesis work
30 credits, Advanced level
Product and process development Production and Logistics
N. Andreas Hök and S. O. Daniel Trygg
Supervisor (company): Therese Engberg Supervisor (university): Anna Granlund Examiner: Sabah M. Audo
ABSTRACT
The increased use of returnable packaging have given rise to the trend of packaging logistics. The operation of returnable packaging is challenging for global companies due to the complexity in the process and information flows. Companies invest in returnable packaging systems in order to ensure quality throughout the supply chain. Despite the large investments in an returnable packaging fleet, it is often poorly controlled, leading to vast tied-up capital and shrinkage.
This thesis proposes how the visibility and control of the system is affected by the categorization of packaging and the allocation of responsibilities throughout the packaging handling process. Theoretical and empirical studies were carried out, the theoretical part helped define the problem. A case study were performed at Scania CV AB in Södertälje, Sweden. Results of this study shows that categorization of packaging is not sufficient to attain a suitable level of control in an packaging handling process. Although it could be used as a supporting or governing documents for standardization in the process. Findings showed that the responsibilities in the process should be centralized in as large extent as possible. Although if the current process is lacking visibility and control, the benefits of centralized control may be lost.
ACKNOWLEDGEMENTS
This thesis is the final part of a five year master program in Innovation, Production and Logistics at Mälardalen University (MDH) in Eskilstuna, Sweden.
First, we would like to thank our supervisors Therese Engberg at Scania and Anna Granlund at MDH for all the encouragement and being our main source of guidance in completing this master thesis.
Further, we would like to thank everyone who have contributed to this work, we are truly thankful for all support, a special thanks to all at the department Packaging Supply (OIP) who always took their time to answer our questions.
Södertälje, 30 Maj, 2014
TABLE OF CONTENTS
1. INTRODUCTION ... 1
1.1. BACKGROUND ... 1
1.2. PROBLEMDESCRIPTION ... 1
1.3. PURPOSEANDRESEARCHQUESTIONS ... 3
1.4. DELIMITATIONS ... 3 2. RESEARCH METHOD ... 4 2.1. RESEARCHMETHOD ... 4 2.2. RESEARCHPROCESS ... 4 2.3. DESCRIPTION ... 6 2.4. DATACOLLECTION ... 6 2.5. DATAANALYSIS ... 9 2.6. BRAINSTORMING ... 9 2.7. BENCHMARK ... 10 2.8. LITERATUREREVIEW ... 10
2.9. VALIDITYANDRELIABILITY ... 10
3. THEORETICAL FRAMEWORK ... 13
3.1. DEFINITIONOFSUPPLYCHAIN ... 13
3.2. INTEGRATEDLOGISTICSANDIMPROVINGNETWORKVISIBILITY ... 13
3.3. DECENTRALIZEDDECISIONMAKINGINSUPPLYCHAINS ... 13
3.4. INFORMATIONANDINFORMATIONQUALITY ... 14
3.5. PROCESSES ... 15
3.6. PACKAGINGLOGISTICS ... 16
3.7. PACKAGING ... 16
3.8. PACKAGINGHANDLINGPROCESS ... 16
3.9. TYPESOFDISTRIBUTIONCONCEPT ... 17
3.10. OWNERTYPESFORPACKAGINGPOOLS ... 18
3.11. BULLWHIP-EFFECT ... 18
3.12. CONFLICTINGGOALSINLOGISTICS ... 19
3.13. COSTALLOCATION ... 20 3.14. CATEGORIZATION ... 20 4. EMPIRICAL FINDINGS ... 21 4.1. SCANIABACKGROUND ... 21 4.2. CURRENTSTATE ... 24 4.3. BRAINSTORMING ... 59 4.4. BENCHMARK ... 60 5. ANALYSIS ... 63
5.1. WHATTYPESOFWASTEANDWHATCONSEQUENCES ... 63
5.2. HOWTOELIMINATEWASTEANDINCREASETRANSPARENCY ... 68
6. CASE STUDY RELATED RESULTS AND RECOMENDATIONS ... 71
6.1. CATEGORIZATIONPROPOSAL ... 71
6.2. PROPOSAL FOR UPDATING THE PACKAGING INSTRUCTIONS ... 73
6.3. RESPONSIBILITIES ... 75
6.4. RECOMMENDATIONS ... 77
7. DISCUSSION AND CONCLUSIONS ... 79
8. BIBLIOGRAPHY ... 81
APPENDICES ... 83
LIST OF APPENDICES
Appendix A Templates of interviews Appendix B Summary of interviews Appendix C Old category table Appendix D Benchmark
LIST OF FIGURES
Figure 1: Research process illustration of the thesis work. ... 5
Figure 2: Describes the three factors that together forms information quality. ... 14
Figure 3: modified from (Dominic, et al., 2000) describes the flow of both disposable and reusable packaging in the process. ... 17
Figure 4: Closed loop distribution system ... 17
Figure 5: Pool based distribution system ... 17
Figure 6: Illustration of bullwhip-effect. ... 19
Figure 7: Net sales by product area (Scania AB, 2013) ... 21
Figure 8: Net sales by region (Scania AB, 2013) ... 21
Figure 9: Shows the SPS-House (Scania CV AB, 2007). ... 22
Figure 10: Shows a simplified illustration of Scania's supply chain. ... 25
Figure 11: Organization map over inbound logistics at Scania CV AB: Source: Scania InLine ... 25
Figure 12: Describes location of Scania untis in Europe. ... 26
Figure 13: Illustration of simplified flow in Scania’s pool system ... 29
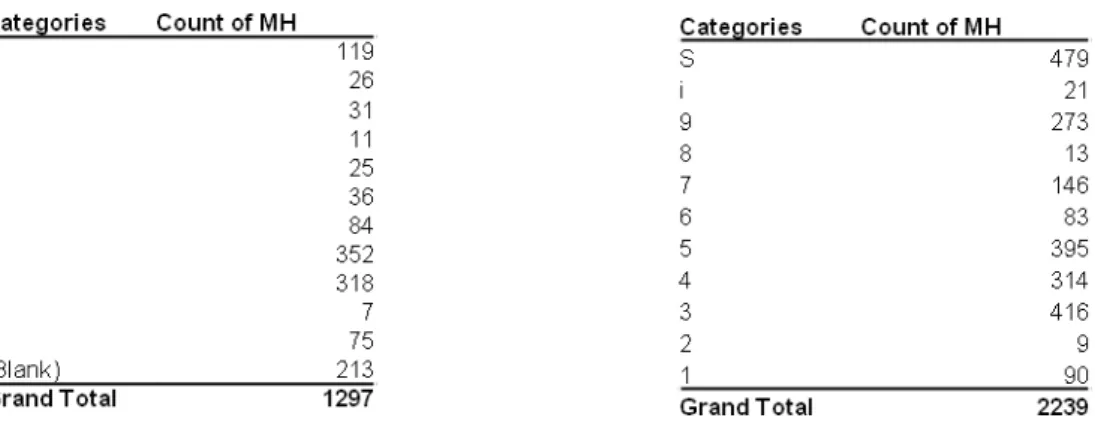
Figure 14: Describes a split view of MH-numbers devided by category for the two system Embasy and Packaging material homepage. ... 33
Figure 15: Shows the physical flow for category 1. ... 35
Figure 16: Shows the physical flow for category 2. ... 37
Figure 17: Shows the physical flow for category 3. ... 39
Figure 18: Shows the physical flow for category 4. ... 41
Figure 19: Shows the physical flow for category 5. ... 43
Figure 20: Shows the physical flow for category 6. ... 45
Figure 21: Shows the physical flow for category 7. ... 47
Figure 22: Shows the physical flow for category 8. ... 49
Figure 23: Shows the physical flow for category 9. ... 51
Figure 24: Shows the physical flow for category I. ... 53
Figure 25: Shows the flow demand 1 and 4. ... 59
Figure 26:Shows the flow demand 2. ... 59
Figure 27: Shows the flow demand 2 ... Error! Bookmark not defined. Figure 28: Example of packaging instruction, showing MH 0429. ... 73
LIST OF TABLES
Table 1: Shows participants of the interviews that were conducted in this study. ... 8
Table 2: Today's category table at Scania, see Appendix C for larger picture. ... 31
Table 3: Shows the total amount of packaging material devided by category. ... 32
Table 4: Describe cost responsibility for category 1. ... 34
Table 5: Describes today’s responsibilities for category 1. ... 34
Table 6: Describes the flow related aspects for category 1. ... 35
Table 7: Describe cost responsibility for category 2. ... 36
Table 8: Describes today’s responsibilities for category 2. ... 36
Table 9: Describes the flow related aspects for category 2. ... 37
Table 10: Describe cost responsibility for category 3. ... 38
Table 11: Describes today’s responsibilities for category 3. ... 38
Table 12: Describes the flow related aspects for category 3. ... 39
Table 13: Describe cost responsibility for category 4. ... 40
Table 14: Describes today’s responsibilities for category 4. ... 40
Table 15: Describes the flow related aspects for category 4. ... 41
Table 16: Describe cost responsibility for category 5. ... 42
Table 17: Describes today’s responsibilities for category 5. ... 42
Table 18: Describes the flow related aspects for category 5. ... 43
Table 19: Describe cost responsibility for category 6. ... 44
Table 20: Describes today’s responsibilities for category 6. ... 44
Table 21: Describes the flow related aspects for category 6. ... 45
Table 22: Describe cost responsibility for category 7. ... 46
Table 23: Describes today’s responsibilities for category 7. ... 46
Table 24: Describes the flow related aspects for category 7. ... 47
Table 25: Describe cost responsibility for category 8. ... 48
Table 26: Describes today’s responsibilities for category 8. ... 48
Table 27: Describes the flow related aspects for category 8. ... 49
Table 28: Describe cost responsibility for category 9. ... 50
Table 29: Describes today’s responsibilities for category 9. ... 50
Table 30: Describes the flow related aspects for category 9. ... 51
Table 31: Describe cost responsibility for category I. ... 52
Table 32: Describes today’s responsibilities for category I. ... 52
Table 33: Describes the flow related aspects for category I. ... 53
Table 34: Describe cost responsibility for category S. ... 54
Table 35: Describes today’s responsibilities for category S. ... 54
Table 36: Describes the flow related aspects for category S. ... 55
Table 37: Describes problem linked to material Planning ... 58
Table 38: Shows different stakeholders view on today’s category table. ... 67
Table 39: Show deviations for pool, breakdown and central controled transport. ... 67
Table 40: Shows the new category table for Scania packaging developed in this study. ... 71
Table 41: Allowed flow for each distribution concept ... 72
ABBREVIATIONS
BD Breakdown, breakdown unit for packaging material. DE Engine Production Assembly
DM Engine Production Machining and Foundry DT Transmission Machining
DX Axle and Gearbox assembly e-LC E - Logistics Control KD Knock Down unit LC Logistics Center LMPECP SLA Packaging Process MA Chassi Assembly Angers
MB Cab body production Oskarshamn MC Cab Assembly Oskarshamn MCL Logistic at Oskarshamn MH Material handling number MM Chassi Assembly Meppel
MPPL Product Introduction Chassis Logistics MS Chassi Assembly trucks and busses Södertälje MZ Chassi Assembly Zwolle
O Logistics department
OI Inbound Logistics department
OIP Packaging Supply and Forklift Coordination OL Logistics Centre department
OLSLX Logistic Development at Logistics Centre MS/DT Södertälje OLZ Logistics Centre Zwolle
PFEP Plan for every part
Pool Packaging pool, where packaging material is stored and distributed Premier Packaging pool in Södertälje
PHP Packaging handling process SLA Scania Latin America SPS Scania Production System SPC Spare parts center
TPS Toyota production system
VIDA Washing of packaging in Borlänge VLS Volvo Group Logistics Services Voith Packaging pool in Eshweiler VWL Volkswagen Logistics GmbH & Co
1. INTRODUCTION
The following chapter presents the thesis background, goals and limitations which is the basis for the thesis work.
1.1. BACKGROUND
In order to maintain or strengthen their position in the current competitive market, today’s automotive companies must work with cost strategies such as cost minimization and cost differentiation García-Arca, et al. (2006). And an important aspect of reducing costs is logistics. Two performance variables in logistics in companies and supply chains are logistics costs and tied-up capital. Tied–up capital has a direct effect on profitability and costs. As a factor, returnable packaging often requires an extensive investment in material and tied-up capital (Jonsson, 2008).
The increasing usage of returnable packaging have given rise to the trend of packaging logistics. Companies uses returnable packaging in a number of ways to improve its supply chain operations. Packaging is almost everywhere, as soon as some article or product is moved from one place to another it is some form of packaging that will protect, streamline the transportation or reduce manual intervention during unpacking. Packaging have a great impact on the industry since it to a large extent influence (ensure) quality throughout the whole supply chain process (Kärkkäinen, et al. 2004, Lumsden 2012).
There are many ways to handle the large amount of packaging that is used today, in some cases returnable packaging is more appropriate and in other cases disposable packaging is the best alternative. The environmental and cost-related profits that can be achieved by reusing the packaging has led many companies to increasingly move to more reusable packaging types. Package handling systems have evolved at companies to control and manage the very much needed packaging handling process.
A common problem is steering and repositioning of pallets so that the need for empty pallets is satisfied. Normally it exists imbalances in a transport relationship due to that there are not as many goods in both directions. This creates a continuing need for transportation of empty pallets (Lumsden, 2012).
The most fundamental function for a packaging handling process is to get the right volume of packaging material at the right place and at the right time with the right quality while minimizing the overall cost. Many companies today struggle with this, as the roles and responsibilities are not clear enough or that responsibility have been given to someone who does not have the authority that is needed to implement the required changes (McKerrow, 1996).
1.2. PROBLEM DESCRIPTION
Often does a packaging fleet require periodic replenishing as units are damaged, lost or scraped Returnable packaging system is no exception, on the contrary since they usually are managed with limited vision and control although they are often of high value, vulnerable to theft and critical for distribution and production (Hellström & Johansson, 2010, McKerrow, 1996, Twede & Clarke, 2004).
Christopher (2011), states that the configuration and sizing of the returnable packaging fleet can be reduced by adding visibility in the network. Therefore, reducing the tied up capital of the expensive items.
The annual shrinkage of returnable packaging is a common problem in packaging handling process. The causes for these inefficiencies are potentially lack of ownership and targets,
insight, measurement and reporting, process vision and systems integration. Verstrepen, et al. (2007) considering the high shrinkage rates, the importance of asset visibility is expected to increase.
A survey by Breen (2006) shows that a large number of shrinkage of the packaging fleet in the logistics sector is due to wear, damage, theft and loss, in general through non-returns from customers. The companies in the survey also agreed that this was an issue but that it had not been addressed as seriously and properly as it should.
The problem with visibility in packaging handling processes is well known but the responsibility for the packaging handling process is not considered a priority in companies today. Another survey by Verstrepen, et al. (2007) indicates that only 37% of the respondents consider the physical handling of packaging and support materials to be well under control and performing efficiently. Furthermore, as much as 44% had no return policy for packaging and support materials. Another problem is that managers in charge of other main processes such as sales and customer service is entrusted the ownership of the reverse logistics process with a loss of focus. (Verstrepen, et al., 2007)
Ilic et al. (2009) argue that packaging material visibility together with a proper management approach is needed to improve process efficiency and packaging material control. They estimate a decrease in the transport cost (the cost for a packaging material to make one loop) with improved visibility in the packaging handling process.
The amount of literature on the packaging logistics is limited and none examined gives a deeper description of how roles and responsibilities should be allocated within the automotive industry to attain control in the packaging handling process. The literature is suggesting process steps about mapping and finding waste in the supply chain but not specifically in the packaging handling process.
A suitable company to perform a case study regarding packaging logistics is Scania CV AB, since they work with continuous improvements but one area with a lack of focus has been packaging logistics.
As an important part of Scania production operations throughout the world, their package logistics have over 1500 different types of packaging, using different categories to divide the different packaging materials. The categories determine for example how the package will be developed, managed and who is responsible for it. Scania works with Scania Production System (SPS), which is based on four main principles; standardize, right for me, consumption-controlled production and continuous improvement (Scania CV AB, 2007). But today there is an uncertainty over the roles and responsibilities that exist for each packaging category, leading to misunderstandings and doubtful guidelines. The risk of sub-optimization increases as no clear directives between departments exists which contradicts the pursuit towards elimination of anomalies that SPS advocates.
1.3. PURPOSE AND RESEARCH QUESTIONS
The purpose of this study is to understand and evaluate existing packaging handling processes in the automotive industry in terms of categorization, roles and responsibility. As well as finding waste and examine which aspects can reduce waste and contribute to increased control. Results from the case study aim to provide Scania CV AB with improvement suggestions on setting up categories and allocating roles and responsibilities.
In order to carry out this study the following research questions have been formulated:
• What types of waste are there in current package handling processes regarding categorization, roles and responsibilities, and what are the consequences of this waste?
• How could the visibility and control of packaging process be improved?
• What aspects and factors are crucial to the categorization of different types of packaging?
1.4. DELIMITATIONS
Since the thesis focuses on understanding and improving of existing packaging handling process by standardization and by adding visibility, not focus on transforming the existing flows but to clarify current ones and find deviations, the current departments should be kept. The case study will only focus on existing processes and packaging materials.
The question is not whether a company should or should not outsource the packaging handling process, rather to improve an existing system. Further the thesis is limited to suggest the best proposal to Scania for improving the packaging handling process, implementation of the proposal is not included due to the limited time of the project.
The study will also limit the number of sources from the stakeholders in the packaging handling process who will be involved in the case study, this due to the limited time frame. The selection of stakeholders will be discussed with the supervisor at Scania to make the data collection as objective as possible.
Also a delimitation regarding Scania packaging handling process is made where the whole flow in Latin America is simplified to a single actor. This as Scania Latin America has its own internal packaging handling process that is not fully connected to Scania Europe, only difference from an ordinary production unit is the custom laws that apply to and from Latin America.
2. RESEARCH METHOD
The following chapter presents the approach of the research process during the thesis. An explanation of how each method has been applied in the thesis is presented along with how the information gathering and analysis of data has been conducted.
2.1. RESEARCH METHOD
Research approaches can usually be divided into two different ones, deductive and inductive. A deductive research approach means that hypotheses are developed based on existing theories. These hypotheses are then tested by the correlation between them, the two known variables are examined to verify if the theory is correct or not. This approach does not always require observation of the reality. With an inductive approach, conclusions are drawn from empirical data collection that has been analyzed (Saunders, et al., 2009).
According to Saunders, et al. (2009) and Yin (2003), there are a number of useful research methods such as archival analysis, case study, survey and experiment and all can be used as exploratory, descriptive and explanatory research.
Case study is often used for questions such as why, how or what. Some advantages of case studies is that it includes the logical design for complex systems. Case studies do not require a strict set-upped environment within which the phenomenon will be studied (Yin, 2003).
It is important that the choice of research method is based on the research questions of the project and the environment that should be studied. We have chosen to use case study as our research method in order to do an exploratory research with an inductive approach. The choice is based on our research questions which are suitable for a case study. Survey or archival analysis could also answer the questions. But since we are both interested in how it should work in the current situation and also how it really works, these two methods are not suitable. Using experiments would not work because the environment we study is too complex to be able to control in a way that experiments require. We also want to draw conclusions and create new theories out from the empirical data, which make the choice of inductive approach suitable.
2.2. RESEARCH PROCESS
As a very first step in this case study a short literature review was done to create a better understanding for the area. It has since been the basis for how the rest of the case study was designed. A Gantt chart was created to visualize the project, but also to define the different parts of the project in to our timeframe. During this part of the project a big part was to conduct descriptive research with a lot of unstructured interviews in order to get a good picture over the process that was the subject for our case study.
The study was then divided into three major steps that together aimed at providing answers to the research questions raised and thereby fulfilling the purpose and goals of the project. The research process is illustrated in Figure 1 showing when the different steps in terms of data collection, literature study and analysis were performed.
Figure 1: Research process illustration of the thesis work.
The first step consisted of a mapping phase in order to answer the question "What are the
types of waste in the current package handling process?". This mapping phase mainly consist of semi-conductive interviews but also observations and analyzing of documents. Empirical studies were carried out based on the research questions raised in the introduction Chapter 1. Further description of how the interviews were conducted is found in Chapter 2.4.2.
In order to describe how the categories was intend to work, the authors choose to only ask the owners of a particular category, for example was only packaging supply (OIP) asked regarding category 1, while production units (PRU's) are asked about Category 2. The mapping of how the categories actually works, production units, packaging pools, breakdowns (BD), Packaging Supply (OIP), Scania Parts Center (SPC), Scania Latin America (SLA) and Knock Down (KD) units were interviewed.
The second step was about answering the “what consequences arise from this waste?” Here is
the aim to better understand how the waste affects the whole process. In this step, a large part consists of literature review and analyzing the data from the mapping. A literature study were conducted to give an understanding of the research area and previous research. The literature study was used to contribute to the design of the empirical studies as well as contribute to analyzing of the collected data and answer the research questions. The focus in this step was to find wastes that have potential for cost savings.
The third Step will answer, “How can a more optimal solution look like to reduce waste and
deviations to increase the efficiency and profitability of packaging handling process?” Here will all incoming data from the two first steps be used in a concept development process. The overall process for data analysis is described in Chapter 3.4.
2.3. DESCRIPTION
This method is usually seen as the most fundamental and easiest method. The approach is to describe something, e.g. how an organization works, or how the decision has been taken. The method is often used to describe things at a general level and is therefore good to use as an overall method in a project. Although the method is considered to be simple it can be tricky since it requires a systematic approach in order to produce information that has relevance. The information must be sorted, and be presented in such a way so that it is clear what is essential (Ejvegård, 2009).
2.4. DATA COLLECTION
Data analysis took place onsite for a period of four months using direct observation, archives and internal documentation. According to Booth, et al. (2008) sources are conventionally categorized into three kinds, primary, secondary and tertiary. Often is described as information flow from the primary source to secondary and finally tertiary as it becomes less detailed and authoritative but more easily accessible (Saunders, et al., 2009).
Primary sources provide “raw data” that can be used as evidence to support your claim. Further described by Saunders, et al. (2009) the primary sources are the first occurrence of a piece of work and include published sources such as reports, unpublished manuscript sources such as letters and memos. Also observation, surveys and, in some cases, data from interviews counts as primary sources.
Secondary sources are easier to locate than primary sources as they often are better covered by tertiary sources. The succeeding publication of primary literature such as books and journals are listed as secondary sources and are aiming at a wider audience. Booth, et al. (2008) state that you can use the secondary data to support your argument, but only if you cannot find those data in a primary source. Further describing the tertiary sources as books and articles that combines and report on secondary sources for an even broader audience, such as textbooks, articles in encyclopedias, and what standard search engines turn up the first on the Web. Saunders, et al. (2009) suggest that tertiary sources are designed either to help to locate primary and secondary literature or to introduce a topic. According to Yin (2003), the most commonly used sources in case studies are the following, documentation, archival records, interviews, direct observations, participant-observation, and physical artifacts. Each with its strength and weaknesses, thus it is important to use several to complement one another. The data collection methods that are used in this thesis are described in the following sub sections; direct observations, interview and documentation.
2.4.1. Direct observations
Evidence from observations is often useful to provide more information on the topic. This can be done by attending meetings, office spaces, production or the like.
As the case study should take place in the normal setting of the case, it is natural that direct observations are performed and are important for data collection.
The advantages of direct observation include that you look at the reality and that you can put the case in context. However there are some drawbacks that must be taken into account, the method is often time consuming, difficulties may appear covering a major event, the cost for the time it takes and one must also keep in mind that the event may be affected by the monitors (Saunders, et al., 2009). Direct observation is used in this project for the collection of general information and analysis of the packaging flow by being on site every day during the project. The reason were to gather information and analyze the current state of the packaging handling process by being at the case company every day. During the observations the packaging handling process was studied in terms of how the packaging material were stored, broken down, and transported.
2.4.2. Interviews
Interviews are a great tool for collecting valid and reliable data that are relevant to the project. Saunders, et al. (2009), describes sections interviews in three different categories; structured, semi-structured and unstructured, and in-depth interviews. In structured interviews, questionnaires based on standardized or identical questions are often used to collect quantifiable data. Semi-structured interviews are often based on questions in a theme that can alternate from time to time. The order of the questions often varies between interviews because of the flow of the conversation, although questions may be added during the interview. This also means that some questions may be excluded from various interviews, depending of the context in which the conversation revolves around. Recording and/or note taking is often used to document. Unstructured or in-depth interviews are informal. There is no predetermined list of questions and the interviewee can talk freely in the subject. Often used to explore more in depth in the subject of interest.
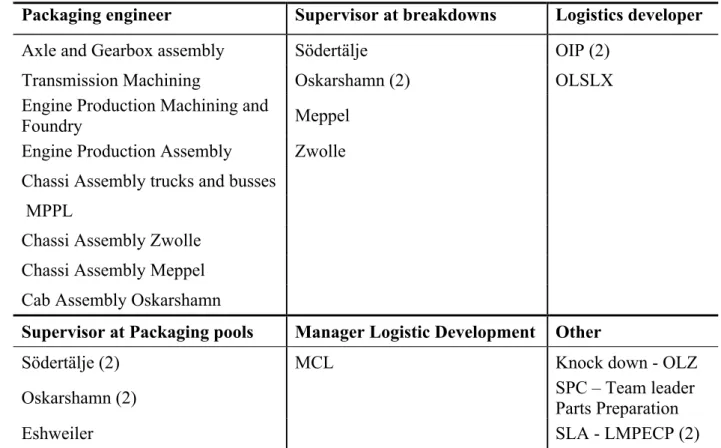
Semi-structured interviews were conducted with key actors in the packaging handling process to bring depth to the investigation. Chosen based on their involvement and knowledge of the packaging handling process. Key personnel in the packaging handling process at Scania that were interviewed includes, packaging engineers, logistics developers and manager of the logistic development. Other personnel from important division such as Scania Latin America, Scania Parts Center, Knock Down, breakdowns and packaging pools were also interviewed. A list of the interviewed is showed in Table 1.
Table 1: Shows participants of the interviews that were conducted in this study.
Packaging engineer Supervisor at breakdowns Logistics developer
Axle and Gearbox assembly Södertälje OIP (2)
Transmission Machining Oskarshamn (2) OLSLX
Engine Production Machining and
Foundry Meppel
Engine Production Assembly Zwolle Chassi Assembly trucks and busses
MPPL
Chassi Assembly Zwolle Chassi Assembly Meppel Cab Assembly Oskarshamn
Supervisor at Packaging pools Manager Logistic Development Other
Södertälje (2) MCL Knock down - OLZ
Oskarshamn (2) SPC – Team leader Parts Preparation
Eshweiler SLA - LMPECP (2)
According to Yin (2009) interviews are one of the most important sources of case study information because most case studies are about human affairs or behavioral events. Important insights and prior history of the events can be obtained from well-informed interviewees. The interviews were semi-structured with prepared questions, see Appendix A, but including space for opinions and ideas beyond the form.
Notes were taken during all interviews and many of them were also recorded. This was done in order to increase reliability. Some of the questions were asked again in a second interview to ensure validity. Furthermore, regular e-mail contact was established with the respondents for questions that were overlooked during the interviews.
2.4.3. Documentation
Documentary information is most likely relevant to every case study claims Yin (2009). But documents are not always accurate and are sometimes biased, which means that they must be carefully used and should not be accepted as literal recordings of events that have taken place. The documents that were used in this case study are combined with other sources to prevent bias.
Even so documents are playing an explicit role in any data collection and the most important use is to corroborate and augment other sources. These documents could be in form of letters, emails, agendas and minutes of meetings, announcements, reports, and proposals.
Company specific documentation of the packaging material handling and process has been gathered in two steps. In the first step, basic information about the case company was acquired through internet, leaflets and the company intranet. In the second step, data and documents from the company intranet was gathered to help map the current situation. Internal presentation documents for packaging handling process were used to get a first overview. Also documents from previous company projects that have been watching the process or adjacent processes were used as a basis for interview questions and mapping. The documentation collected made it
possible to go back, complement and trace the development in the project. Observation in databases was conducted continuously during project.
Previously collected information about other companies' packaging handling process was used as the basis for benchmarking.
2.5. DATA ANALYSIS
According to Yin (2009), data analysis consists of examining, categorizing, tabulating, testing, or otherwise recombining evidence to draw empirically based conclusions and is one of the most difficult aspects of doing a case study. Reason being that investigators often start case studies without having a strategy how the evidence is to be analyzed. Techniques for analyzing case study evidence still have not been well defined, making it especially difficult.
Both qualitative and quantitative data has been analyzed in this thesis. Collected quantitative data were categorized and tabulated in order to be analyzed. Qualitative data from documents, interviews and observation were categorized and used to get a better understanding of current situation in the packaging handling. The quantitative data were used supplemental to the qualitative data in order to better understand and analyze.
Yin (2009) provides description on four strategies to rely on when analyzing data, relying on theoretical propositions, developing case descriptions, using both quantitative and qualitative data and finally examining rival explanations. Case study analysis will proceed with difficulty without such strategies (or alternatives to them).
In this case study two of the previously mentioned strategies is applied, one of them being theoretical propositions as it is a comparison between reality and literature review. In order to answer the research questions, the two “what” and “how” questions described in the research process see Chapter 2.2 needs to be answered by analyzing the data.
Case study analysis should follow a general analytic technique, defining what to analyze and why. Hence, according to Yin (2009), the next step is to select a specific analytic technique. He gives example of five different techniques that exists The reason were to gather information and analyze the current state of the packaging handling process by being at the case company every day; pattern matching, explanation building, time series analysis, logic models, and cross-case synthesis.
As a second and supplemental analytic technique, explanation building were used to get an understanding how things are associated within the case study. Yin (2009), states that the technique mainly is relevant to explanatory case studies and the goal is to analyze the case study data by building an explanation about the case.
2.6. Brainstorming
Brainstorming is according to Morrissey & Olander (2005) a frequently used tool and one of the very best in terms of idea generation. It is used to initiate idea creation, when you want many ideas to flow and when one wishes to seek ways out of the objected patterns.
To get a new thinking and ideas about dividing of packaging material, a brainstorming session was held with a few selected key people in the process as well as outsiders to implement new ideas. Participants in the brainstorming were two packaging engineers from DE and additional packaging engineer from DT, process developer transport engineering at OIT and logistics developer from OIP.
2.7. BENCHMARK
It is common to wonder how well a firm’s logistics/SC is performing compared with its competition when audits are conducted, states Ballou (2004). And according to Nahmias (2008) is competitive benchmarking gaining importance in light of increasing global competition. Further is Ibid. describing four types of benchmarking, product, functional or process, best practices and strategic benchmarking. To obtain new ideas and knowledge about today’s existing packaging handling processes a best practices benchmarking in combination with a process benchmarking were performed towards leading companies in the industry. The gathered information were analyzed and used to develop a concept proposal. The benchmarking were made against Volvo Group Logistics Services and Volkswagen Logistics GmbH & Co. Information gathered were taken from previous documents that Scania CV AB had archived in the case of Volvo Group Logistics Services, and in the case of Volkswagen Logistics GmbH & Co an interview were conducted with a project manager within their Group Container Management.
2.8. LITERATURE REVIEW
A literature review related to the packaging handling process and supply chain development has been performed throughout the research. The literature review introduces the concept of packaging handling and gives a brief background on the subject.
The search engines used for searching for academic articles cover several databases and one were used to search in a specific database. Internet databases Google Scholar, DiVa and Discovery, were used to cover several databases. The specific database used was IEEE Xplore. Keywords used in the literature review were the following:
Packaging, Logistics, Supply Chain, Reusable transport items, Containers, Pallets, Reusable, Returnable
The majority of articles used were publicized from the year 2004 and forward to maintain an actuality of the articles.
2.9. VALIDITY AND RELIABILITY
To ensure a sufficiently high validity of the study, a clear statement of purpose were made, as well as a well-formulated methods section, and clear issues have been developed. To further strengthen the validity of the study, any questions that concerned the topic at the company were answered by area experts. The findings made by the collection of information have also been verified by the case company to prove that it is correct. Updates of the project progress and results were presented on a monthly basis to a steering committee at Scania. This also ensured that the data collected were validated through this forum. The steering committee consisted of project owners, and stakeholders such as Manager Logistic Development at Logistic at Oskarshamn (MCL) and Strategic Sourcing at Product Introduction Chassis Logistics (MPPL). Mapping how each category's standard flow is supposed to be is based from the owner of the category. This means that the objectivity can be questioned but was necessary due to the unclear directives.
Tests such as construct validity, internal validity, external validity and reliability are commonly used for empirical social research but are also relevant to case studies according to Yin (2009).
2.9.1. Construct validity
To ensure that the construction of the interviews actually relates to the problem and that sources that are used are relevant to the case study. Especially challenging to the case study research is identifying correct operational measures for the concepts being studied (Yin, 2009). One measure to increase the validity of case research is to use triangulation, by using multiple means of data collection and hence sources of evidence (Yin, 2009).
To gain input not only from one source, this case study use multiple sources of evidence, interviews, observations and internal documents. The interviews were supplemented by observations as well as the collected internal documents made it possible to validate data from the observations and interviews. To further strengthen validity, the questions were posed in an open way during each interview to minimize the possibility that the answer of the interviewees being influenced, with caution not to ask too open-ended questions which can have the opposite effect and reduce validity.
Yin (2009) states that real-time observation is an appropriate but very time-consuming and highly selective method in case studies. To secure valid results the use of observations was necessary to the case study. During doing the project, almost every day for four months being at the company helped to better see the performance of the company and the studied process. Furthermore, many of the interviewees could provide diverse views because they were from the same level or with the same functions, and situated in different countries, in the case company.
2.9.2. Internal validity
Internal validity is the approximate truth of conclusions regarding causal or cause-effect relationships. It is difficult to reach internal validation and it can never be guaranteed. According to Yin (2009) the use of pattern-matching is one of the most desirable techniques in a case study analysis. If the patterns coincide, the results can help a case study to strengthen its validity. To achieve this, the research questions were analyzed from multiple perspectives by finding relationship between gathered data.
As the studied process is complex with many parts and relationships, problems could arise due to the difficulty to judge the result. To counteract this problem, the view of the process studied has been described in detail, with its parts and relationships.
During the interviews, two researchers were present during all the interviews which made it possible to review and discuss the analysis, this to assure that the perception of the interview was not only interpreted by one, thereby increasing the degree of the internal validity.
All the conclusions drawn are often based on multiple sources of data or from at least two interviews. This increases the internal validity due to it being based on triangulation between different sources of data.
2.9.3. External validity
The external validity is direct related to the generalization of the research results. Are the conclusions valid for other areas than the one studied. Simplified, the results from one case company could also be valid at other case companies and in a general context. Yin (2009) proposes the use of analytical generalization for case studies, meaning that the result should be compared with existing theory.
This research has applied this method by comparing the findings with established theory, and is one of the reasons why a literature study has been conducted.
2.9.4. Reliability
Reliability is used to be sure that if the study is carried out by another investigator, they should reach the same findings and conclusions as an earlier investigator if the same procedures were used in the case study.
Yin (2009) states that reliability is demonstrating that the operations of a study can be repeated with the same results, such as data collection procedures.
There are difficulties in providing reliability in a case study. Therefore, Yin (2009) carefully point out that you should conduct the research as if someone were always looking over your shoulder and also try to make as many steps as operational as possible.
All interviews, documents and observations are carefully selected in order to ensure appropriate and reasonable quality of the result. To ensure repeatability, the thesis is following the research process that is explained in Chapter 2.2.
3. THEORETICAL FRAMEWORK
The following chapter covers the literature that this thesis is based on. The theoretical framework provides the reader with a better understanding of the areas that have been covered during the thesis work.
3.1. DEFINITION OF SUPPLY CHAIN
Supply chain has is the basis for this thesis. Supply chain is a well known concept in the area of logistics and we have chosen to use of Christopher (2011) description;
“The management of upstream and downstream relationships with suppliers and end customers in order to deliver superior customer value at less cost to the supply chain as a whole”
It is important to understand that the supply chain often is seen as a forward chain to the end customer. But there are often reverse systems in supply chains. These reverse systems can both be return systems for final products but also for packing material. This reverse supply chain is very similar to the forward supply chain (Christopher, 2011, Lumsden, 2012).
3.2. INTEGRATED LOGISTICS AND IMPROVING NETWORK VISIBILITY
Integrated logistics is defined as an approach to minimize the total cost of transportation, warehousing, inventory levels, order processing and information systems and at the same time achieving the delivery service that the customer requires. This approach is based on minimizing the total cost instead of minimizing the individual activities' costs. Previously, it has been a more decentralized approach. Each actor in the supply chain has only prioritized their own income and expenses (Lumsden, 2012).
According Twede & Clarke (2004), many companies have a lack of information about how much packaging there is in a loop, it is more common in bigger and more complex loops where the flow does not have one certain path.
A common problem in supply chains is the limited transparency in the flows. The many flows in large companies makes it difficult for a particular department to keep track of how the flow looks upstream and downstream in the supply chain. It may in such situations take weeks or months before problems come to light and it may be too late to take effective action (Jonsson, 2008).
An example Jonsson (2008) describes with Nokia and Ericsson. Both had the same big producer which was producing semiconductors. When the producer had a major fire and announced it, Nokia had a system that intercepted this and alerted that this could create problems of the supply with semiconductors and undertook direct action. Ericsson however saw the problem much later and got big problems and lost significant revenue because of the shortcomings that arose.
3.3. DECENTRALIZED DECISION MAKING IN SUPPLY CHAINS
Lee & Billington (1993) names the different sources of uncertainties that exist in a supply chain. They include demand (volume and mix), process (yield, machine downtimes, transportation reliabilities), and supply (part quality, delivery reliabilities). In order to protect the chain from these sources, inventories are often used. Control responsibilities of these uncertainties are often spread out to the different units in the supply chain as many companies have intentionally decentralized operational control of their business units or functions.
Decentralized control means that decisions on how much and when to produce are made locally in a multisite company and each individual unit makes decisions based on local information,
whereas centralized control means that decisions on how much and when to produce are made centrally, based on material and demand status of the entire system. Decentralized decision making is further described by Yu, et al. (2001) each member has its own decision rights and acts as a single decision maker to optimize its costs or benefits. For example, manufacturing sites may report to different business units based on process or technology similarities, or customer needs. All units have their unique culture, constraints, and objectives (Lee & Billington, 1993).
Yu, et al. (2001) states that modern management theories regarding management of large organization are suggesting that decentralizing decision making is an effective way. Yu, et al. (2001) is further describing that in order to make timely decisions effectively, decision making should be assigned to the person who is just at the decision spot and has specialized knowledge of his or her surroundings.
There are not only positive aspects on decentralized decision making, one problem being that the whole system may not achieve the optimum performance even though each member optimizes its own performance. Every single member has perfect information about its local site, but uncertainties arise due to a lack of perfect information flows between other members of the supply chain (Yu, et al., 2001 and Lee & Billington, 1993).
3.4. INFORMATION AND INFORMATION QUALITY
It is generally known that there are three types of flows in a supply chain; Material flows, cash flows and information flows. Of these flows is material flow and cash flow significantly different against the flow of information. Materials and cash flows represent invested capital, in other words direct economic value. This is not the case for Information flows. The conclusion that these two flows, material and cash flows, is more important to improve in order to have more efficiency and control to achieve a more efficient and effective supply chains. But it is usually not the case. The availability of information is necessary in order to operate effectively and is a condition for supply chain stakeholders to exploit its resources in the most optimal way. The information is not directly representing a value but it has in many cases an indirect value. Information can be viewed from a management perspective as a basis for analysis and decisions. The quality of the information used in decision-making is therefore crucial for the quality of the analysis that is the basis for the decision taken. It also means that the information transferred between actors in the supply chain in the same manner is critical to the effectiveness of actors use of resources and how good the material flows will be (Mattsson, 2012).
The concept of information quality represents the extent to which the available information meets all the realistic demands for optimal decision making. Information quality can be described in terms of three different dimensions; accurate information, up-to-date information and complete information (Mattsson, 2012), (see Figure 2).
Accurate information can be divided in two ways. One is that the information refers to the
information that is meant, in other word high validity. The second is the accuracy of the information, high reliability. Even if the information relates to what it is supposed to it has to be reliable. Example, a forecast must also be reliable and not only for the right valid.
Up-to-date information means that the information must be up-to-date, even if the
information reliable and valid, it must be presented at the right time otherwise is the information missing for the decision to be taken in the best way.
Complete information means that the information must be complete and should not miss any
aspect. For example, a forecast of a company's future needs has only quantity but lack the time points when the quantities needed. This is considered low quality information when the information is not complete in order to make good decisions on.
Many times is lack of reliability coursed by input errors made when someone enters information in different systems. Mattsson (2012) is estimating that 70 percent of the information that is fed into the system read by other systems, resulting in that incorrect information easily spread out quickly.
3.5. PROCESSES
The word process comes from the Latin “processus” which means progress. A process consists of activities that take things forward. Through the activities flows something, such as a product or a customer, as through the activities is supplied with value. A process consists of a series of activities that together make up the whole. To understand the process, one must understand the relationships between activities. It is the relationships that is the key in order to understand a process. The goal for the process is to satisfy the customers need with as few resources as possible. By using the process as a starting point, improvement work can be carried out on the activities that the process consists of. (Carlsson, et al., 2005)
A process can be very large and complex. And it's when one can see and understand all parts of the process that changes can be made in the long term, where the real problems occur, rather than resorting short-term emergency solutions. One important factor when working with processes is to try to not make organizational barriers stop one from seeing other parts of the process. Improvement work must always have support from the management and must usually be carried out simultaneously in several functions of the company or organization. Process improvements often result in; improved resource utilization, more user efficient processes, cost savings and better ability to predict future activities (Carlsson, et al., 2005).
3.6. PACKAGING LOGISTICS
Looking at the traditional logistics literature, there are two important concepts "customer in the center" and "customer value". But when looking at packaging logistics, it is not as obvious that it only has these two focal concepts that today refer to the end customer. The packaging logistics can all actors in the supply chain be seen as customers as they use packaging in a way or another. Packaging Logistics aims to create packaging and packaging handling process to support the logistics process and the users (Dominic, et al., 2000).
3.7. PACKAGING
According to European Parliament and Council Directive 94/62/EC packaging can be defined as:
“‘Packaging’ shall mean all products made of any materials of any nature to be used for the containment, protection, handling, delivery and presentation of goods, from raw materials to processed goods, from the producer to the user or the consumer. ‘Non-returnable’ items used for the same purposes shall also be considered to constitute packaging.”
Packaging can be divided into several levels primary, secondary and tertiary level. There are different views on what types of packages that will be within which level. Some of literature talks about the extra level for so-called cargo packaging as containers or pallets. According Dominic, et al. (2000), Chan, et al. (2006) and Verghese & Lewis (2007) the three levels can be described as:
Primary packaging is the packaging that is designed as an end unit at the point of sale to the
end customer. The package mission is to protect but also to help the client identify and obtain information about the product.
Secondary packaging is a group packaging that several units are packed in. It usually called
retail package as it meant to increase the manageability in stores. Most often are retail and transport packaging combined.
Tertiary packaging or transport packaging is the packaging that will facilitate the
transportation of products and ensure that the product is not damaged during transport handling. Dominic, et al. (2000) argue that cargo pallets and containers should not be below this level, but rather under a fourth level for cargo Packaging.
3.7.1. One-way and reusable
There is an intense debate between using disposable packaging or reusable packaging. But it is not possible to appoint an overall winner in the debate. The system that is most appropriate in a particular case based on environmental, cost and effectiveness depends on the specific conditions that exist just for this occasion (Dominic, et al., 2000).
3.8. PACKAGING HANDLING PROCESS
Packaging handling process is the process that is built up by companies or organizations to manage the whole process of flows for the packaging. Figure 3 modified from Dominic, et al. (2000) can describe the flow of both disposable and reusable packaging has in the process.
Figure 3: modified from (Dominic, et al., 2000) describes the flow of both disposable and reusable packaging in the process.
3.9. TYPES OF DISTRIBUTION CONCEPT
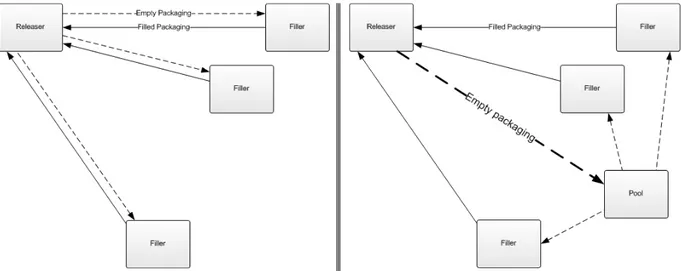
When talking about distribution system for packaging material we often speak in terms of a filler and a releaser. A releaser is often referred to a production unit within the company while the filler refers to a supplier outside the company. There are two general types of system that is used, closed loop system often simple flow between two units or pool system often common where there are many units using the same packaging material (Kroon & Virjens, 1995 and Lindgren, et al., 2013).
Closed loop system
In a closed loop system, see Figure 4, is packaging material often easier to handle both physical and administrative, thou it goes in a closed loop. From the same reason can return flows be long and the utilization of the packaging material becomes low. This type are often used for special packaging material and can also be hard to collapse and compress when is shipped empty.
Pool system
In a pool system, see Figure 5, is the packaging material often of a more general type and can be send out to a filler that have a certain demand at a certain time. With a strategic placed pool transport distance can be optimized. The pools is in first hand placed close to big releasers but transports from big releasers can in other cases often be consolidated and optimized with big transport loads.
3.9.1. Diverging or Converging pool system
Some reusable packaging are not returned, this is common when the package goes to multiple recipients. The packaging is often divided into two different distribution Circuits `diverging 'and' converging '. Diverging is when there is one or a few dispatcher often large, to large numbers of recipients often small. In diverging distribution is often difficult to investigate where losses of packaging have occurred and can cost more than the value of the lost package. Converging distribution is when packaging goes to a small number of mostly large recipients. This type of distribution is often seen in the automotive industry when suppliers are sending to production units. In both distribution circuits, a greater proportion standard packaging give an increased risk for packing to disappear when it often have multiple user and when is used outside the intended flow. Special packaging that only have one or a few user usually have a better reflux rate (McKerrow, 1996).
3.10. OWNER TYPES FOR PACKAGING POOLS
When talking about pools we are referring to the place which reusable packaging is located when it is not being used in its loop. These can be managed and owned several ways among the actors involved. McKerrow (1996) describes them as five different types:
Manufacturer owned is the packaging owned by the manufacturer and the manufacturer has
then the responsibility to holding the stock and bring back empty package from its customer. Manufacturing owned packaging does usually work well in closed loop flows with one customer. While it requires very specific circumstances in order to work well with multiple customers. A situation where it can work is if the manufacturer is so dominant that pressure can be made on customers.
Customer owned is when the packaging is owned by the receiving customer, this type is
common in the automotive industry. The customers are then responsible for holding stocks and send back the package to his supplier. This can create complexity and problems for the supplier in his packaging and warehousing process if the supplier is manufacturing similar parts to another customer and the different customers have unique packaging.
Partly owned is when parts of the packaging are owned by several actors. It is here agreed
specification for the packaging so it always has the same standard. A stakeholder owns the part of the packaging he uses. If too many different stakeholders start using such a standard, the quality of the packaging can begin to deficiency.
Third-party owned is when a third entirely outside party owns the packaging and is then
responsible for the purchase, distribution and quality of package.
Jointly owned is when a group of stakeholders owns the packaging but the control is like in a
third-party owned. Larger corporations with many businesses often use this type. The benefit with this type is that it can act as a third-party owned but any profit is shared back to the owners. These types often tend to work well but can also be bad if substantial investments are needed.
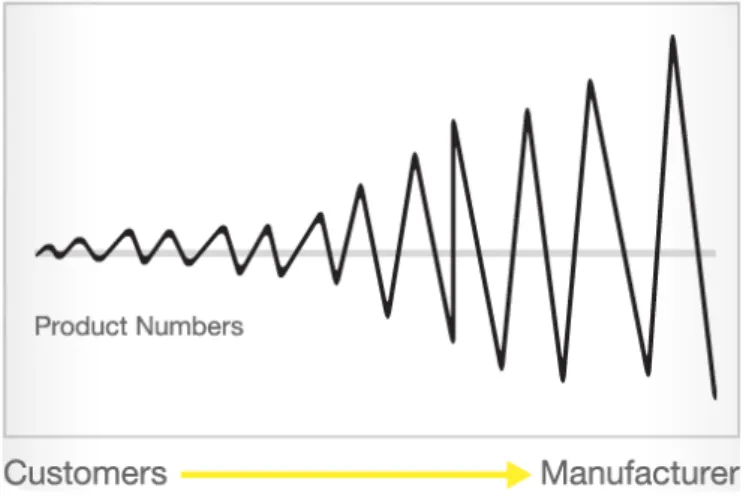
3.11. BULLWHIP-EFFECT
An important mechanism for the coordination of a supply chain is the flow of information between actors in the supply chain. These information flows directly affect production and inventory levels. The bullwhip effect means that demand will increase upstream in the supply chain and that the variety of demand will increase. When an actor downstream in the supply chain makes an order the next actor upstream use this order as information for production planning and inventory level further upstream. This information can be distorted and then mislead actors farther up the supply chain. For various reasons order upstream becomes greater
than the actual demand. Figure 6 illustrate the effect. Bullwhip-effect causes; overflowing storage, problems with quality, increased material costs, overtime costs, increased delivery costs and the capacity adjusted incorrectly (Lumsden, 2012 and Jonsson, 2008).
Figure 6: Illustration of bullwhip-effect.
Emergence of bullwhip effect is caused primarily by the 4 factors according to Fransoo & Wouters (2000);
Demand forecast updating: Links in the supply chain based their orders on the orders
received from the previous link downstream in the supply chain. An increased orders in also increases the forecast orders out and then moves to the next link upstream in the supply chain. In this way distorted information moves further upstream. One way to get around this is to give all players the real demand from end customer.
Order batching: Orders that come in to a supplier in the supply chain, reduces inventory
levels directly. But this does not mean that an order is added directly to the next upstream provider, but is accumulated first.
Price fluctuations: Offers and sales agreement, generating the product price to vary, this
increase fluctuations in demand. It is important to stabilize the price.
Rationing and shortage gaming: If demand is greater than the amount produced, the supplier
must ration their products to their customers. If the customer is aware of this fact, it becomes rational for the customer to order more than what the need really is.
3.12. CONFLICTING GOALS IN LOGISTICS
A logistics system aim is to have a high quality with regards to their goals and performance indicators. It is important to be aware of the nature of conflict that often exists when different departments at different levels have their own goals and performance indicators. As a result of these conflicts tensions can occur in the relationship between departments. In order to solve this, priorities must be made for the goals and performance indicators. What is important to aim for is to keep track of multiple variables and compare them to find the best overall performance.
For example increased customer service can often result in increased levels of inventory of finished products, thus capital is tied up. Another example is the one-piece flow which creates smaller loads but an increased number of shipments.
There are three different indicators that often are used to compare overall performance: customer service cost and tied up capital. These should be compared against each other and the goal is that if one of these is improved, it should not lead to a different variable deteriorate so that the overall performance deteriorates at least not unconsciously. Many companies have a
function-based organization which increases the risk that the different departments have a narrow view and focus solely on their own area. So called sub-optimization is common here. The trend today is that more and more parts are produced outside of the company and are ordered direct in to a certain assembly line, this means that the different functions get even a higher degree of independence and the importance of having good coordination becomes more important to reduce the risk of sub-optimization (Jonsson, 2008).
3.13. COST ALLOCATION
Costs can be divided into two major groups; direct and indirect, where direct costs are the costs of services and products that can be directly linked to a specific department. Indirect costs includes all other costs that are not direct, here you will find the cost of products and services that cannot be directly linked to a specific department, but concerns more or maybe all the units of a company. To divide the indirect costs so used some form of cost sharing method.
When the cost is shared, this cost is allocated over the departments that also generate is generating the cost, as all must contribute to the payment for the common resources. Zimmerman (1979) and Haskins & Crum (2001) cited in Lindgren & Weppling (2006) argues that companies must allocate the cost of the common resources in order to survive in the long term.
According to Kaplan (1992) should an organization cost allocate common costs in order to: • Managers and other employees must ensure that their activities impose costs. • Motivate both partners to constantly improve themselves.
• Educate managers and employees about their working methods, if it is not good. • Get them to act for the organization's benefit and not the individual department. • Remind department managers that the indirect costs exist and that the department's
profits must be used to cover both common expenses and their own expenses.
Positive effects can occur by using the allocations of the indirect costs such as motivating them to behave in a desirable direction. Allocation of indirect costs can create value when departments are linked together and that motivation is created in departments and spread among them through this allocation (Rajan, 1992).
3.14. CATEGORIZATION
Categorization is a very basic component of most theories, which are built out of our intent to by language sort up and understand the world. An example of a linguistic categorization is to express that something is long or short, and thus divide the world. But what is considered actually to be long or short? The problem in the real world is that things usually do not present themselves as clearly as we would like and then the classification into different categories is an urgent practical problem with the deepest philosophical dimensions in the foundation (Schröfl & Rajaee, 2011 and Llewelyn, 2003).
4. EMPIRICAL FINDINGS
This chapter will present empirical findings for this thesis work. This chapter is divided into four parts. The first parts consist of company description and Scania production system (SPS). Also describing the involved parts of the packaging material process. The second part will show the current state. It also presents the deviations encountered from current design of the system. The last two parts presents the results from the brainstorming for a new category list as well as a benchmark with Volvo Logistics Services and Volkswagen Logistics GmbH & Co.
4.1. SCANIA BACKGROUND
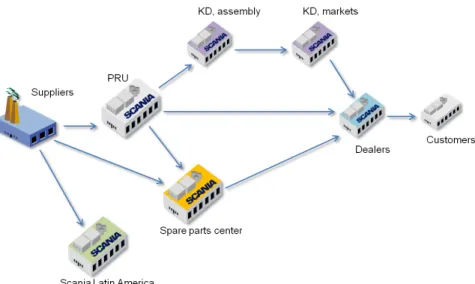
With 41,000 employees, Scania is a global company with sales and service organization in more than 100 countries. Delivering customized heavy trucks and buses, engines and services. Production units are located in Europe and Latin America.
Scania's head office is located in Södertälje Sweden. Manufacturing of components are found on three locations in Sweden, Södertälje, Oskarshamn and Luleå. Manufacturing of engines, gearboxes, retarders, transmission articles, and support, front and rear axles is done in Södertälje. While Lulea manufacture rear axle housing, bumpers, cross and side beams and Oskarshamn stands for the production of cabs for trucks. The assembly of chassis is in addition to Södertälje done in Angers, France, Meppel and Zwolle in Netherlands.
Operating income for 2013 was SEK 8.455 billion and with an operating margin of 9.7 percent. Heavy trucks are the core segment of Scania CV AB’s operations, being one of the largest producers in the world. Europe and Latin America is the largest markets with Brazil as the largest market for vehicle sales. Scania’s sales of products and markets are described in Figure 7 and Figure 8 below.
Other than trucks, Scania produces industrial- and marine engines as well as busses and coaches. An increasing focus on services has led to that financial and a maintenance solution for the customer, such as driver training, Scania Assistance, financial leases and insurance solutions has grown over the last years. Figure 7 and Figure 8 Shows Scania’s sales by products and by markets. (Scania AB, 2013)