Analysis of Merging Freeways with Decreasing Number of Lanes: A
Driving Simulator Study
Hammad Hussain Awan
Hasselt University (IMOB), Agoralaan, 3590 Diepenbeek, Belgium Phone: +32483145006 E-mail: hammadhussain.awan@uhasselt.be
Co-authors;
Ali Pirdavani; Hasselt University, Faculty of Engineering Technology, Agoralaan H, 3590 Diepenbeek, Belgium.
Tom Brijs; Hasselt University (IMOB), Agoralaan, 3590 Diepenbeek, Belgium.
* Corresponding author: Ali Pirdavani, Phone: +32 11 29 21 83, E-mail: ali.pirdavani@uhasselt.be
INTRODUCTION
The main function of freeways is to provide free flow of traffic at high speeds. Merging of two freeways should therefore be designed in a way that its impact on the free flow of traffic is minimized. There are two possible ways in which merging sections of freeway are designed. First, merging of freeways with same number of lanes (i.e. number of lanes in the merged freeway equals sum of the number of lanes of two merging freeways) and, second merging of freeways with decreasing number of lanes (i.e. number of lanes in the merged freeway is less than the total number of lanes of the merging freeways). In this study, merging with decreasing number of lanes is under consideration.
To design the merging section of freeways, usually the entire section is divided into three major subsections; ramp, acceleration lane and weaving section (AASHTO 2011). In the Dutch Standards named “Richtlijn Ontwerp Autosnelwegen (ROA 2014)”, along with the design specifications for individual elements of merging section, complete simplified designs are provided for merging sections with decreasing number of lanes for specific vehicle/capacity ratios and design speeds. In this study, we are investigating these designs in relation to the drivers’ behaviour.
Objectives of this research include: 1) studying drivers’ behaviour while driving through merging designs given in the Dutch Standards(ROA 2014) and 2) comparing the efficiency of the considered designs under various heavy traffic proportions.
LITERATURE REVIEW
Different studies have been conducted regarding various aspects of different components (ramps, acceleration lane and weaving section) of merging freeways. Torbic et al. (2012) studied main line freeway ramp terminals by observing on field data, human behaviour and then applied crash analysis on the data collected from field observations. They found that merging vehicle’s speed on taper acceleration lanes was closer to the design speed of main freeway compared with parallel acceleration lanes. Elefteriadou and Kondyli (2009) investigated drivers’ intended actions along a freeway-ramp merging segment under various scenarios. They concluded that the majority of participants would speed up and be more aggressive on taper ramps compared with parallel ramps. Hassan et al. (2012) adopted a probabilistic approach to determine the length of speed change lanes. He used First Order Second Moment method and simulation to calculate the length of acceleration lane and then compared them with field data. He also compared the acceleration lane lengths given in AASHTO (2011) and Canadian Highway Standards (TAC 1999) and found that acceleration lengths given in Canadian Highway Standards are longer than those given in AASHTO Green book. Iliadi et al. (2016) investigated the effects of different road geometry and traffic variables on weaving sections of motorways in the Netherlands. The results indicated that average annual daily traffic (AADT), percentage of weaving
vehicles, number of lanes on main motorway, weaving section length and its location have significant effects on crash frequencies of weaving sections.
De Blasiis and Calvi (2011) used driving simulator to observe drivers’ behaviour on various acceleration lanes with three different traffic conditions and two acceleration lengths. The study concluded that the required merging length, acceleration oscillations and number of gaps rejected were directly proportional to the traffic volume of the freeway. Sarvi et al. (2004) conducted a driving simulator validation study by observing freeway ramp merging phenomenon under congested traffic conditions. The results indicated a significant speed reduction immediately prior to the merging manoeuvre into the freeway lane in all trajectories. It was concluded that the driving simulator is a very useful data collection tool and can be very beneficial in the future investigation of driver’s ramp merging behaviour.
METHODOLOGY
ROA (2014) defines three freeway merging designs with decreasing number of lanes. These methods are categorized in order of preference by the ROA (2014) standard: (1) reducing the number of lanes on the left or right freeway before merging point, (2) reducing the number of lanes on the main carriageway after the merging point, and (3) reduction of the number of lanes at the location of the point of convergence by means of a taper design. The first method is the most preferable method according to ROA (2014) whereas in order to use taper method, the designers have to provide cogent arguments (such as lack of space etc.,) explaining why they would deviate from other standard merging designs and hence, is not usually recommended. In this study, the first method with lane reduction on the right-hand side freeway is compared with the taper solution. Figure 1 presents both these designs.
Three virtual simulations with a two-lane freeway 18.3 KM long containing two merging designs in randomized order with three heavy traffic compositions (0, 15 and 30%) were created in a driving simulator program STISIM Drive 3. In each simulation, merging designs were inserted in such a way that each participant drove through both designs twice in one run. As mentioned in ROA (2014), for these complete designs to be implemented, intensity to capacity ratio (I/C) has to be less than 0.7. Hence, intensity to capacity ratio was kept constant at 60% so that it is under the permitted limit.
The driving simulator used in this study was a medium-fidelity, fixed base driving simulator. It consisted of an actual car with a steering wheel, brake pedal, clutch and accelerator. Interior car functions such as music system, windows, GPS etc. were idle except turning indicators. Sounds of the driver’s vehicle, traffic in the environment were also present. Virtual environment was projected on a large 180 degree, seamless curved screen at a resolution of 1024 by 768 pixels and 60 Hz refresh rate. Driving simulator was set to automatic configuration and data was collected at frame rate.
52 participants with a valid European driving license volunteered for this study. After initial screening, data of 49 participants was used for analysis. Mean age of the participants was 31.13 years with age range between 20 and 52 years.
Results and Discussion
Data was extracted for 1.5km long section containing the merging designs and is divided into 75 zones of 20 meters long. The nose point of both designs (i.e. merging and taper) was considered as a benchmark and was named “Z0”. 20 zones were selected before and after “Z0”. Zones preceding benchmark were named N1, N2, …, N20 and later as Z1, Z2, ..., Z20. Two-way ANOVA was applied separately on each zone to find out the statistical significance of the truck traffic composition on dependent variables (i.e. speed, lateral position and longitudinal acceleration) individually. Due to the geometrical difference between the two merging designs, N20 till N15 are critical zones for the merging design whereas Z0 till Z5 are critical zones for the taper design. The reason behind this is that in the merging design, there is a lane reduction before the two freeway meet whereas in the taper design, lane reduction takes place within 250 meters after the nose. Results of the analysis are discussed as follows:
Speed: For the merging design, it was shown that for each zone, both traffic conditions and order of run have significant effects on driving speed. Post-hoc analysis revealed that there is a significant difference between 0 % heavy traffic and 30% heavy traffic for zones from N20 till N15. This difference was found to be negative as speed for 30% heavy traffic proportion was less than the speed for 0 and 15%. Figure 2a shows the difference in speeds for different heavy traffic percentages at N20. The cause of this decrease is due to the lane reduction before merging point, drivers had to follow the vehicles and overtaking was not possible. For the taper design, traffic conditions and order of run have significant impact on speed from zone Z0 till Z5. Post-hoc analysis shows that significant difference exists between the three heavy traffic ratios. In contrast to the merging design, the association between truck traffic percentage and driving speed is positive, meaning that drivers’ speed for the 30% truck condition was greater than the speed for 15 and 0% percentage conditions (Figure 2b). The reason is that in the taper design, drivers have the possibility to overtake the relatively slower heavy traffic along the taper section. Significant decrease of speed was found between first and second run but the speed profile among three truck traffic conditions were similar.
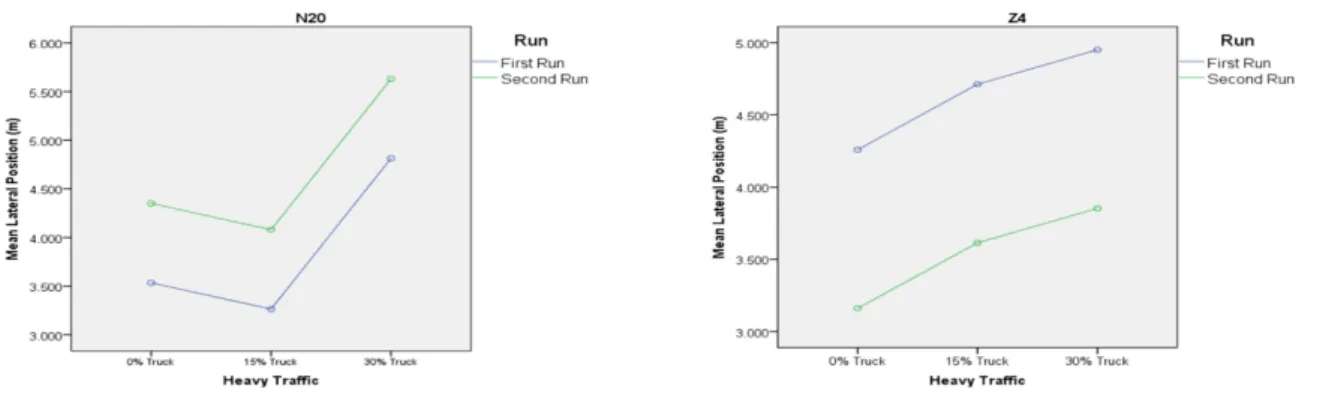
Lateral Position: For merging design also both of the independent variables have significant impact especially in the zones under consideration. Post-hoc analysis shows that value of lateral position increases with increase in truck traffic proportions as shown in Figure 3a. Zero represented centerline of the roadway and positive increase in lateral position value means that driver is away to the right of the median whereas decreased value means that driver is closer to the median. Order of run also has a significant impact. Drivers tend to drive away from the median and this difference is evident both in heavy traffic ratios and order of run. For taper design, from Z4 till Z20, significant difference was observed between truck traffic ratios and order of run. But in this case, drivers chose to drive closer to the median in second run and also in 0% and 15% heavy traffic ratios as shown in Figure 3b. For 30% of heavy traffic drivers chose to drive a bit away from the median. But in all conditions, they were driving in the left lane.
Acceleration: For merging design, heavy traffic ratio has a significant effect on acceleration in the five zones under consideration. For order of run, significant effect was observed in zones N18 till N15. Average acceleration in all these zones tends to decrease along in all heavy traffic ratios as shown in Figure 4a. But this decrease is maximum when heavy traffic ratio is 30%. The reason is that the drivers have only one lane to drive and due to heavy vehicles, they have to decrease their speed. For taper design, significant effects were observed for both heavy traffic ratios and order of run in zones under consideration. Average value of acceleration tends to increase with increase in heavy traffic ratio. The reason for this is the drivers have space to overtake the comparatively slower heavy traffic which they did. Acceleration values for merging design show drastic decrease which means that vigorous brakes were applied during those zones. This can increase the chances of collisions from behind. In taper design, there is also a drastic change in average acceleration but this change is positive i.e. values tend to increase.
Conclusions
Based on the results obtained from this study and data analysis performed to study effects of three different heavy traffic ratios and order of run for two merging designs, it is evident that all three dependent variables i.e. speed, lateral position and acceleration have significant effect. Merging design did not perform well as drivers applied hard brakes at the section of lane reduction. The manner of applying brakes was harder for 30% heavy traffic than the other two heavy traffic ratios. In taper design, there was no lane reduction and drivers tend to drive in overtaking left lane with increase in heavy traffic. This resulted in increased speed and acceleration values before merging. In summary we should highlight the fact that unlike the common intuitive understanding of designers, the merging design might be unsafe specifically when the proportion of heavy traffic increases. This conclusion should be further investigated by means of extended simulator studies or naturalistic driving tests to provide a better insight of the safety status of each design and to reveal their vulnerable elements.
Figure 4: Average acceleration for two designs for different heavy traffic percentages Figure 3: Average lateral position for two designs for different heavy traffic percentages
REFERENCES
AASHTO (2011). A Policy on Geometric Design of Highways and Streets, 2011, Aashto.
De Blasiis, M. R. and A. Calvi (2011). "Driver Behavior on Acceleration Lanes." Transportation Research Record: Journal of the Transportation Research Board 2248(-1): 96-103.
Elefteriadou, L. and A. Kondyli (2009). "Driver Behavior at Freeway-Ramp Merging Areas." Transportation Research Record: Journal of the Transportation Research Board 2124(-1): 157-166.
Hassan, Y., et al. (2012). "Probabilistic Model for Design of Freeway Acceleration Speed-Change Lanes." Transportation Research Record: Journal of the Transportation Research Board 2309: 3-11.
Iliadi, A., et al. (2016). A crash prediction model for weaving sections in the Netherlands, TRB.
ROA (2014). Richtlijn Ontwerp Autosnelwegen 2014. R. M. v. I. e. Milieu.
Sarvi, M., et al. (2004). "Freeway ramp merging phenomena in congested traffic using simulation combined with a driving simulator." Computer‐Aided Civil and Infrastructure Engineering 19(5): 351-363.
TAC (1999). Geometric Design Guide for Canadian Roads., Transportation Association of Canada, Ottawa, Ontario.
Torbic, D. J., et al. (2012). "Design Guidance for Freeway Main-Line Ramp Terminals." Transportation Research Record: Journal of the Transportation Research Board 2309(-1): 48-60.