Informing high school students
about smart industry using a
gamified AR-experience
Nicolina Orell
Interaktionsdesign Bachelor 22,5 HP Spring, 20182
Contact information
Author: Nicolina Orell E-mail: nicolina.orell93@gmail.com Supervisors: Elisabet Nilsson E-mail: elisabet.nilsson@mau.seMalmö University, Konst, kultur och samhälle (K3)
Patrik Markstedt E-mail: patrik.markstedt@cybercom.com Cybercom Group AB Examiner: Anne-Marie Hansen E-mail: anne-marie.hansen@mah.se
3
Abstract
The purpose of this thesis is to investigate how secondary high school students can be
informed about smart industry using Augmented Reality (AR) and gamification together with a physical component. This thesis is a collaboration between Cybercom and the project Smarta Fabriker (Smart Factories). The intended outcome of this project is as an AR solution part of the project Smarta Fabriker. To gather inspiration about student interests to act as a base for the design of the physical component included in this project, interviews were conducted. Six concepts for physical components were proposed and resulted in a combination of two of the concepts. To investigate the gamification part of the project, a workshop was held with students. The workshop data was used as a base for the game concept of this project. The final game concept together with the physical component was then tested with users through a final Virtual Reality (VR) prototype to determine the outcome of this project. Main results were positive and most of the students could see themselves using the intended AR solution of this project.
4
Acknowledgements
I would like to thank Patrik Markstedt at the Cybercom office in Göteborg, for guiding and supporting me in my work and helping me with various challenges in the design process. I would also like to thank Elisabet Nilsson, my supervisor, for providing me with support and the help I needed.
Lastly, a huge thanks to the students participating in the different activities throughout this project!
5
Table of contents
Figure list ... 8 Acronyms ... 10 1. Introduction ... 11 1.1 Research area... 11 1.2 Aim ...12 1.3 Research question ...12 1.4 Limitations ...12 1.5 Target group ... 13 2. Background/Theory ...142.1 Smart industry (the fourth industrial revolution) ...14
2.2 The project Smarta Fabriker ...14
2.3 Augmented Reality ... 15
2.3.1 The Microsoft HoloLens ...16
2.4 Related work ... 17
2.4.1 Augmented reality for safety in industrial environments ... 17
2.4.2 Spatial augmented reality in smart factories ... 18
2.4.3 SOPHOS-MS ... 18
2.4.4 Investigating Student Attitudes toward Augmented Reality ...19
2.4.5 Environmental detectives ... 20
2.4.6 Conclusions and insights ...21
2.5 Gamification ... 22
3. Methods ... 23
3.1 User-Centered Design ... 23
3.2 Literature research ... 23
3.2.1 Applying literature research ... 24
3.3 Semi-structure interviews ... 24
3.3.1 Applying semi-structured interviews ... 25
6
3.4.1 Applying data analysis ... 26
3.5 Workshop ... 26
3.5.1 Brainwriting ... 26
3.5.2 Crazy 8s ... 27
3.5.3 Combining Brainwriting and Crazy 8s ... 27
3.6 Prototyping ... 27
3.6.1 Medium-fidelity wireframe ... 28
3.6.2 High-fidelity prototype ... 28
3.6.3 Applying prototyping ... 28
3.7 User testing ... 28
3.7.1 Applying user testing ... 29
3.7.2 Think aloud protocol ... 30
3.8 Ethical considerations ... 30 4. Design process ... 31 4.1 Semi-structure interviews ... 31 4.1.1. Analysis of interviews ... 32 4.1.2 Interview results ... 33 4.1.3 Concept ideation ... 34
4.1.4 Building the physical component ... 39
4.2 Workshop ... 39
4.2.1 Analysis of workshop ... 40
4.2.2 Game concept ideation ... 42
4.3 Prototyping ... 43
4.3.1 Instructions ... 43
4.3.2 Full concept ... 44
4.4 User testing ... 46
4.4.1 Testing of instructions ... 46
4.4.2 Testing of the final concept ... 47
7
6. Evaluation / discussion ... 51
7. Conclusion... 55
7.1 Implications for future research ... 55
References ... 57
Appendix I: Interview pictures ... 60
Appendix II: Interview questions ... 62
8
Figure list
Figure 1. The Microsoft HoloLens (Greenwald, 2016) ...16
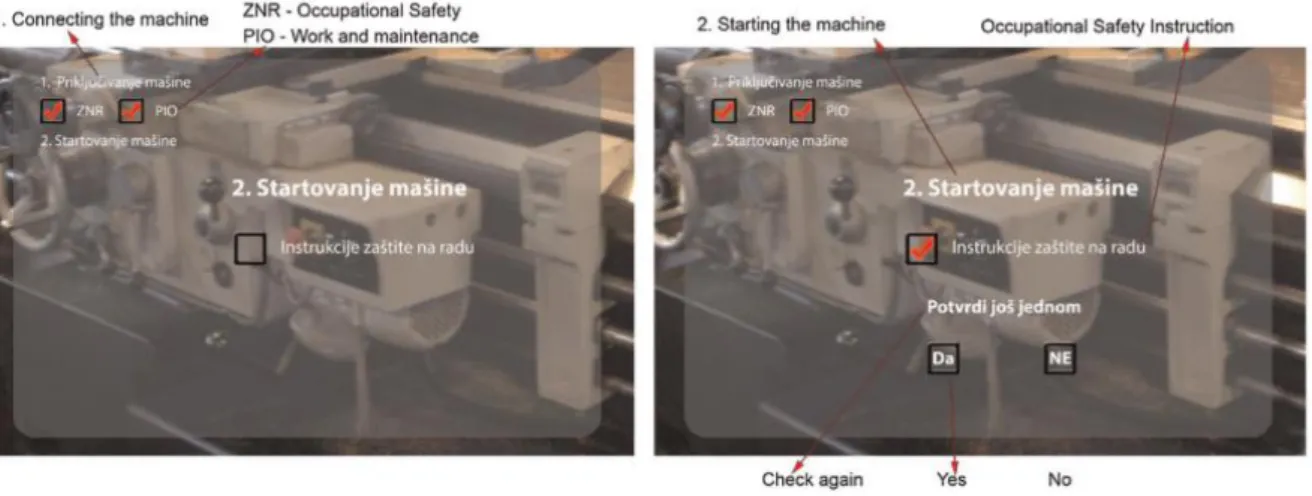
Figure 2. The interactive checklist described by Tatić & Tešić (2017). ... 17
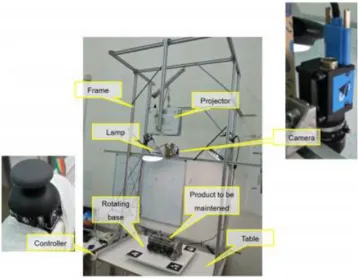
Figure 3. A prototype of the SAR workbench (Uva et al., 2017). ... 18
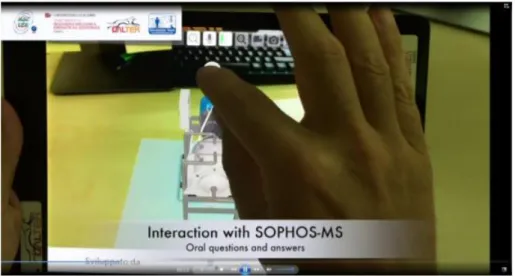
Figure 4. Interaction with the SOPHOS-MS system (Longo et al., 2017). ...19
Figure 5. SpaceAR that was used to investigate student attitudes to AR (Sirakaya & Kiliç Çakmak, 2018). ... 20
Figure 6. Environmental detectives in a virtual version (Klopfer, 2008). ...21
Figure 7. Description of the process followed in this project. ... 31
Figure 8. Photos of the semi-structured interviews with users. ... 33
Figure 9. Concept visualization of locating a stop in one of several pipes. ... 34
Figure 10. Concept visualization about test running a machine. ... 35
Figure 11. Concept visualization of getting an overview of a factory. ... 36
Figure 12. Concept visualization of reaching a certain level on a meter by completing tasks. ... 36
Figure 13. Concept visualization of making a marble travel through several tasks to make it reach the end. ... 37
Figure 14. Concept visualization of building your machine by placing parts. ... 38
Figure 15. Concept visualization of my final idea. ... 38
Figure 16. The physical component designed based on the concepts from the interviews. ... 39
Figure 17. Material produced by users during the workshop. ... 40
Figure 18. Mind map of important aspects in a game based on workshop results. ...41
Figure 19. Mind map of aspects I was able to include in the gamification design. ...41
Figure 20. Mind map of game ideas that derived from the workshop results. ... 42
Figure 21. The prototype alternatives where the user received instructions through a checklist. ... 43
Figure 22. The prototype alternative where the user received instructions one by one. ... 44
Figure 23. Start of VR prototype. ... 45
Figure 24. VR prototype where the placement of the gears is visible like a mask. ... 46
Figure 25. The tools used in the final user test. ... 48
Figure 26. The last view in the VR prototype, showing your score. ... 50
Figure 27. Pens (Betts, n.d). ... 60
Figure 28. Motorcycle (Putta Gunawan, n.d). ... 60
Figure 29. Videogame (JESHOOTS.com, n.d). ... 60
Figure 30. Drone (NeONBRAND, n.d). ... 60
9
Figure 32. Wrist watch (Wingen, n.d). ...61
Figure 33. Intertwining roads (Ishan @seefromthesky, n.d)...61
Figure 34. VR headset (Henry, n.d). ...61
Figure 35. Cockpit (Leipelt, n.d). ...61
10
Acronyms
AR – Augmented Reality VR – Virtual Reality VE – Virtual Environment UCD – User-centered Design UI – User Interface
11
1. Introduction
Most fields are adapting to new technology. We see cashiers getting removed by self-serving machines in supermarkets and computers taking over various other jobs. One area where the Swedish Government has decided to make efforts in new technology is the industry
(Regeringskansliet, 2016). They mean that the technology changes the competitive conditions of the industry as well as opening up for new markets. The project Smarta Fabriker (Smart Factories) is aimed at inspiring people to work or study within the context of smart industry, mainly youths (Smarta Fabriker, n.d.). They mean that this new field needs the right
competency to be able to compete against the rest of the world.
This thesis investigates an Augmented Reality (AR) solution that could be used in a smart factory context but shows the technology in a way that aims to inform. Therefore, the outcome of this project is not intended to be used directly in a factory, but to be used as an exhibition for how AR can be applied when solving a problem with a machine in a factory. This thesis is a collaboration between Cybercom and the project Smarta Fabriker, which are the stakeholders of this project. The users are high school students that come to visit the Smarta Fabriker exhibitions. In order to inform high school students about smart industry through AR, I have investigated how a gamification approach could be useful in order to create a fun and engaging experience. Gamification mixes aspects from a game like dynamics and mechanics into an experience that is not within a game context usually (Pratt and Nunes, 2012). To inform students about smart industry, a physical component representing a
machine part has been investigated and created in this project. The research question this thesis aims to answer is: How can gamification through Augmented Reality combined with a physical component, be applied to inform students in secondary high school about smart industry? This report goes through the thesis background theory and related works, the methods applied for this project, the design process, the results from the design process, and finally a discussion and conclusion of the final solution.
1.1 Research area
The Swedish government presented a new industrial strategy in January 2016 where a smarter, more sustainable industry should provide smarter workplaces where automation and humans cooperate which in turn create high competitiveness (Smarta Fabriker, n.d.). The project Smarta Fabriker started their platform in order to spread knowledge about industrial digitalization to in turn attract youths to technical studies and to work in the
12 industry (Smarta Fabriker, n.d.). This study explores how gamification and augmented reality can inform students in secondary high school about smart industry. The project is executed through Cybercom and aimed for the GTC (Göteborg Technical College) project Smarta Fabriker and their exhibitions. The project Smarta Fabriker will be further explained in section 2.2.
1.2 Aim
The purpose of this thesis is to find an engaging way for students to receive information about smart industry by using a gamification approach and AR technologies combined with a physical component. The project is conducted in collaboration with the project Smarta Fabriker, which aims at to inform and inspire students about the new smart industrial strategy and to work within the industry (Smarta Fabriker, n.d.). Thus, this aim is grounded in the project here presented.
1.3 Research question
How can gamification through augmented reality combined with a physical component, be applied to inform students in secondary high school about smart industry?
1.4 Limitations
As this project is divided in two parts through Cybercom, usability and development, I will only be focusing on the usability and user research of this project. The other part of the project is executed by two computer engineering students doing their thesis focusing on the final AR solution, based on my design proposal of this project. As the developers are to be finished with their solution later than my project, the final solution will not be able to be tested by me. Therefore, a prototype of the final solution will be tested with users to be able to answer the research question of this project. Based on limitations from the stakeholders the physical component developed in this project needs to be portable to be able to transport it easily by Smarta Fabriker. The reason for this being that they want to be able to bring it to locations such as fairs or conferences.
13
1.5 Target group
This thesis focuses on students in the ages 16-18, studying in secondary high school. The Smarta Fabriker exhibitions get visitors from the industry, high school students, and younger children1. Focusing on such a large target group, ranging from small children to adults in all
ages, could make it difficult to adapt the solution to the entire target group. Because high school students are the ones nearest future decisions like choosing studies or work, that age range made the most sense for me to work with as a target group. For that reason, informing high school students about smart industry could make the most impact on them in making life decisions and supporting the Smarta Fabriker project aim.
14
2. Background/Theory
2.1 Smart industry (the fourth industrial revolution)
The Swedish government (Regeringskansliet, 2016) has brought out a strategy for Sweden to become the leading country in the world for new digital industrialization to get a sustainable and modern industrial production. The production should be flexible, smart, resource
effective and also provide an attractive work environment. The Swedish Government strategy will contribute to strengthening the industry’s competitiveness and make investments within the Swedish industry more attractive. Digitalization contributes with opportunities to
develop a new, more sustainable and smarter industry. More sophisticated digital technology and the changes that it brings has given rise to the concept of the fourth industrial revolution. In order for Sweden to be able to take advantage of the opportunities from the fourth
industrial revolution (industry 4.0) as well as the green transition globally, Sweden has to take the lead according to Regeringskansliet (2016).
Embedded and online systems are on their way to revolutionize the industry, you can communicate with the surrounding environment when you can connect to the internet and the line between real and virtual is therefore removed. Machines and components are able to communicate in the smart factory and the development is going in a direction where an autonomous production can be adapted to customer wishes individually. An important component of the smart factory is the automatization claims Regeringskansliet (2016). They also mean that the digitalization will increase the interaction between customer and citizen, this will in return put new demands on the companies, opening up for new business models. Smart workplaces will be enabled by the digitalization and where humans co-operate with machines which creates high competitiveness. Regeringskansliet (2016) mean that jobs that are now being automated are disappearing, but the digitalization also create new job
opportunities.
2.2 The project Smarta Fabriker
The project Smarta Fabriker is a collaboration between school and enterprise (Smarta Fabriker, n.d.). Smarta Fabriker is driven by GTC (Göteborgs Tekniska College) where the different actors are organizations, academia, companies, and schools. Their aim is to have a platform to create competence and to spread knowledge about industrial digitalization, as
15 well as building two mini factories with the help of students supervised by companies. The mini factories are used for activities that connect to competence within the industrial digitalization. In order to inspire young people to start technical studies and to create role models for them, one idea with the project is to engage students in developing and building within the factory. Smarta Fabriker develop projects in the context of their factory for students in universities doing their thesis, interns, and secondary high school students. Smarta Fabriker (n.d.) estimate to have about 21 000 hours of student work in total. The Smarta Fabriker factory is constructed by students with the supervision of companies. The factory manufactures VR-headsets out of cardboard, that the visitors can watch VR-videos through via the project app (ibid).
2.3 Augmented Reality
Kipper and Rampolla (2012) describes augmented reality (AR) as “a variation of a Virtual Environment (VE), or Virtual Reality (VR) as it is more commonly called” (p. 1). In
comparison with VR, that gets a user completely immersed in a virtual world where she is not able to see the real surrounding environment, AR overlays virtual elements on the real
environment. Kipper and Rampolla (2012) describes AR as a technology that is mostly used to enhance the visual sense but that it is possible to use it to enhance all the senses. Kipper and Rampolla (2012) explains how AR needs to have three existing features; the virtual information and the real information needs to be united, the interactivity happens in real time, and is functioning and used within a 3D setting. Information that is otherwise not able to be seen could be solved using AR. Kipper and Rampolla (2012) describe AR as a
technology that uses several technologies combined where digital information becomes visual.
There are several examples of “digitally enhanced media” (Kipper and Rampolla, 2012, p. 4) that is not Augmented Reality but might be believed to be. For example, movies that include virtual 3D objects in the surrounding environment blended together, is not AR. Another example is images that have been mixed with in Photoshop, does not constitute as AR either. In order to use AR there is a need for an appropriate device. Syberfeldt et al. (2017) describe three categories of devices that enables the user to interact with and see the virtual objects in the system. Devices that are head-worn, in the form of glasses, enables a user to see video optics when a user’s view is completely digital where the digital and the real environment are fused together in one view. It is also possible to get an optical view with this device, this means that the view of the real world gets virtual objects overlaid right on top. Another type
16 of optic that is possible with a head-worn device is Retinal optics where a retina with low power laser light projects virtual object right on top of the retina. For hand-held devices the optics available are video and optical. Spatial devices either uses a projection optic or a hologram optic, where the projection optic projects virtual objects on objects in a real-world environment with a digital projector, the hologram optic uses a “photometric emulsion” (Syberfeldt et al., 2017, p. 9120), this then records intrusion patterns of connected light.
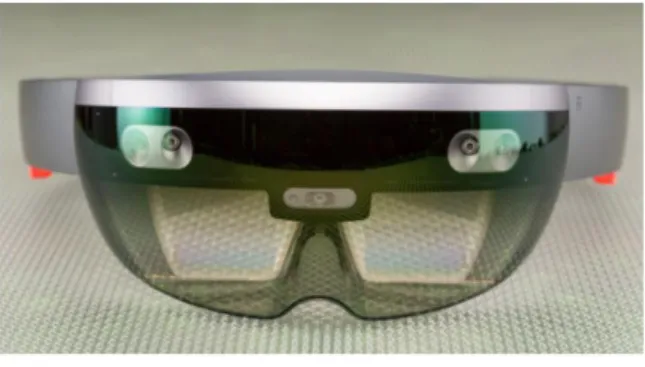
2.3.1 The Microsoft HoloLens
Figure 1. The Microsoft HoloLens (Greenwald, 2016)
The AR platform intended to be used in this project is the Microsoft HoloLens. The Microsoft HoloLens (see figure 1) lets you see through its glass completely and projects holograms on top of the surrounding environment (Greenwald, 2016). The HoloLens combines virtual elements, like 3D models or floating application windows, with the real world. It is a
Windows 10 system, functioning completely on its own. The HoloLens is made up of a visor that is transparent as well as a thick band for placing around the head.
The HoloLens is controlled using gestures or an included Clicker peripheral. In the field of view is a cursor that lets you click on what you are looking at. According to Greenwald (2016) the downsides to the HoloLens is that it is quite large, that is not very comfortable and that the field of vision being quite limited. The upsides of the HoloLens are that it is an example of impressive technology as well as the device being self-contained and can run applications around you that turn your surrounding environment into a desktop. It can also project effects that will follow the walls or physical objects accurately (ibid).
17
2.4 Related work
2.4.1 Augmented reality for safety in industrial environments
Tatić and Tešić (2017) present a system for potentially preventing injuries in a factory environment. The system makes use of augmented reality technologies to reduce error rate and risk factors. Through a mobile device, instructions for how to operate or maintain a factory component, are displayed via augmented reality. Step-by-step instructions leads the factory worker through safety precautions and work procedures by an interactive check list (see Figure 2). To prevent missed steps, the system goes back to the previous step if a confirmation of a procedure is missed because of an incomplete step, a skipped step or incorrectly performed step. Then the step must be correctly completed before moving on to the next one.
Tatić and Tešić (2017) describes how they differentiated three types of factory workers: Less skilled, qualified, and highly qualified. Depending on the skill of the worker, the augmented reality instructions became different to suit the worker, giving more comprehensive
instructions to a less skilled worker and less instructions to a highly qualified worker for example. The reason for this was to reduce the number of security checks and because it is assumed that the highly qualified worker performs their tasks quicker (ibid).
18
2.4.2 Spatial augmented reality in smart factories
Uva et al. (2017) investigates the use of spatial augmented reality (SAR) in a smart factory. They were particularly interested in the completion time of tasks, comparing SAR
instructions to paper instructions. A prototype intended for a manual working station was then designed (see Figure 3). Uva et al. (2017) describe how they believe that AR will be more largely used in the future by companies to improve employees work procedures as well as decision making.
Uva et al. (2017) expresses problems with both head mounted displays and handheld devices. For example, head mounted displays can be heavy with low resolution in some cases, and handheld devices might limit the worker to operate properly. Uva et al. (2017) suggest SAR as a possible solution to solve those issues. Instead of wearing or holding the display, SAR uses digital projectors. Uva et al. (2017) designed a workbench to solve potential issues with e.g. surface-based distortions, brightness, contrast, and visibility of projection. They claim to have participants first try to solve a task with instructions on paper and then with
instructions through SAR. The results showed that the SAR instructions proved to be better than the paper instructions. Both in completion times and in error rates (ibid).
Figure 3. A prototype of the SAR workbench (Uva et al., 2017).
2.4.3 SOPHOS-MS
Longo et al. (2017) present a practical solution for the increased complexity that human operators face in their daily work tasks as Industry 4.0 takes its shape. According to Longo et al. (2017) there is a need for solutions that, embedded in an everyday working environment, can combine intricate methods with usability that has high requirements. Taking this into consideration, Longo et al. (2017) developed a practical solution called SOPHOS-MS. Sophos
19 is Latin for wisdom and MS stands for manufacturing systems. Their framework proposes an approach that combines technical, health and organizational features with making human resources to be a part of the industry 4.0 design to gain profit.
Their solution is extending the operators abilities where a digital assistant that can be
interacted with using voice commands and then answer questions about tasks, equipment or procedures asked by the operator (see Figure 4). Longo et al. (2017) explain that the solution should work as a knowledgeable expert, by providing the operators with the information they need. Longo et al. (2017) compared operators that had been trained by the SOPHOS-MS to operators who had been trained traditionally. The results showed that the operators that had been trained by SOPHOS-MS outdid the operators with traditional training. Longo et al. (2017) has an idea about using SOPHOS-MS for monitoring in real time as well as controlling production for supporting preventive maintenance.
Figure 4. Interaction with the SOPHOS-MS system (Longo et al., 2017).
2.4.4 Investigating Student Attitudes toward Augmented Reality
Sirakaya and Kiliç Çakmak (2018) have investigated the attitudes toward AR applications of secondary school students and also how their attitudes change giving different variables. They have also investigated the relation between achievement and AR and the attitudes towards this. Piaget (1976) in Sirakaya and Kiliç Çakmak (2018) claim that secondary school students learn things easier when they actually see them. They explain that they think AR applications are becoming more common as well as extensive in teaching students, based on studies of using AR with secondary school students.
20 According to Sirakaya and Kiliç Çakmak (2018) in order for AR practices to meet the
intended school outcomes and spreading, the student attitudes to AR will be important. The study was conducted on 54 7th graders in separate classes in a state school. During 16 lessons
over a period of four weeks students were provided with an AR experience. The AR application used was SpaceAR (see Figure 5) by Sirakaya (2015) in Sirakaya and Kiliç
Çakmak (2018). SpaceAR includes 22 activities in AR that that are based on activities from a 7th grade science and technology class textbook.
The research findings by Sirakaya and Kiliç Çakmak (2018) demonstrate positive attitudes to AR applications of students. The result is believed to relate to AR application advantages in educational settings. The difference from traditional materials is believed to have a positive effect on the students attitudes that AR brings to the classroom environment. Sirakaya and Kiliç Çakmak (2018) found that students playing computer games frequently, did not have equally as positive attitudes to AR as students who did not play computer games frequently. Sirakaya and Kiliç Çakmak (2018) end by stating that the general result of their study shows positive attitudes by students toward AR applications and that AR applications therefore can be used with student groups of different variations for educational purposes.
Figure 5. SpaceAR that was used to investigate student attitudes to AR (Sirakaya & Kiliç Çakmak, 2018).
2.4.5 Environmental detectives
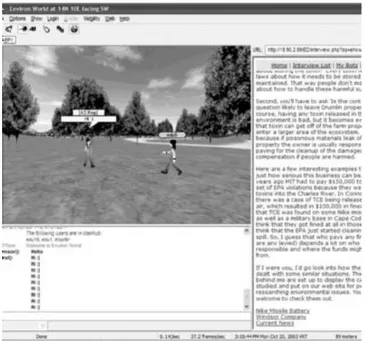
Environmental detectives (see Figure 6) is a handheld augmented reality game that teaches students about environmental issues (Klopfer, 2008). The game has a light incorporation of augmented reality as it gives the player some virtual information occasionally that has to be integrated by them with the real-world. The game combines social interactivity with
portability, connectivity, individuality, and context sensitivity that together makes for an engaging as well as authentic location-based game.
A particular problem for in-training was identified by consulting environmental engineers. They found that engineers new to their field often struggle with finding secondary and
21 primary information during their investigations. This skill was attempted to be taught in class, but as the skill could only be learned through practice it was difficult. Instead to teach this skill through a game that was set in the real world seemed perfect. The students playing the game were given a brief description telling them that during the construction of a building on campus, a groundwater test had shown indication of chemical. In order to determine the origin of the chemical they, as a team of environmental engineers, had been brought to the campus. They were also to determine what legal and health consequences it had, as well as how far the chemical had gotten, and what actions the university should take. The main tools the students could use in the game were: electronic documents, virtual interviews, and virtual samples. Klopfer (2008) argue that these types of games enable a rich ground to learn about sense-making, data collection, and analysis.
Figure 6. Environmental detectives in a virtual version (Klopfer, 2008).
2.4.6 Conclusions and insights
These are some of the insights from previous research and related work that I will continue to build upon in this project. Comparing the interactive checklist developed in the project by Tatić and Tešić (2017) to other ways of receiving instructions could perhaps uncover different ways of instructing as the alternative presented by them might not be the best solution. The distinction Uva et al. (2017) makes about their SAR solution and paper instructions was a discussion we had with the stakeholders, to be able to demonstrate the fast pace of using AR instead of getting instructions on paper.
22 The examples of related work have acted as a base for inspiration in seeing the many ways of incorporating AR into an industrial setting. As students are the intended users in this project, looking at examples of applying AR in an educational environment as well as the attitudes towards AR as a method was useful as inspiration for this project. Sirakaya and Kiliç Çakmak (2018) found that students who played computer games more frequently were not as positive toward AR as students who did not. The application of gamification to this project might provide that user category with an aspect where they might recognize themselves. By using the study by Sirakaya and Kiliç Çakmak (2018) as a base for students’ attitudes toward AR can limit the research I need to do in that field, in assuming that the students find AR an interesting tool. The example by Klopfer (2008) where an AR game is used to teach students about their field of study in a more engaging way as well as practice of their working tasks, makes a good example of how real aspects can be incorporated into a game. As this project should incorporate real aspects as well, to build upon the real aspects and the way the user solves problems, it might be useful.
2.5 Gamification
Gamification can be used to create an engaging and motivating product (Pratt and Nunes, 2012). In order to improve the experience, gamification mixes aspects from a game like dynamics and mechanics into an experience that is not within a game context usually. Pratt and Nunes (2012) are convinced that gamification could give you effective outcomes. In order to distinguish the difference, Mora et al. (2015) make a comparison between game design and gamification design elements and their purpose. They mean that game design is intended for entertainment purely, whereas gamification is used to make the engagement in an experience enhanced. Marczewski (2014) in Mora et al. (2015) explain how the enjoyment in game design features differs from the gamification aspect where the purpose is more business oriented. The connection between game design and gamification is rather thin explains Mora et al. (2015), as there will always be a difference in the creation process. However, the game design theory principles are used in gamification.
23
3. Methods
3.1 User-Centered Design
The approach assumed in this project is User-Centered Design (UCD). Pratt and Nunes (2012) defines UCD as “a design philosophy that puts the user of a product, application, or experience, at the center of the design process” (p. 12). They describe a designer’s work in UCD as to comprehend in detail what the user wants, needs, and what limitations the users have, to then include this in the design choice. Pratt and Nunes (2012) stress the importance of testing the design with the actual users and not only analyze and try to predict the use of a product. This because designers are often not able to understand the users in how they use, comprehend, and perceive their design. Taking the users’ needs and wants into consideration and having the user central in the design process will increase the possibility that the
interactive product will be more successful and easier to learn. Although, Pratt & Nunes (2012) continues by explaining how no interaction design project is completely user centered, for a project to be completely user centered the only things considered would be the goals, needs, and wants of the user.
Abras et al. (2004) refers to UCD as “a broad term to describe design processes in which end-users influence how a design takes shape” (p. 1). Abras et al. (2004) describe how the
important part is that the user is involved in UCD in some way, but that there are many different ways a user can be a part of a UCD process. Abras et al. (2004) gives an example of how in some cases the users are involved at specific times in a design process and at other times the user might be involved throughout the design process as partners. In the case of this project, users have been involved throughout the design process at specific times. However, the users have not been a part of the design process as partners, like described by Abras et al. (2004). The involvement of user has happened through: interviews, a workshop, and two user testing opportunities.
3.2 Literature research
Cooper et al. (2014) describe how a literature review is relevant to a design team because they can use it as a basis for their development of questions to stakeholders and subject matter experts (SMEs). They also mention how it can be used to develop a vocabulary and additional domain knowledge to compare to user data. Baxter et al. (2015) stresses the importance of doing research of existing products, the domain of the project and the target group before
24 project initiation. The reason for this, mean Baxter et al. (2015), is to not duplicate the work and knowledge.
3.2.1 Applying literature research
A proper literature review was not conducted during this project as described by Cooper et al (2014), but the research for relevant information in the form of previous work, background theory, and appropriate methods was made. The reason for this was to understand the topic better as well as finding previous problems or use in similar projects where the same
technique or context of use was applied. Like the reasoning Baxter et al. (2015) makes, the related work found in my research did not entirely compare to this project. The related work that was found had more to do with applying AR solutions to the industry or AR learning solutions, rather than informing secondary high school students about smart industry. Research of relevant literature was made throughout the project process when new problems or need for information arose.
3.3 Semi-structure interviews
Wilson (2013a) defines semi-structured interviews as a combination between questions that are predefined and questions that are open-ended. Baxter et al. (2015) describe
semi-structured interviews as an interview that may start with a set of defined questions, either closed-ended or open-ended, but may depart from the questions and their order any time during the interview. An interview guide or schedule is often used in a semi-structured interview where the interviewer introduces the topic and purpose of the interview, topics and questions in list form about each topic, suggestions of prompts and probes, and lastly some closing comments (Wilson, 2013a). Wilson (2013a) describes that the general goal of semi-structured interviews is to use a set of predetermined topics but allow some exploring if new subjects arise (ibid).
Baxter et al. (2015) states both pros and cons with a semi-structured interview, the pros being that it gives you both quantitative and qualitative data, a chance to follow up and some detail. The cons being that it might take longer to analyse the data, and it is not consistent in the same way as a structured interview. Baxter et al. (2015) recommend keeping interview
questions short with 20 words or less. The reason for this being that too long questions might limit the participants in remembering the question. Baxter et al. (2015) also suggest that to introduce more than one issue in a question might be confusing for the participant. Wilson (2013) also suggest not asking double questions and instead breaking those into two.
25
3.3.1 Applying semi-structured interviews
Semi-structured interviews were conducted using a few predefined questions (see Appendix II) with open ended questions and 10 pictures (see Figures 27-36 in Appendix I). The questions followed the description of semi-structured interviews by Wilson (2013a) and Baxter et al. (2015). The pictures used in the interviews depicted different content which had been estimated as possibly interesting for the students and relatable to industry in some way. This to act as a base for inspiration of the physical component.
3.4 Analysis of data (transcription, categorization &
translation)
Marshall (1997) explains how data that has been collected needs to be made sense of and mentions several techniques for doing this. He begins by mentioning that only giving you information about one variable does not tell you how the variables are connected to one another. One technique he mentions for this purpose is “The frequency count” (p. 65). The frequency count is about counting the times where a criterion is confirmed. Marshall (1997) describes this as being used first most times as it acts as a base for other statistical
techniques. Baxter et al. (2015) stresses the importance of analysing the data from your first interview to make sure that you are getting the results needed or if you have to correct your questions. Analysing data after each interview is recommended by Baxter et al. (2015) for UX professionals because it could give the interviewer insights for the coming interviews.
However, for some academic studies, it might be better suited to conduct all the interviews before analysing the results “because it increases standardization across interviews” (p. 252). The longer you wait to analyse the data the less you will remember, and the notes will not make as much sense. Therefore, you will be more dependent on the recordings. This will make the process of analysing data longer. The quicker you start analysing the data after the session, the quicker you will be done with the review of your recording. Baxter et al. (2015) describes three different ways to transcribe data: “verbatim, edited, or summarized” (p. 253). Verbatim is when you transcribe every detail of an interview and do not leave out words like “hmm” or misstatements. Edited is when you do not transcribe the misstatements or words expressed in thinking or agreeing for example. Summarized is when you transcribe a version of the interview that is more condensed and edited (ibid).
26
3.4.1 Applying data analysis
The analysis of the data gathered from the interviews and the workshop with users was analysed by first transcribing the data, then categorizing the data, and then translating the data. The transcribing was done using either video-footage or audio-recordings and
transcribing the interviews word by word and translating it from Swedish to English in the way Baxter et al (2015) refers to as Verbatim. The categorization of the data was done by sorting each picture and what had been said about that picture, as well as how many times the picture had been chosen. The translation of the data was used by looking at how the data could act as a base for formulating concepts for the physical component.
The analysis of the data from the workshop (described in the next chapter) was analysed by going over each sketch and then transcribing a short description of each sketch. As the description of the sketches were already written down by the users they only had to be copied. The data was then categorized into aspects that I could use, then made up to gamification ideas.
3.5 Workshop
3.5.1 Brainwriting
Brahm and Kleiner (1996) in Wilson (2013b) refers to brainwriting as a method used to generate ideas quickly where participants write down ideas on paper, the ideas are then exchanged to another participant. Instead of people shouting out their ideas as in
brainstorming, participants write down their ideas individually. An advantage to brainwriting compared to brainstorming is that instead of an experienced facilitator, anyone can facilitate a brainwriting session and still get a valuable result. Wilson (2013b) present two types of brainwriting: individual and interactive. The differences are that the individual is more private with no interaction with other participants whereas the interactive is more social and the participants get to pass their ideas to another participant who then add ideas. Wilson (2013b) suggest that you should use brainwriting when you want to produce ideas with quite large groups of people. He also argues that you can use brainwriting with groups of people that might not get along or with people who are quieter.
27
3.5.2 Crazy 8s
Crazy 8s is an exercise where you quickly sketch eight variations of an idea in eight minutes (Knapp et al., 2016). The purpose of this exercise is to start thinking about alternatives of your original idea or to make the original idea better. The word “crazy” in Crazy 8s refers to how rushed the exercise is. The ideas you produce should be the ones you believe in, tweaked or expanded. Knapp et al. (2016) describes the execution of the exercise as beginning with folding a paper in half until you have eight squares, you then get one minute for each sketch and when eight minutes has passed you should have ended up with eight sketches. The idea is that the sketches should be messy and with only one minute to complete each sketch they are not going to end up perfect. Knapp et al. (2016) recommends using this exercise to elaborate on one idea and that is when it works the best. Crazy 8s can be used as a warm-up before something else and the purpose is mostly to consider other ideas than the original one (ibid).
3.5.3 Combining Brainwriting and Crazy 8s
The workshop that was conducted in this project used a combination of the two methods described above. The workshop was conducted at Polhemsgymnasiet during an art class with 12 participants, all 18 years old. The exercise in this workshop related to Wilson (2013b) in the way students got to brainstorm ideas individually, but instead of writing them down they were asked to sketch them. For clarifying purposes, they were asked to write a short
description as well after the exercise was completed. The students got asked to try and produce eight ideas and sketch them in eight squares in relation to the description by Knapp et al. (2016).
3.6 Prototyping
Arnowitz et al. (2007) describes prototyping as a method that visualizes requirements instead of describing them. They mean that they guarantee success because the software
requirements are clear. Instead of re-programming software, prototyping that is executed properly allows for changes to be made without wasting time and effort. Arnowitz et al. (2007) explain how both big and small concepts can be tested. The bigger concepts would, by testing, get reactions from users to which design direction to take and also let the designer make improvements on the detailed design. To test a more refined concept could provide data of how to continue with the detailed design. It could be even more effective when comparing it to similar use alternatives.
28
3.6.1 Medium-fidelity wireframe
Still and Crane (2016) explain that a medium-fidelity wireframe is the step after paper prototyping. A paper prototype is of low-fidelity and does not require much effort in making it. The wireframe should only show the layout of the interface, the skeleton, and using color is unnecessary. Still and Crane (2016) describe that you only want to present the user with what the product can give them. After receiving feedback from users, the designer can move on to creating a high-fidelity wireframe (ibid).
3.6.2 High-fidelity prototype
The high-fidelity prototype looks more like the final design of a product (Still and Crane, 2016). Most of the products interface appears to be more completed. Although, the back-end will most likely not be finished by this point. Still and Crane (2016) explain that the high-fidelity prototype is used as an in-between prototype. The reason for this is that you are not ready to complete the final product yet. There is a need for more feedback (ibid).
3.6.3 Applying prototyping
Prototyping has been applied in this project as a method to test concepts. In relation to Arnowitz et al. (2007), big and refined concepts were prototyped in this project. The refined concept was about instructions and testing two different ways of receiving instructions. The bigger concept was about the entire end-concept and was to be used to test how the whole concept was perceived. The prototype of instructions was medium-fidelity wireframes (Still and Crane, 2016), with only short descriptions.
The prototype of the entire concept was of high-fidelity (Still and Crane, 2016). This was done using VR as it was not able to be tested with AR at this point. The prototype was made using a 360 video, Unity, and images produced in Illustrator. The prototype was to be tested with users to determine how the entire concept would be perceived or other ways to continue. Connecting to testing bigger concepts as described by Arnowitz et al (2007).
3.7 User testing
Cooper et al. (2014) describe how user testing can help evaluate design choices and solutions throughout the interaction design process. They suggest doing this when your solution has some finish to it so that the user has something that he or she can comment on. Applying
29 user tests is good to be able to find issues with the order of activity, what to prioritize or refining button labels. Cooper et al. (2104) explain that an informal way to do a user test is good because it does not need as much preparation. However, it can make the designer accidentally explain things in a way that is convincing and therefore leading the user. Cooper et al. (2014) has found this method to suit users that can imagine how an interface could look with only a few drawings representing it. If there is time, a more formal user test has the advantage to determine if a user is able to achieve their tasks well. The test can also let you know whether the design lets the user achieve their end goals well, if the scope of the test is broad enough.
Cooper et al. (2014) stress the importance of doing user research before the ideation and the user testing, followed by feedback. The findings of user testing are often quantitative and therefore comparing variations of a design and which to choose that is the most effective. Goodman et al. (2012) describe user testing as a way to know if your users are able to use your creation. Tasks that are too difficult to complete, issues with an interface, and language that is confusing are problems that could be identified with user tests according to Goodman et al. (2012). Goodman et al. (2012) recommends watching users interact with your product with minimal description of the product. They explain how in a real-world context when a user is using a product they often do not get more information than a short description of something and a link to click. They stress the importance of using a quiet place for the testing so that neither you or the user gets distracted. Nothing related to the product should be around, to eliminate distractions and confusing information mean Goodman et al. (2012).
3.7.1 Applying user testing
User testing has been executed twice, once by testing different ways of receiving instructions and once by testing how the full experience was perceived. The instruction-prototypes were tested with seven users at the Cybercom office in Göteborg. The test was more informal, as described by Cooper et al. (2014) and tested in a quiet environment, as described by Goodman et al. (2012).
The second user test was about testing the entire final concept. The test was done using a VR prototype. The prototype was tested with eight users at Aranäsgymnasiet in Kungsbacka. This test was more formal, and five questions had been prepared for each test (see Appendix II) and was also tested in a quiet environment.
30
3.7.2 Think aloud protocol
Baxter et al. (2015) describe a think aloud protocol as a technique where the participant says what they are thinking when they are doing a task. They explain this technique to be
beneficial when conducting certain activities for user research when only one person is being tested at a time. The think aloud protocol is useful for understanding why a user is making a certain decision when using the product and at the same time getting the users thoughts and responses to what he or she is doing.
Unlike the description of a think aloud protocol by Baxter et al. (2015), the final prototype that was tested in this project was not interactable. However, the think aloud protocol was used to determine where in the VR video the users were and at the same time getting their reactions to the content. Their comments were noted down during the test.
3.8 Ethical considerations
The research project follows the ethical standards formulated by the Swedish Research Council (2017). The users participating in the various user-research activities in this project were on forehand informed about the project and agreed to take part. The participants had the possibility to decline being audio or video recorded and they were informed about being able to stop the activity at any time.
31
4. Design process
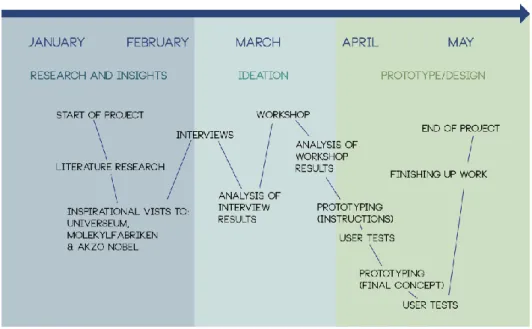
This chapter reflects upon the outcome of applying the different methods, which in detail are described in the previous chapter. The process of this project started with literature research and inspirational visits to Universeum, Molekylfabrikern and Akzo Nobel. This followed with interviews, a workshop, prototyping, and finally user tests (see Figure 7).
Figure 7. Description of the process followed in this project.
4.1 Semi-structure interviews
The semi-structured interviews in this project were conducted with students in the ages of 16-18. The students were all studying in secondary high school with the major fields of study being engineering, nature science combined with floorball, or economics. The interviews took place at either the participants’ schools or in their homes. The participants got to choose three of the 10 pictures prepared for the interviews that they found interesting in some way (see Figure 27-36 in Appendix I). They were specifically told to choose pictures that they found interesting in some way to eliminate answers like “it was a cool picture”. The pictures they chose led to further discussion and a few predetermined questions (see Appendix II). Their answers either led to a new question made up on the spot or they were asked more specifically what they thought was interesting. If they did not give an answer that could be continued to ask questions around, they were asked if there was anything that they would like
32 to know more about in the picture. When there was not much more that the participant had to say about the picture the next picture was discussed, and this pattern was followed until all three pictures had been talked about. The participant was then asked if they could see any patterns with the pictures they had chosen. The reason for using interviews as a method in this way was to find aspects that interested the participants in the pictures, to then gather inspiration for the physical component representing a machine part to be determined and designed in this project.
4.1.1. Analysis of interviews
Each interview was either videotaped or audio recorded, the videos were used as a way of receiving more data in looking at how the users behaved (see Figure 8). Although, no useful data was gathered from that. Even after a few interviews there were already some patterns forming. Some of the students had made similar comments about the same pictures, but the things only one student said or commented on were also taking in to consideration when coming up with concepts. Like Baxter et al. (2015) suggests to not wait with the analysing of the data until all of the interviews have been conducted because each interview could give you insights into what to improve for the next interview, this was taken into consideration. There was no proper analysis of data after each interview, but as the interviews were
semi-structured it was easy to rephrase a question when it was discovered that it was perhaps not providing me with the right information or to add a question. Therefore, each interview acted like a sort of test for what could be improved for the next one and there was no strict script. Because of the interviews being quite short in length I could easily go through each interview and the most important parts in my head after each one. This made me see results and patterns after only a few interviews. The results from the interviews were transcribed, each picture was then categorized, and frequency counted (Marshall, 1997) to find patterns. After categorization the data was translated and made sense of by summing up the main findings.
33
Figure 8. Photos of the semi-structured interviews with users.
4.1.2 Interview results
Overall it was clear that two pictures were the most popular. The picture of the cockpit and the picture of the roads (see Figure 33 and 35 in Appendix I). The picture of the cockpit was chosen one more time than the picture of the roads and was therefore the most popular. The pictures were chosen in combination six out of nine times. In fact, the picture of the roads was always chosen in combination with the picture of the cockpit. Before conducting the interviews, my expectations were that the students would pick pictures with everyday objects that they use in their everyday life like the videogame or the watch (see Figure 29 and 32 in Appendix I), but these two pictures only ended up being chosen one time each.
The picture of the cockpit got described as differentiating from the rest and one student described just being drawn to the picture of the roads. Some of the descriptions of why the participants chose the picture of the cockpit were more personal like having been on various plane rides and enjoying the ride but also the thought of going somewhere new or exciting seemed to spark some interest in that picture in particular. It was also described as
interesting because of the many technical parts and the advanced technical objects in the picture.
Regarding the picture of the roads the descriptions were more about being curious about where the roads were going and the construction of the roads. It was also described as colorful or that the participant liked the color palette. There seemed to be a bigger interest in the technical aspects of the pictures for the students studying engineering. The other two students who did not study engineering seemed more interested in other aspects. One of them who studied economics seemed more interested in the aesthetics of the pictures, how they were taken and the colors.
34
4.1.3 Concept ideation
The analysis after the interviews gave me enough inspiration to develop six concepts of physical components that the stakeholders could give their opinion on for us to reach a decision together of which idea to go forward with. The concepts were visualized using Illustrator to make it easier for the stakeholders to understand the ideas. Each idea was presented with a quote that had inspired me to come up with that concept as well as the picture/pictures. Some concepts were possible to combine with others and they were not fully thought-out as I wanted input from the stakeholders. For each concept I had prepared a short description for the intended use, explaining the concept further and for the stakeholders to understand the usage better.
The first concept was about locating a stop in one out of three or four pipes using AR (see Figure 9). The inspiration for this concept was based partly on what one student stated about the picture with intertwining roads (see Figure 33 in Appendix I) “It is all in the same area but in that area, you can go to so many different destinations”. To keep the ideas in the context of smart industry (mentioned in section 2.1), pipes seemed like an appropriate option and having the pipes intertwine would come closer to the picture that the student expressed interest in.
Figure 9. Concept visualization of locating a stop in one of several pipes.
The second concept was about test running a machine to see if it was running correctly or if something needed to be fixed (see Figure 10). The test would be run using AR as a guide. The inspiration for this had come from one student being able to see connections between all the
35 pictures chosen in that they were all about “exploring”. The student had picked the picture of the motorcycle (see Figure 28 in Appendix I), the picture of the intertwining roads (see Figure 33 in Appendix I), and the picture of the cockpit (see Figure 35 in Appendix I). The pictures were not in close relation to the idea I had but the word “exploring” made me think about exploring a machine which in turn made me come up with the concept of test running a machine.
Figure 10. Concept visualization about test running a machine.
The third concept was about locating a machine that had a problem, on a map with an overview of the factory (see Figure 11). The user would see the overview in the AR headset and be guided through the experience via AR. One student expressed an idea of having a drone watch over a factory during one of the interviews “I think they can be helpful in the industrial environment, maybe because they can watch over the new technology that you can use…”. The picture the student referred to was the picture of the drone (see Figure 30 in Appendix I). The concept I came up with was not about having a drone to get an overview of the factory but a map in the HoloLens that highlighted the machine with the problem.
36
Figure 11. Concept visualization of getting an overview of a factory.
The fourth concept was about solving different tasks to get a meter to show the right level (see Figure 12). The meter would move a little further for each task completed until the right level was reached. The picture that inspired this idea was the picture of the cockpit (see Figure 35 in Appendix I). A few students had expressed interest in the different meters and gauges in the picture and one student had said, “the technical parts are cool”. This made me want to include a meter in one idea as I got the impression that some students were drawn to that in the picture. As the picture of the cockpit was the most popular picture I wanted at least one idea around that picture and what the students had said about it.
37 The fifth concept was made up during a discussion with my supervisor at Cybercom. It was about making a marble go through several “levels” by solving different tasks and trying to make it reach the end (see Figure 13). The marble would be placed at the starting position and then come to the first task which had to be solved in order to let the marble through to the next task and repeating the process until the marble had reached the end. The different tasks were not defined fully in the concept, but one idea was to have harder tasks and fewer of them or easier tasks and more of them. It could be tasks like pumping water up to the right level or placing gears in the right position. Several students related the pictures they had chosen to travel, and one student said “All of them are going somewhere” when being asked if the student could see any connections between the picture of the drone, the roads, and the cockpit (see Figures 30, 33 and 35 in Appendix I). In fact, travelling and exploring seemed like a theme in most of the interviews. The concept would probably be difficult to have time to build and get running before the end of the project but seeing as it would include a quite large part of the interview findings I wanted to have it as a suggestion.
Figure 13. Concept visualization of making a marble travel through several tasks to make it reach the end.
The sixth and last concept was the concept that the stakeholders wanted to move forward with. It was about mounting parts on a machine to build it and then test running it (see Figure 14). In the visualization of the concept I had used gears as an example and the stakeholders ended up liking that idea. The concept was inspired by a student who said “I think it is fun the way some people mount different parts and try to fix their vehicles” about the picture of the motorcycle (see Figure 28 in Appendix I).
38
Figure 14. Concept visualization of building your machine by placing parts.
After further discussions with the stakeholders about the final concept, we came to a conclusion to combine the concept with the gears with the first concept with the pipes. The reason for this being that the concept with the gears became, in my opinion, more and more simplified after the first decision to go forward with it. Therefore, the final idea we decided on had the gears incorporated with the pipe idea where you first mounted the gears, turned them to switch on a light behind the pipe, then getting information that there was a stop in the pipe, locate the stop and then removing it (see Figure 15). AR would provide the user with instructions and guiding the user in solving the tasks.
39
4.1.4 Building the physical component
The concept of the gears combined with the concept of the pipes were put together into a physical component. The result from building this was an MDF board with plugs for placing the gears, a pipe, a light, a switch, and seven gears that were able to be placed or removed from the board (see Figure 16). Three of the gears from the original idea had to be removed in order to provide enough power to turn on the light. Having instructions for doing this was already criterion from the stakeholders. However, adding gamification to the concept in an attempt to make the experience more engaging was the following step and the reason for conducting a workshop.
Figure 16. The physical component designed based on the concepts from the interviews.
4.2 Workshop
The workshop started with a short presentation of my project and the reason for having a workshop. Papers were handed out to each participant. The participants then got the
question “What aspects do you find most important in a game?” and got eight minutes trying to sketch eight sketches answering that question. After the eight minutes they got to write a short description for each sketch. Instead of getting one minute for each sketch, as described by Knapp et al. (2016), the students got eight minutes to try and sketch all sketches without knowing how much time had passed. I wanted the students to focus on the aspects of a game
40 that they thought were the most important, rather than pushing them to come up with eight sketches that might not really be the aspects they thought were most important. Rather than conducting a brainwriting session (Wilson, 2013b) only, the students got to sketch their ideas because I found it to be a good way to engage them and to make use of the art class that they had at the same time. Another intention was to get inspiration for the design in my prototype using their sketches.
The workshop left me with a quite large amount of data (see figure 17). 14 students
participated in the workshop and each participant produced between two to six sketches. I had asked the students to try and draw six sketches, but they were not forced too. Since this was no design exercise where they were trying to solve a design issue, I saw it as unnecessary for me to force out six ideas or answers to my question. I figured, the ones they did sketch had to be the most important to them, as just sketching every game aspect they could come up with without having to think about it might not have produced the aspects they really valued. There was some confusion at first as to what kind of game the students would sketch important aspects to, some of them thought the exercise only had to do with computer games. After explaining that it could be any kind of game like board games, the students could more easily come up with ideas and relate to what they thought was most important.
Figure 17. Material produced by users during the workshop.
4.2.1 Analysis of workshop
The students’ ideas at the workshop were put in a mind map as text (see figure 18). The ideas were then categorized into character/story, time, social aspects, safety, expenses, difficulty,
41 prize/levels, feelings, usability, and visual aspects. This gave me a clear overview of what the students valued in a game and which parts seemed the most important. The mind map was then looked over in detail to determine what game aspects that I was able to use, regarding how well they fitted into the context of the project (see figure 19). These aspects were then put into a new mind map (see figure 20) with game concepts where some of them were combined in order to come up with new ideas.
Figure 18. Mind map of important aspects in a game based on workshop results.
42
Figure 20. Mind map of game ideas that derived from the workshop results.
4.2.2 Game concept ideation
As many of the students valued collaborating in a game, I had an idea about having a score board at the exhibition so that the people visiting could compare their score to others. Some students had expressed the importance of getting a prize or an award when finishing the game. This was something that would have been difficult to implement in the final version, but one idea was to have the user get access to the VR headset that Smarta Fabriker
manufactures, when they had finished the experience. There were also thoughts about having another kind of physical prize like a t-shirt or a pin, but it would probably have been difficult for Smarta Fabriker to maintain prizes like that.
Another idea was to have the user get prizes in the form of points throughout the game depending on how fast they completed a task the scores would then end up on a score board where the players could compare their results to others. This would add challenge as well as something to aim for. In relation to that idea another suggestion was to receive some sort of prize if the user got a high score. Two students expressed the importance of having realistic aspects in the game so that they reflected reality in some way. Seeing as the physical
component needed a realistic aspect anyway to be a part of Smarta Fabriker, this was already a design requirement.
43
4.3 Prototyping
4.3.1 Instructions
Based on results from the workshop and requirements of the project. Two prototypes were produced for different purposes. The prototype that was produced from requirements of the project was used to test two ways of receiving instructions. The final concept needed
instructions in some way in order to meet the expectations from the stakeholders as one of the requirements was to be guided by AR. Prototyping was used to produce mock-ups of two alternatives of instructions. One alternative was a list were the user could see all of the
instructions at the same time. (see figure 21). The user could see which instruction was active, the ones completed and the ones following. The list had a checkbox for each instruction and two buttons to go between the list items. The other alternative was only displaying one instruction at a time (see figure 22). The steps were displayed in numbers at the top so that you could see which instruction you were on and how many you had left. No colors were used in the mock-ups like the recommendation by Still and Crane (2016) and I tried to keep the design very simple. Although, it might not have been as simplified as described by Still and Crane (2016), but as the user was going to interact with the mock-ups I wanted some finish to them.
44
Figure 22. The prototype alternative where the user received instructions one by one.
The tools used for the prototyping were firstly Illustrator in producing the mock-ups which were then implemented into the HoloLens (further described in section 2.3.1) with the help from the computer engineering students. They were able to make the HoloLens switch between the mock-ups using voice command or the pressing of a button on a keyboard. Because the HoloLens was a bit limited in registering information using voice commands, the computer engineering students and I decided not to use voice commands as a final
interaction method. The HoloLens was very sensitive to surrounding noise and needed a quiet environment in order to register the right information. Voice commands might otherwise have been a quite useful interaction method for industry workers because they might not always have their hands free to make the hand gestures otherwise required. If the technique is going to be used in an industrial environment in a near future, noise cancellation and better registration of voice commands will probably need to be solved.
The reason for comparing these two alternatives was because I felt a need to compare the checklist to another alternative as it was the only alternative described by the stakeholders and the developers in this project. Like Arnowitz et al (2007) describe, to test refined concepts could provide data for the detailed design. In this case two ways of instructing a user. Therefore, this type of prototype was produced in order to determine whether to move forward with a list of instructions or with one instruction at a time.
4.3.2 Full concept
The results from the workshop inspired the gamification part of the project. The sketches the students had produced were not used for inspiration for the design, as was my original intention. I found it difficult to translate their quick sketches into aspects that I could use in the design. However, the sketches gave me some insight in the students’ thoughts of how to
45 visualize their answers and all the sketches were quite clever in how they represented their answers.
To be able test the full experience, without having the end result finalized before the completion of my thesis, the experienced was faked using a VR prototype. The computer engineering students that I collaborated with in this project had their deadline later and would not have come far enough for me to conduct a final user test. Therefore, there was a need for faking the experience in order to determine whether or not the users understood the concept as well as testing their engagement of such a product.
The tools used for the prototype was a 360-degree camera, Illustrator, Unity, and an Android phone. I used the 360-degree camera to film myself interacting with the physical component. The video was then uploaded into Unity where I created a virtual environment and added the images produced in Illustrator. To make the images show up and hide when I wanted to, I got some help from two fellow thesis students at Cybercom, also working with VR, to write code to make the images show and hide in the right order. The Unity project was then built for an Android phone where you could view it with a VR headset (see Figure 23 and 24). The
prototype did not have any interactive parts and was viewed as a video experience of the final concept.