An evaluation of preprocessing of noisy fingerprint images by
Cellular Frequency Amplification
Sanda Spanovic Kurtic
Supervisor Helmuth Kristen Examiner Peter Linde
Utvärdering av CFA
(Cellular Frequency Amplifikation) metod
– en förbehandlingsmetod för brusiga fingeravtrycksbilder
SAMMANFATTNING
Det visas, för ett antal relevanta databaser, att Cellular Frequency Amplification (CFA) förbehandlingsmetod, introducerad av Willis and Myers (2001), förbättrar FAR/FRR prestanda för Precise Biometrics verifikationsalgoritm. Detta både bekräftar och förstärker Willis och Myers slutsatser ur ett verifikationsperspektiv: Förbättrad FAR/FRR prestanda visar att CFA förmår att extrahera underliggande mönster i databaser med brusiga fingeravtryck i större omfattning än de fyra alternativa förbehandlingsmetoder som utvärderas. Dessa metoder är trösklingsbaserad binarisation, Stock-Swonger binarisation och två företagsägda algoritmer.
CFA presterar minst lika bra som de två valda företagsägda förbehandlingsalgoritmerna, har bättre prestanda än Stock-Swonger algoritm och presterar mycket bättre än trösklingsbaserad binarisation.
För FAR av storleksordningen 1/1000 till 1/10000 ger CFA metod i FRR värden som är upp till en femtedel lägre än den nästbästa förbehandlingsmetoden.
Den karakteristiska skalan för ett fingeravtryck, där inga större förändringar i den spatiala frekvensen eller riktningen inträffar, är 2 mm.
Exponent k=0.8 har visats vara optimal för bildförbättring. Högre exponenter presterar sämre eftersom även karakteristika av högre ordning tillsammans med strukturellt brus undertrycks ännu mer med ökande k.
ABSTRACT
It is shown, for a number of relevant databases, that the Cellular Frequency Amplification (CFA) preprocessing method, introduced by Willis and Myers (2001), improves the FAR/FRR performance for a Precise Biometrics authentication algorithm. This not only corroborates the findings by Willis and Myers, but strengthens them from an authentication perspective: The improved FAR/FRR performance shows that CFA manages to extract the underlying pattern in the noisy fingerprint databases to a larger extent than the four alternative preprocessing methods that were evaluated. These methods were binarization by thresholding, Stock-Swonger binarization, and two proprietary algorithms.
CFA performs at least as well as the two selected proprietary preprocessing algorithms, outperforms the public-domain Stock-Swonger algorithm, and far outperforms binarization by thresholding.
In the FAR regime 1/1000 to 1/10000 CFA yields FRR values up to one-fifth lower than for the next-best preprocessing method.
We find a characteristic scale of 2 mm in the fingerprint, over which no large changes in spatial frequency or direction occur.
An image enhancement exponent of k=0.8 is found to be optimal. Larger exponents perform less well due to the fact that higher-order characteristics in the fingerprint pattern are increasingly suppressed together with the structural noise.
1 Introduction ... 5
1.1 Biometrics ... 5
1.1.1 Background ... 5
1.1.2 The fingerprint ridge pattern ... 5
1.2 Biometric authentication ... 6
1.3 Metrics for classification strength ... 6
1.3.1 The definition of a metric ... 7
1.3.2 Biometric classification ... 7
1.3.3 False Acceptance Rate ... 7
1.3.4 False Rejection Rate ... 8
1.3.5 The Receiver Operating Characteristic Curve ... 9
2 Problem definition ... 10
3 Goal ... 10
4 Prerequisites ... 11
4.1 FVC 2000 databases ... 12
4.1.1 General ... 12
5 The Fourier transform ... 14
5.1 General approach ... 14
5.2 DFT ... 15
5.3 FFT ... 16
6 Preprocessing methods... 17
6.1 Cellular frequency amplification ... 17
6.2 Comparison preprocessing methods ... 20
6.2.1 Thresholding ... 20
6.2.2 Stock-Swonger ... 20
6.2.3 Proprietary algorithm 1 ... 21
6.2.4 Proprietary algorithm 2 ... 22
7 Implementation ... 22
7.1 Optimization of cell size ... 22
7.2 Optimization of image enhancement exponent k... 22
7.3 Finding a suitable image reassembly process ... 23
8 Database runs and their results ... 24
8.1 Results ... 24 9 Discussion ... 27 10 Conclusions ... 28 11 Acknowledgements ... 29 12 References ... 29 12.1 URLs ... 30 13 Appendix ... 31
1 Introduction
1.1 Biometrics
1.1.1 Background
Since the early 20th century have the terms "biometrics" and "biometry" been used to refer to a field of statistical and mathematical methods in the biological and medical sciences.
For example, agricultural science may apply statistical methods to the analysis of data from experiments to compare the yields of different varieties of wheat. In the medical research field statistical methods may be used in the analysis of data from human clinical trials to quantify the relative effectiveness of therapies for a disease. Even the analysis of data from environmental studies and the effects of air or water pollution on the appearance of human disease in a region is an example of a concrete problem that would fall under the umbrella of "biometrics" as the term has been historically used.
An emerging field of technology applies “biometrics” in order to authenticate individuals in an automated way through characteristic biological traits, for example found in their voice patterns, fingerprints, retina, iris, or face.
1.1.2 The fingerprint ridge pattern
Nature has its own secrets and one of these unexplainable wonders is the uniqueness of a finger’s skin pattern. It has been used for human identification since ancient times (Maltoni et al., 2003). The role of the pattern of ridges is presumably to enhance friction, which is why the ridges are also referred to as “friction ridges”.
Ridges and valleys are the base elements in a fingerprint pattern. Valleys, in a fingerprint context, are impressions following a pattern formed by the skin in the fingers. The complementary regions of the skin may be classified as ridges.
Ridges may end or fork. The structures formed, referred to as “ridge endings” and “bifurcations”, are characteristic of an individual finger and have historically been used for authentication purposes. The two structure types are commonly referred to as “minutiae”. Other characteristics exist in the pattern, however, such as ridge density and curvature.
Henceforth, the fingerprint ridge pattern will be referred to as the “fingerprint” (which, strictly speaking, is not entirely the same thing).
The uniqueness of the fingerprint has never been “scientifically proven” but neither has it ever been denied (Pankanti et al., 2002, and references therein). The uniqueness of the fingerprint should rather be viewed as a standing hypothesis. Humans and other primates
1.2 Biometric authentication
Biometric characteristics that are found in an individual may be used for authentication purposes; that is, they help determine the identity of an individual.
Two general situations of authentication exist. Either, the authentication step consists of verifying an identity claimed by the individual. Alternatively, the individual makes no claim of identity, and the authentication step includes sieving through a database of some sort for possible identities. The former type of authentication is sometimes referred to as “verification”, the latter as “identification”.
Authentication typically involves the extraction of biometric data at an initial “enrolment” stage, followed by a later comparison of fresh data with the enrolled data (referred to as the biometric “template”).
Biometric authentication methods can further be divided into either physical/physiological or behavioral types. Behavioral methods work with behavioral traits that are learnt and acquired in a period of time, such as writing style. Physical/physiological biometrics handle physical characteristics such as the fingerprint, iris etc. Some methods, such as voice, have to be sorted somewhere in-between, however. The functionality of a certain biometric for authentication purposes depends on a number of properties (Maltoni et al., 2003), such as
- Universality (the biometric should exist in as many people as possible) - Durability (the biometric should not change over a certain time)
- Uniqueness (a biometric set of characteristics should never appear in two people) - Measurability (the biometric should be fast and simple to measure)
- Usability (the biometric should be intuitive and comfortable to measure). The first three attributes (universality, durability, and uniqueness) are associated with the nature of the biometric trait in itself. Attributes four and five, “ measurability” and “ usability” , are concerned with the sampling (creating a representation) of that trait and are therefore subject to signal-to-noise issues. Improving “ measurability” and “ usability” for the fingerprint biometric is the aim of the study here presented.
1.3 Metrics for classification strength
The term “Biometric” is made up of two words: “Bio” indicates that the subject concerns living things. “Metric” indicates that the subject involves quantitative measurements in a mathematical sense.
1.3.1 The definition of a metric
A metric defines a nonnegative function m(A,B) for the distance between neighboring points A and B for a given set1. In a biometric context, that distance tends to be called the “similarity score” for a comparison between samples A and B.
The mathematical definition for a metric further mandates that the metric is a symmetric operator. A permutation of variables does not change the resulting value, that is m(A,B) = m(B,A).
1.3.2 Biometric classification
Using some metric, a biometric authentication algorithm typically produces a similarity score each time two samples (such as fingerprint images) are compared. Complete agreement between two images may, for example, render a score of “one”, and complete disagreement may render a score of “zero”. Real-life comparisons typically render a similarity score in-between. In order to classify the images as either coming from one and the same individual or not (that is, a binary classification) the algorithm typically thresholds against a set threshold value T. If for example, a comparison produces a similarity score of T=0.5 or higher, then the algorithm classifies the images as coming from the same individual, otherwise not.
Traditionally, the metrics used in fingerprint-based authentication rely on the relative positions found for the minutiae (Section 1.1.2). Precise Biometrics’ metrics rely on pixel-by-pixel comparisons in bitmaps of characteristic regions of the fingerprint, however.
Two types of errors are associated with binary classification. An unauthorized individual may wrongly be identified as being authorized, and an authorized individual may wrongly be identified as being unauthorized. The former type of error is called a “false acceptance”, the latter a “false rejection”. The rate at which these errors occur, the False Acceptance Rate (FAR) and the False Rejection Rate (FRR), are important measures of the “classification strength” of an authentication algorithm. Both rates depend on the threshold T chosen for classification. Thus, FAR and FRR are interdependent, as e.g. illustrated by a Receiver Operating Characteristic (ROC) curve which plots FRR against FAR (see Figure 1 and Section 1.3.5).
1.3.3 False Acceptance Rate
The FAR is the rate at which a biometric authentication system incorrectly authenticates data as belonging to a certain authorized individual. The FAR follows
∑
∑
∞ = Τ Τ = = 0 max ) ( ) ( ) ( t t t AI t SI T FAR , (2)where T = threshold value, SI = number of successful impostor authentication attempts, and AI = number of all impostor authentication attempts.
The FAR may be viewed as a security parameter. If an algorithm is good at finding differences between two patterns, this is reflected in a low FAR.
Two types of attack will here illustrate the FAR’s role as a security parameter: An intruder may attempt to attack a biometric security system for example through a “zero-effort” attack or a “brute-force” attack.
A “zero-effort” attack consists of placing ones own finger on the sensor to test whether the system really is able to find enough differences with respect to an authorized individual to deny access. The FAR may thus be translated into the risk of a successful zero-effort attack.
A “brute-force” attack involves either a large set of unauthorized individuals, or a database of either real or synthetic fingerprint images. Large fingerprint databases are difficult to collect or get hold of, but a synthetic fingerprint generator program such as SFinGe (Synthetic Fingerprint Generator, developed by the BioLab at the University of Bologna) may produce very large sets that may facilitate “brute-force ”attacks. “Brute-force” attacks may prove feasible even for systems with FAR levels of one-in-a-million and less.
The FAR scales inversely linearly with the database size and time needed for a successful brute-force attack.
Needless to say there are numerous attacks imaginable that do not relate to the FAR. For example, biometric authentication does not protect against harmful acts by an insider, nor against an outsider getting access to information or physical premises by means of bribes, physical threats, or extortion.
1.3.4 False Rejection Rate
The FRR is a convenience or comfort parameter for a biometric system. It describes the rate at which an authorized person is rejected. The authorized user experiences denied access as annoying and uncomfortable. The FRR follows
∑
∑
∞ = Τ = = 0 0 ) ( ) ( ) ( t t t AG t RG T FRR , (3)where T = threshold value, RG = number of rejected genuine verification attempts, and
The FRR depends heavily on user behavior and sensor technology. An inexperienced user may tend to present different sections of the finger to the sensor, and a lower quality sensor tends to lose more details of the pattern than a more expensive variant. See Cases (2001) for a detailed investigation of the FRR error.
1.3.5 The Receiver Operating Characteristic Curve
The Receiver Operating Characteristic (ROC) curve plots FRR against FAR for a combination of threshold values T. It is a standard tool for classification strength studies (Neyman and Pearson, 1933), as it offers the possibility of rather objective comparisons of biometric systems.
An ideal ROC curve only has values that lie either on the x-axis (FAR) or the y-axis (FRR). For FRRs other than 0, the FAR is 1, and vice versa. A ROC curve is monotonously decreasing. In real life, ROC curves tend to resemble Figure 1.
Figure 1: A schematic ROC curve.
F R R FAR 0 0 1 1
2 Problem definition
The security aspect of biometrics (directly related to the FAR measure) currently draws much attention. Therefore, database runs tend to focus on probing the “uniqueness” of various kinds of biometrics and the algorithms associated therewith. However, “measurability” and “usability” may be equally important from a systems perspective as they focus on the system’s functionality (related to the FRR measure). That is, the biometric should not only be unique and exist in as many people as possible, but it must also be straightforward to present and measure.
If a percentage of the population needs to rely on a fallback option as a result of physical disposition or limitations in sensor technology, there may be important consequences for system design. For example:
• If the security implications of a fallback option are not considered carefully, a security loophole may be introduced.
• If the costs associated with a fallback option are not considered carefully, cost estimates may be overrun several times.
• If the rate of throughput (the number of individuals that are authenticated within a certain amount of time) associated with a fallback option is not considered carefully, biometric authentication systems may become a bottleneck to the organization.
Each example means missing a key selling point of biometric authentication.
Thus, it is of importance not only to design biometric authentication systems to the satisfaction of the average user, but also to encompass as large a portion of the population as necessary from the system’s perspective (100% if there is no fallback option).
In the case of the fingerprint biometric, current sensor technology does not cover 100% of the world population. There is a proportion of people that, due to e.g. finger dryness or wetness, experience less than optimum FRR performance. The reason is that finger dryness or wetness introduce noise to the image that is captured of the fingerprint. Thus, the noise introduced to such images presents a problem to authentication systems that rely on this type of biometric. That problem is at the focus of the study presented here.
3 Goal
The goal of this degree thesis is to implement and quantitatively evaluate a preprocessing method that aims to improve the “measurability” and “usability” of the fingerprint biometric. The method will here be referred to as “Cellular Frequency Amplification” (CFA), and was introduced by Willis and Myers (2001). The method in particular targets noise introduced to the fingerprint image due to dryness or wetness.
4 Prerequisites
MathWork’s MATLAB 6.0 was chosen to implement Cellular Frequency Amplification (CFA).
The effect that CFA has on the classification strength (FAR and FRR, that is) of a commercial Precise Biometrics classification algorithm was measured by introducing small modifications to the Precise Biometrics C/C++ code for the company’s commercial algorithm; modifications that were solely concerned with input and output image formats as well as logging of similarity scores. No alterations were made to the core biometric functionality. This work was done using Microsoft Visual Studio 6.0.
The collection of fingerprint images tends to be expensive and methods of collection furthermore vary between collections depending on sensor technology and objective. As a result, there are only very few open databases that can be used for standard evaluation purposes. Examples are the FVC 2000 databases (see next Section) that were adopted here to sample FAR and FRR values in a standardized, reproducible way. They suit their purpose particularly well in the evaluation of CFA, since they contain a large amount of fingerprint images that contain structured noise due to either dryness or wetness. The reason for this is not currently understood.
Figures 2 and 3 show two fingerprint readers produced by Precise Biometrics AB, the BioAccess Mifare, and the 100 SC. The former is for opening doors, the latter for logging into a computer. The BioAccess uses optical technology for sampling the fingerprint, the 100 SC uses a silicon-based sensor (This has relevance for the quality expected of the produced images. See next section).
Figure 3: Precise 100 SC, a combined fingerprint and smart card reader
4.1 FVC 2000 databases
FVC2000 (Fingerprint Verification Competition 2000) was a worldwide competition for fingerprint-based biometric authentication algorithms. It was held by the BioLab at the University of Bologna in August 2000 with the aim to become a future benchmark for these types of evaluation.
4.1.1 General
We chose to benchmark against databases 1a, 2a, and 4a in FVC2000. The remaining database 3a was excluded from this study because it differs considerably in size and image quality from what is typically expected by a Precise Biometrics algorithm. Samples from database 1a, 2a, and 4a, are given in Figures 4, 5, and 6, respectively. The large amount of dry and wet fingers may be noted. The respective “b”-databases were also excluded from this study as they do not contribute a relevant amount of additional data.
Concerning the nature of FVC2000 databases, both male and female volunteers (about 50% male and 50% female) aged between 20 and 30 were engaged in the fingerprint collection. Databases 1a and 2a were acquired using low-cost sensors, whereas database 4a was synthetically generated by the SFinGe (Synthetic Fingerprint Generator) software developed by the BioLab at the University of Bologna.
Name Sensor Type Image Size Set “a” width1
Set “a” depth2
Resolution DB1 Low-cost and small
size Optical Sensor by KeyTronic
300x300 100 8 500 ppi
DB2 Low-cost and small size Capacitive Sensor
By ST
Microelectronics
256x364 100 8 500 ppi
DB4 Synthetic Generator 240x320 100 8 about 500
ppi 1 - the number of images for different fingerprints
2 - the number of different images of the same finger
Table 1: Characteristics of the involved databases of fingerprint ridge pattern images. (Table source http://bias.csr.unibo.it/fvc2000/databases.asp.)
Figure 4: Image samples from database 1a.
Figure 6: Image samples from database 4a.
5 The Fourier transform
CFA relies on the Fourier transform. A brief exposition of the Fourier transform is therefore given here.
5.1 General approach
In general, the Fourier transform has a wide scope of applications in image processing. It is one of the essential tools for image restoration.
Advantages of the Fourier transform are that it may simplify analysis since it moves problems into frequency space, as well as there being a robust mathematical/analytical understanding. A disadvantage may be that the Fourier transform may be rather consuming with respect to processing power and memory. On the other hand, algorithmic discoveries and a large amount of dedicated hardware exist that may alleviate this problem
If we assume that f(x) is a continuous function of a real variable x, we can formulate the Fourier transform for f(x) as
ℑ{f(x)} = F(u) =
∫
∞(
)
∞
− f(x)exp − j2πux dx , (4)
where j= −1.
The inverse Fourier transform follows ℑ−1
{F(u)} = f(x) =
∫
∞(
)
∞
− F(u)exp j2πux du . (5)
The conditions for existence of equations (4) and (5) are that f(x) is continuous and integrable and F(x) integrable. The equations constitute a complementary pair called the Fourier transform pair.
F(u) generally comprises a real part R(u) and an imaginary part I(u) following
An alternative representation of (6) is the exponential form
(
( ))
exp ) ( ) (u F u j u F = φ (7)from which both the magnitude function |F(u)| and its phase angle φ(u) can be extracted. The Fourier spectrum of f(x) is another name for the magnitude function |F(u)| defined as
(
)
2 1 ) ( ) ( ) (u R2 u I2 u F = + , (8)where the phase angle is given by
= − ) ( ) ( tan ) ( 1 u R u I u φ . (9)
Equations (8) and (9) allow us to decompose an array of complex coefficients into an array of magnitudes and an array of phases (see Figure 7).
Figure 7: A fingerprint ridge pattern image (left) with corresponding amplitude (center) and phase spectrum (right).
5.2 DFT
To make computer processing of an image possible, a continuous function needs to be transformed into its discrete variant both spatially and in amplitude. This process is generally referred to as “digitalization”. Digitalization of the spatial coordinates (x,y) is
The greylevel intensity of a continuous image f(x,y) needs to be approximated by equally spaced samples arranged in the form of an N-by-M array. Each element of this array is a discrete quantity that is referred to as a picture element or pixel. The digitalization process requires decisions about the number of discrete greylevels allowed to each pixel as well as a decision about N and M.
The fact that an image is two-dimensional, sampled, and of finite extent initiates the Fourier transforms existence.
Sequence {f (x
0), f (x0+ ∆x), f (x0+ 2∆x)… f (x0+
[
N −1]
∆x)} describes N samplesin ∆x steps that a continuous function f (x) becomes discretized to. The Discrete Fourier Transform applied to sampled functions is given by
(
)
∑
− = − = 1 0 / 2 exp ) ( 1 ) ( N x N ux j x f N u F π (10) for u = 0, 1, 2, …, N-1.In the case of images FFT needs an appropriate two-dimensional variant that is defined for an image of size M×N as
(
)
∑∑
− = − = + − = 1 0 1 0 ) / / ( 2 exp ) , ( 1 ) , ( M x N y N vy M ux j y x f MN v u F π (11)with parameters u = 0, 1, 2, … , M-1 and y = 0, 1, 2, … , N–1.
5.3 FFT
Calculating a single value of F(u,v) is a time consuming process that involves summation over all pixels in the image. If the image has dimensions N-by-N, then its discrete Fourier transform performance includes at least N2operations. With its overall complexity counted, N4operations per image becomes a standard measure.
A more efficient method called the Fast Fourier Transform has been found thanks to the fact that for dimensions divisible by 2, the Fourier transform can be separated, reducing its computational complexity.
Separability allows us to perform a one-dimensional FFT along each row of the image to generate an intermediate array, followed by another one-dimensional FFT down each column of this array to produce the final result.
6 Preprocessing methods
Image processing methods may be divided into either a) “ad-hoc” approaches that follow rules based on experience from a specific problem area, or b) “first-principle” approaches that follow rules that result from a logical/mathematical analysis of a generic problem. For example, an algorithm that searches for ridge endings and bifurcations in an image in order to extract that kind of information for the purpose of authentication, is of an “ad-hoc” type: The algorithm implicitly contains the knowledge that these structures tend to be characteristic of a fingerprint ridge pattern. Presented with a completely different type of image, for example a satellite image of forest terrain, the performance of the algorithm may be of little use for finding terrain features that do not resemble ridge endings or bifurcations. Conversely, an algorithm that searches for structures in an image that are unique within its surroundings (e.g. by means of correlation computations), is of a “first-principle” type. The algorithm tends to react roughly to the same areas of a fingerprint pattern image as the previously mentioned “ad-hoc” type. However, when presented with a satellite image of forest terrain, the performance of this algorithm may still be of interest, as it may extract features other than ridge endings or bifurcations, for example houses.
In short, “ad-hoc” type algorithms are more specialized than “first-principle” types, and thus may perform better in “closed” applications, where their role and performance is predictable and well understood. Conversely, “first-principle” types tend to be more flexible as they involve a minimum of assumptions and their logical/mathematical formalism tends to facilitate analysis and understanding.
Cellular frequency amplification, the preprocessing method at the heart of this study, can be argued to be a “first-principle” method, although it involves some adjustments of parameters to the specific problem (see Section 7).
6.1 Cellular frequency amplification
Willis and Myers (2001) introduce cellular frequency amplification (CFA) as a means to extract the underlying fingerprint ridge structure from poor quality images that may result from dry or wet fingers.
The principle behind CFA is that the dominant spatial frequencies in an image are amplified, suppressing structured noise that lies at a different (typically smaller) scale. In practice, CFA divides the input image into a grid of equally sized cells, the size of which corresponds to a characteristic scale over which the pattern of interest remains stable (no large changes in spatial frequency or direction occur). This characteristic scale will need to be determined.
CFA then applies the 2-D Fourier transform to each cell in order to enter the frequency domain. Here, the dominant spatial frequency in each cell is never explicitly extracted. Instead, the amplitude component of the frequency domain is raised to the order of 1+k, where k is a positive real, before the cell information is transformed back into the image domain. This accomplishes the desired amplification of the dominant spatial frequencies. The optimum value of k, henceforth referred to as the image enhancement exponent, will
Figure 8 gives a flowchart depicting the steps involved in CFA.
Willis and Myers (2001) have demonstrated that CFA produces “de-noised” images that resemble fingerprint images to a higher degree than the underlying original. They conclude that a poor quality image or bad fingertip image can be “repaired” through CFA preprocessing. However, it is of great importance when trying to improve the “measurability” and “usability” of a biometric for authentication purposes that a “repaired” image not only resemble a fingerprint according to our expectations of what a fingerprint in general should look like; the “repaired” print must truly correspond to the individual underlying pattern to a higher degree than the original.
Measuring FAR/FRR performance provides a clear answer to this problem: if the repaired print truly corresponds to the individual underlying pattern to a higher degree than the original, then more characteristics can be extracted reliably, and FAR/FRR performance improves.
Load image
(1)
Create image of size N-by-M with pixel values of zero (2)
Apply inverse 2-D FFT
(9)
Add cell information to reconstructed image
(10)
Add normalization cell information to normalization matrix (11) Apply 2-D FFT to cell (5) Extract amplitude information (7) Extract phase information (6) Raise amplitude information to the 1 + kth power (8)
Reconstructed N-by-M image (13) Normalize reconstructed
image (12)
Create C-by-C cell with pixel values of one (4) Extract C-by-C cell
(3)
Have all cells been amplified? yes
no
6.2 Comparison preprocessing methods
To evaluate the performance of CFA, four alternative preprocessing methods were adopted for comparison. They are presented in the following sections.
6.2.1 Thresholding
This method is straightforward with the known disadvantage of a high sensitivity to noise, which typically causes artifacts in the form of “islands” (a white pixel surrounded by black pixels, or vice-versa). A number of variants of thresholding exist, and the subject has resulted in a large number of publications in itself. The variant adopted here is as follows. The greyscale values from the original N-by-M image are transformed into a histogram. This histogram typically contains two peaks, corresponding to the ridge and valley pixels, respectively. The median value of the histogram is chosen as the threshold value.
Simple thresholding almost by definition is a poor performer under the presence of noise. It has been included here primarily for the sake of illustrating the magnitude of deterioration suffered because of noise. For a perfect sensor, simple binarization by thresholding should suffice, however.
6.2.2 Stock-Swonger
Simple thresholding performs poorly under the presence of noise. If one instead makes assumptions about the underlying structure, noise that is structurally different could be suppressed in a more efficient way. For example, a structure in the form of an “island” may be defined to be an artifact, as it differs from the assumed underlying structure of ridges and valleys.
A method that takes into regard underlying structure was proposed by Stock and Swonger (1969). At the heart of the method lies the 9-by-9 Ridge-Valley Orientation Detector matrix = − − − − − − − − − − − − − − − − − − − − − − − − − − − − − − − − ) 7 ( 0 ) 8 ( 0 ) 1 ( 0 ) 2 ( 0 ) 3 ( 0 0 0 0 0 0 0 0 0 ) 6 ( 0 ) 7 ( ) 8 ( ) 1 ( ) 2 ( ) 3 ( 0 ) 4 ( 0 0 ) 6 ( 0 0 0 ) 4 ( 0 0 ) 5 ( 0 ) 5 ( 0 0 0 ) 5 ( 0 ) 5 ( 0 0 ) 4 ( 0 0 0 ) 6 ( 0 0 ) 4 ( 0 ) 3 ( ) 2 ( ) 1 ( ) 8 ( ) 7 ( 0 ) 6 ( 0 0 0 0 0 0 0 0 0 ) 3 ( 0 ) 2 ( 0 ) 1 ( 0 ) 8 ( 0 ) 7 ( ) ( i i i i i i i i i i i i i i i i i i i i i i i i i i i i i i i i i MRVOD δ δ δ δ δ δ δ δ δ δ δ δ δ δ δ δ δ δ δ δ δ δ δ δ δ δ δ δ δ δ δ δ . (12)
To clarify, the functionality of the Ridge-Valley Orientation Detector is illustrated in Figure 9.
7 0 8 0 1 0 2 0 3 0 0 0 0 0 0 0 0 0 6 0 7 8 1 2 3 0 4 0 0 6 0 0 0 4 0 0 5 0 5 0 0 5 0 5 0 0 4 0 0 0 6 0 0 4 0 3 2 1 8 7 0 6 0 0 0 0 0 0 0 0 0 3 0 2 0 1 0 8 0 7 c
Figure 9: The eight slit directions of the Ridge-Valley Orientation Detector are indicated by corresponding index numbers 1, … , 8. The central pixel position is indicated by c. In effect, when applied to an underlying 9-by-9 greyscale image cell, the Ridge-Valley Orientation Detector may calculate any of eight “slitsums” (S1, … , S8) for the central pixel, as indicated in Figure 9. The corresponding mathematical formalism for slitsum Si resulting from a 9-by-9 pixels-squared greyscale image cell C is
T RVOD
i M i C
S = ( )⋅ . (13)
For example, slitsum eight (i=8) corresponds to S8 = C(3, 1) + C(4, 3) + C(6, 7) + C(7, 9), which simply is the sum of the pixel values in C lying along the slit corresponding to direction index “8” in Figure 9.
For slit values, we define an average
∑
= = 8 1 8 1 i i avg S
S , a minimum Smin =min(Si), and a maximum Smax =max(Si). Stock and Swonger (1969) found, empirically, that an efficient ridge-or-valley classification criterion for a pixel C(5,5) in the center of a 9-by-9 greyscale image cell was whether
4 4 3 ) 5 , 5 ( S Smin Smax C > avg − + . (14)
That is, structural information is extracted using the ridge-valley orientation detector and weighted in a way that is found to improve classification/binarization. It is to be noted that Stock and Swonger (1969) is the FBI minutiae reader.
6.2.3 Proprietary algorithm 1
The workings of this preprocessing method are confidential (so only few details can be given in this publication). The preprocessing step (prior to a binarization by thresholding) in current Precise Biometrics software is of this type. It basically relies on a set of directional filters that give a particularly strong signal when direction and wavelength in
weights are given from the signal strength of the comparison. The reader is referred to Jain (1997) for further reading on directional filters in a fingerprint context.
6.2.4 Proprietary algorithm 2
The details of this preprocessing method are, again, confidential. It represents current Precise Biometrics research into the issue and is mainly a result from further development of the “Proprietary 1” method. The principal difference between the two proprietary methods is that “Proprietary 2” features filter sets that dynamically adapt to the degree of uncertainty experienced in the direction of the underlying pattern.
7 Implementation
CFA was implemented in MATLAB 6.0, following the process steps outlined in the previous section. The MATLAB FFT package was used for transforming cell information between the image and frequency domains. A number of FAR/FRR runs were done against the involved databases in order to determine
• An optimum cell size
• An optimum image enhancement exponent k
• A suitable process of assembling processed cells into an originally-sized image. A more detailed description of this work is given in the following Sections.
7.1 Optimization of cell size
FAR/FRR runs were performed for the involved databases. Cell sizes of 8-by-8, 16-by-16, 24-by-24, 32-by-32, 40-by-40, and 48-by-48 pixels-squared (at 500 pixels-per-inch) were evaluated. Sizes between 24-by-24 and 40-by-40 pixels-squared perform the best, and we adopt 32-by-32 pixels-squared cells, in effect corroborating the results of Willis and Myers (2001). A scale of 2 mm (40 [pix] / 500 [ppi] x 25.4 [mm/i]; also see Johansson & Kristen, 2003) therefore appears to be associated with the nature of the fingerprint ridge pattern: Significant information is captured at the same time as larger scale effects such as changes in spatial frequency or direction are avoided.
7.2 Optimization of image enhancement exponent k
FAR/FRR runs were done for the involved databases. Image enhancement exponents
k=0.4, 0.8, 1.2, 1.6, 2.0, and 2.4 were evaluated. A k of 0.8 was found to perform the best (cf. Figures 12-14). It is to be noted that there is an upper limit to the image enhancement exponent k. That is, k=2.4 does not outperform k=0.8. See Section 8 for a further discussion of this fact.
Figure 10 illustrates the restoration power attained for a single 32-by-32 pixels-squared cell.
Figure 10: A 32-by-32 pixels-squared cell before (left) and after (right) frequency amplification with k=0.8.
7.3 Finding a suitable image reassembly process
DFT implicitly assumes that a cell pattern reoccurs infinitely with a spatial periodicity corresponding to its cell size. The fact that a cell is the result of a cropping procedure introduces artificial edge features that introduce high-order components into the frequency domain that do not provide any additional information on the fingerprint ridge pattern. Simply dividing the original image into cells, of size C-by-C pixels-squared, to treat them individually and then reassembling them into an originally-sized image, will introduce quite an amount of such artificial features.
The traditional way to diminish edge-effects in DFT applications is to introduce a “windowing” function to multiply the cell information with. The effect of a “windowing” function is to reduce the image signal continuously from the center outwards, down to zero along the edges, thus diminishing the number of frequency components introduced due to edge effects.
Although we evaluated windowing methods in this study, we chose a more straightforward approach, namely averaging transformed cell information extracted with steps of less than a cell size. It turns out that CFA to a considerable degree suppresses artificial components as they tend not to be dominant. Therefore, averaging pixel information from amplified cells that were extracted at step sizes (row- and column-wise) of eight pixels or less (at a cell size of 32-by-32 pixels-squared) left edge-effects undetectable from an FAR/FRR perspective. We adopted an eight pixel step-size. Typically, this implies that a resulting pixel value is an average of 25 (5x5) spatially offset transforms.
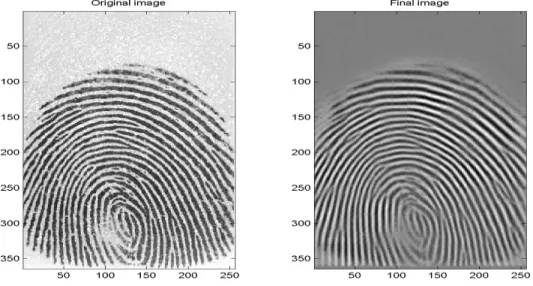
Figure 11: An image before and after pre-processing with k=0.8.
8 Database runs and their results
FAR and FRR may be sampled through runs against fingerprint databases (a so-called technical evaluation). The databases used here (DB1a, DB2a, DB4a) feature 8 images of each of 100 fingers (see Table 1). Each of the 100 individual patterns may thus be compared to 99 others, allowing for 100x99 = 9900 samplings of the FAR. The first image of each of the 100 fingers was compared to each of the remaining images for that finger, allowing for 100x7 = 700 samplings of the FRR.
8.1 Results
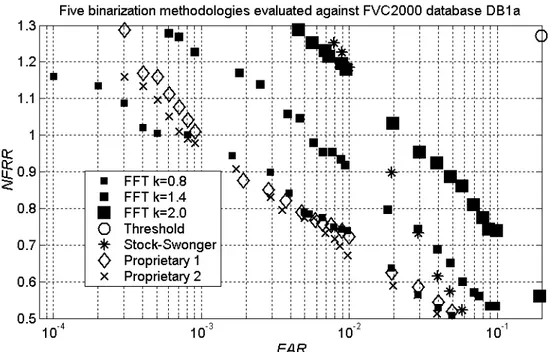
The measured FAR/FRR performance is given as ROC curves (cf. Section 1.3.5) in Figures 12-14. The figures depict performance measured against FVC2000 databases DB1a, DB2a, and DB4a (Figure 12, 13, and 14, respectively). Symbols depict performance for CFA preprocessing with image enhancement exponents k=0.8, 1.4, and 2.0, respectively (shown as small, medium, and large filled rectangles, respectively). Enhancement exponents other than k=0.8 were included in the graphs in order to illustrate the iterative approaches described in Section 7; in particular the fact is to be noted that performance deteriorates with enhancement exponents above roughly 0.8 (see Section 9 for a discussion of this phenomenon).
The preprocessing methods subject to comparison are “Threshold”, “Stock-Swonger”, “Proprietary 1”, and “Proprietary 2” (see Section 6.2). The corresponding results are given in Figures 12-14 as empty circles (“Threshold”), asterisks (“Stock-Swonger”), empty diamonds (“Proprietary 1”), and crosses (“Proprietary 2”), respectively.
Figure 12: Results for database 1a.
Figure 14: Results for database 4a.
It is to be noted that the graphs display a number of “oddities” that make their interpretation somewhat more difficult.
• The values along the FRR axis are given as “normalized” values; thus, the unfamiliar acronym “NFRR” appears. Normalization sets NFRR performance for an FAR of 1/1000 to a value of one for CFA with k=0.8. That FAR value represents a typical operational value.
• The NFRR and FAR axes are drastically cropped. Typically, one would appreciate being able to follow the ROC curves from the lowest FAR to the highest. In particular, the performance of the “Threshold” preprocessing method (i.e. no preprocessing takes place before binarization; only a threshold is determined) is hardly discernable; it is obvious, however, that this method performs the worst, by far.
• No error-bars are given. Typically, measurements shall be accompanied by corresponding error-bars illustrating the uncertainties associated with the measurements. It can be stated here, however, that the differences between CFA and the other preprocessing methods is well over 3 standard deviations for databases 1A and 2A, in the FAR regime 1/1000 to 1/10000, which is the region of interest from an operational viewpoint. The reason that this regime is of interest from an operational viewpoint, is that these are the levels of security delivered by a 4-digit PIN code system (one or more tries at 1/10000).
The explanation for these “oddities” is that Precise Biometrics has a policy of not communicating ROC curves for databases that have not been collected with their brand of readers. Performance could in those cases be considered sub-optimal, and although the interested reader may understand that graphs given are experimental, the market may not. Each of the introduced “oddities” (not communicating absolute FRR values, not plotting the full ROC-curves, not giving error bars) hampers the full reconstruction of performance, which would infringe on that policy.
9 Discussion
Biometric functionality depends on universality, durability, uniqueness, measurability, and usability (see Section 1.2). The first three attributes are associated with the nature of the biometric trait in itself (“How unique is a fingerprint?” etc.). “Measurability” and “usability”, however, are concerned with the sampling of that trait and are therefore subject to introduced noise. This study is concerned with compensating for noise introduced by technologies to sample the fingerprint; in particular, structural noise caused by dry or wet fingers.
The hypothesis to be tested was that the cellular frequency amplification method provides a straightforward approach that is efficient for noisy images. In particular, the “straightforwardness” of the approach lies in the fact that it is derived from basic mathematical principles rather than relies on “ad-hoc” rules developed from experience with fingerprints. This should help future analysis, as experience may be drawn from a much larger body of knowledge. There is also a number of systems that implement similar technologies in fields not related to fingerprint.
Three FVC2000 databases were selected for reasons of applicability, i.e. their nature with respect to dimension and image quality resemble Precise Biometrics readers. For reasons that are not clear, they present a large amount of images that contain structured noise due to either dryness or wetness. Therefore, they are particularly suitable for measuring the effectiveness of various preprocessing methods under these circumstances. Minimizing structural noise due to either dryness or wetness is of great importance when trying to improve the “measurability” and “usability” of a fingerprint-based biometric authentication system. The presented ROC curves are a way to measure and compare the effect of structural noise, from an authentication perspective, in a quantitative way. If the repaired image truly corresponds to the individual underlying pattern to a higher degree than the original, then more characteristics will be extracted reliably, and FAR/FRR performance improves.
The FVC2000 databases used were DB1a, DB2a and DB4a. The FAR/FRR performance reached by adopting CFA as a pre-processing step, followed by a thresholding step, has been compared quantitatively with four other preprocessing methods: thresholding, “Stock-Swonger”, and two methods proprietary to Precise Biometrics AB.
It turns out that CFA for all databases performs at least as well as the two selected proprietary preprocessing algorithms, outperforms the public-domain “Stock-Swonger” algorithm, and far outperforms binarization by simple thresholding.
The improvement that CFA contributes to FAR/FRR performance for these databases, characterized by a large number of images with structural noise due to dryness or wetness, is notable. In the FAR regime 1/1000 to 1/10000, which is the region of interest from an operational viewpoint, CFA yields FRR values that are up to one-fifth lower than for the next-best preprocessing method. CFA is never outperformed by any of the other
10 Conclusions
“Measurability” and “usability“ of the fingerprint biometric depend heavily on an authentication algorithm’s ability to handle noise introduced to the images. This noise is typically caused by finger dryness or wetness.
Willis and Myers (2001) have introduced a preprocessing method that they conclude repairs poor quality fingerprint images. We show, for a number of relevant databases, that their preprocessing method of Cellular Frequency Amplification (CFA) improves the FAR/FRR performance for a Precise Biometrics authentication algorithm. This not only corroborates the findings by Willis and Myers, but strengthens them from an authentication perspective: The improved FAR/FRR performance shows that CFA manages to extract the underlying pattern in the noisy fingerprint databases to a larger extent than the four alternative preprocessing methods that were evaluated. These methods were thresholding, Stock-Swonger, and two proprietary algorithms.
CFA performs at least as well as the two selected proprietary preprocessing algorithms, outperforms the public-domain “Stock-Swonger” algorithm, and far outperforms binarization by simple thresholding.
In the FAR regime 1/1000 to 1/10000, which is a region of interest from an operational viewpoint as it mimics a 4-digit PIN code, CFA yields FRR values up to one-fifth lower than for the next-best preprocessing method.
In the optimization of CFA, we find a characteristic scale of 2 mm in the fingerprint, over which the pattern of interest remains stable (no large changes in spatial frequency or direction occur).
An image enhancement exponent of k=0.8 is found to be optimal. Larger exponents perform less well due to the fact that higher-order characteristics in the fingerprint pattern are increasingly suppressed together with the structural noise.
11 Acknowledgements
The author would like to thank Precise Biometrics AB for financing this Thesis work. A special thank goes to my supervisor Helmuth Kristen for guidance in the world of biometrics and interesting discussions based on his curiosity and boundless inspiration for scientific work.
12 References
Cases, P., “The False Rejection Rate in Fingerprint Biometric Verification Systems – Statistical Results and Proposed Improvements”. Master’s Thesis, Lund Institute of Technology, Center for Mathematical Sciences, 2001
Efford, N., “Digital Image Processing (a practical introduction using Java)”, 2000 Gonzales, R.C., Woods, R.E., “Digital Image Processing”. Addison Wesley, 1993
Jain, A., Hong, L., Pankanti, S., Bolle, R., ”An Identity- Authentication System using Fingerprints”. Proceedings of the IEEE, vol. 85, No. 9,1365-1388, 1997
Johansson, J., Kristen, H., “Finger Pattern Correlation Length Estimated by Similarity Statistics”. in preparation, 2003
Maltoni, D., Maio, D., Jain, A.K., Prabhakar, S., “Handbook of Fingerprint Recognition”. Springer, New York, 2003
Neyman, J., Pearson, E.S., “On the problem of the most efficient tests of statistical hypotheses”. Philosophical Transactions, A231:289-337, 1933
Pankanti, S., Prabhakar, S., Jain, A.K., ”On the Individuality of Fingerprints”. Proceedings of the IEEE Computer Society Conference on Computer Vision and Pattern Recognition, Hawaii, December 11-13, 2001, 2002
Stock, R.M., Swonger, C.W., “Development and evaluation of a reader of fingerprint minutiae”. Cornell Aeronautical Laboratory, Technical Report CAL No. XM-2478-X-1:13-17, 1969
Willis, A.J., Myers, L., “A cost-effective fingerprint recognition system for use with low- quality prints and damaged fingertips”. Pattern Recognition, 34, 2001
12.1 URLs
http://stat.tamu.edu/~biometrics/
“Biometrics” – a journal of the International Biometric Society
http://whatis.techtarget.com/definition/0,289893,sid9_gci211666,00.html
Information about biometrics from an IT-specific encyclopedia; by SearchTechTarget.com
http://home.t-online.de/home/manfred.bromba/biofaqe.htm#Autorisierung
FAQ about bioidentification by Dr. Manfred Bromba
http://bias.csr.unibo.it/fvc2000/databases.asp
13 Appendix
The Matlab code used for database preprocessing follows. Comments in the form of numbers in parentheses indicate the corresponding activities in the flowchart depicted in Figure 8.
function [B] = databaseloop(i,j,s) % i is the nr of different % images(outer loop)
% j is the nr of images for the % same finger(inner loop)
% s is the matrix size
path('D:\FPI\DB4A_k=0.8',path); for x = 1:1:i
for y = 1:1:j
instring = sprintf('D:/FPI/DB4A_k=0.8/%d_%d.tif',x,y) %% (1)
B = cfa(instring,s); utstring =
sprintf('D:/Sanda_bilder_2/FVC2000_kblabla/%d_%d.tif',x,y)
[m,n]= size(B); B = B - (ones(m,n)* (min(min(B)))); B = B* (255/(max(max(B)))); B= uint8(ceil(B)); imwrite(B,utstring,'tif'); %% (13) end end
function [BC] = cfa(inname,s) % s is the matrix size
A = imread(innamn); [m,n] = size(A); B = zeros(m,n); C = zeros(m-4,n-4); %% DB1A (300x300) C = zeros(m-4,n); %% DB2A (364x256) C = zeros(m,n); %% DB4A (320x240) BC = ones(m,n); ETTAN = ones(s,s); inblock = zeros(s,s); %% (2) for row = 1:8:(m-(s-1)) for col = 1:8:(n-(s-1))
inblock = A(row:row+s-1, col:col+s-1); %% (3)
RNEWIM = ones(s,s); %% (4)
ETTAN; %% (11)
end
end
C1 = ones((m-4),4); %% concatenating DB1A
C2 = ones(4,n); %% concatenating DB1A
C = [C C1;C2]; %% concatenating DB1A
C1=ones(4, n); %% concatenating DB2A
C = [C;C1]; %% concatenating DB2A C(1,1); [M,N] = size(C); C(M,N); BC= B./C; %% (12)
function outblock = powermult(inblock);
fa = fft2(inblock); %% (5) ftf = (atan2(imag(fa),real(fa))); %% (6) faa =fftshift(sqrt(real(fa).^2+imag(fa).^2)); %% (7) absfaa = (faa.^(0.8)); %% (8)
sumfaaprod = ifftshift(faa .* absfaa);
newim = ifft2(sumfaaprod .*exp(j*ftf)); %% (9)
outblock = real(newim);