T-1376
ADSORPTION OF GASES ON
HETEROGENEOUS SURFACE
by
ProQuest Number: 10781726
All rights reserved INFORMATION TO ALL USERS
The qu ality of this repro d u ctio n is d e p e n d e n t upon the q u ality of the copy subm itted. In the unlikely e v e n t that the a u th o r did not send a c o m p le te m anuscript and there are missing pages, these will be note d . Also, if m aterial had to be rem oved,
a n o te will in d ica te the deletion.
uest
ProQuest 10781726
Published by ProQuest LLC(2018). C op yrig ht of the Dissertation is held by the Author. All rights reserved.
This work is protected against unauthorized copying under Title 17, United States C o d e M icroform Edition © ProQuest LLC.
ProQuest LLC.
789 East Eisenhower Parkway P.O. Box 1346
T-1376
A Thesis submitted to the Faculty and the Board of Trustees of the Colorado School of Mines in partial
fulfillment of the requirements for the degree of Master of Science in Chemical and Petroleum Refining Engineering.
» Karan S7C Signed i A o J a V Gaur Golden, Colorado Date* 1971 Approvedi s Advisor Golden, Colorado Date. frvict'~l »-g of Department ,1971 / ii
T-1376
A B S T R A C T
G° ^ ° % *Q Q*
A static system was used to measure the pure component isotherms of freon-21(CHFClg) and ethyl chloride. The measurements were made at 323°K and at pressure range from 0 to 695 mm of mercury. Binary
mixture measurements were also made at the same temperature and at the system pressure of 560 mm of mercury. The
simplified method of Kidnay and Myers was used to predict mixture isotherms using only the pure component isotherms.
T-1376
Affectionately to
my mother
T-1376
TABLE OF CONTENTS
Page
ABSTRACT... iii
DEDICATION... iv
CONTENTS OF APPENDIX... vii
LIST OF FIGURES... viii
ACKNOWLEDGMENTS... ix INTRODUCTION... 1 THEORY OF ADSORPTION... k MATERIALS... 7 Adsorbent... ••••••••••••••••••••••••••••.•••••••• 7 Adsorbates. • •••••••••••••••... 7
EQUIPMENT AND PROCEDURE... 9
Pure Component Measurements••••••••••••••••••••••••••• 9 Measurement ofthe Dead Volume of the system...• 9
Reactivation of the Adsorbent••••••... •••••••• 12
Measurement of the Pure Gas Adsorption.•••••••••••• 12 Mixture Measurements• ••••... ••••••••••••••••••• 15
Reactivation of the Adsorbent.«•••••• •••••••• 15 Introduction of the Gas Mixtures• •••••• ••••• 15 Chromotographic Analysis of the Gas-Phase at Equilibrium.••••••••• •••••••••••••••••••••• 16 Analysis of Gases Using Gas Chromotography...••••••••• 18
Gas Sampling. .... ••••••••••• 18
T-13?6
Chromotograph Column.•••••••••••••••••••••••••••••••• 18
Column Conditioning. ••••••••••••••••... 19
Chromotograph detector••••••••••••••••••••••••••«•••• 20 RESULTS... 22
Pure Component Adsorption Isotherms •••••••... 22
Binary Mixture Adsorption Isotherms.•••••••••••••••••••• 25 SUMMARY ... 27
NOTATION... 28
REFERENCES ... 30
APPENDIX... 33
T-1376
CONTENTS OF THE APPENDIX
Page
I* PURE COMPONENT DATA... 33
Total Dead Volume data. •••••••••••• ... 33
Dead Volume in Air data. ... •••••••• 3k
Pure Ethyl Chloride data.•••••••••••••••••••••••• 35 Pure Freon-21 data.•••••••••••••••••••••••••••••• 36
II. CALCULATION OF PURE COMPONENT MEASUREMENTS 37
Sample calculation for Total Dead Volume of the
System.•••••••••.... 39
Sample Calculation for Pure Gas(Freon-21 )•••••••• 4-0 III. BINARY MIXTURE ADSORPTION DATA... k3 IV. CALCULATION OF MIXTURE MEASUREMENTS... 56 V. PREDICTION OF MIXTURE ISOTHERMS... 6k VI. ERROR ESTIMATION... 6?
T-1376
LIST OF FIGURES
Figure Page
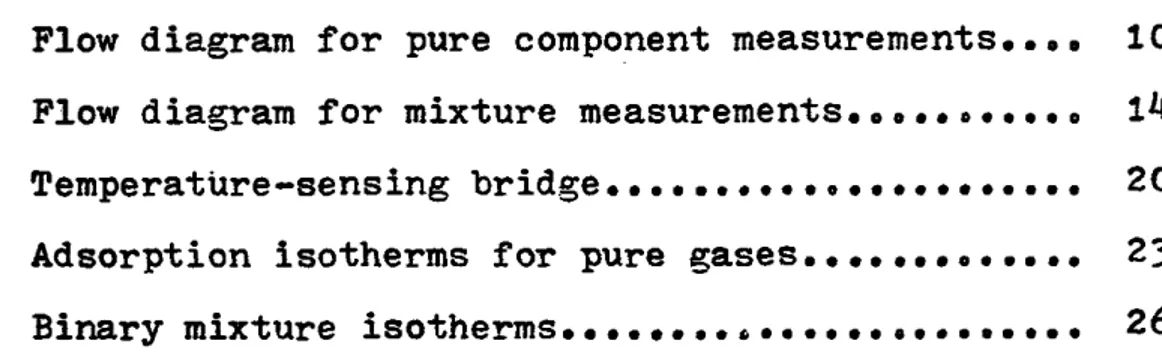
!• Flow diagram for pure component measurements.... 10 2. Flow diagram for mixture measurements... Ik 3. Temperature-sensing bridge•••••••••••••••.... 20
k m Adsorption isotherms for pure g a s e s 23
5. Binary mixture isotherms••••••••«••••••••••••••• 26
T-1376
A C K N O W L E D G M E N T S
The author wishes to express his sincere appreciation for the guidance he received from Dr. A.J. Kidnay during the course of this investigation.
Thanks are also due to professors J.O. Golden and A.J. Boes for their participation on the thesis committee.
T-1376
I N T R O D U C T I O N
Adsorption has been an important method of commercial and laboratory separations® Solid adsorbents are commonly employed in industrial catalytic reactors® The surfaces of these adsorbents are heterogeneous with respect to their adsorption potential; that is the interaction energy between an adsorbed molecule and its surface site is not uniform over the surface® Homogeneous surfaces are of interest mainly for fundamental research and for theoretical purposes® These sur faces are of no commercial interest® Heterogeneity is of major importance in the monolayer region of adsorption, since it is in this region that molecules come in direct contact with the adsorbing surface.
Many studies have been made of physical adsorption of pure gases on solid surfaces, and attempts to extend such
studies to gaseous mixtures have also received much attention® Only relatively few papers are to be found in literature
which discuss mixture adsorption equilibria®
T-1376 2
During the past, mixed gas adsorption calculations were mainly made by deriving a mixture adsorption isotherm by combining the constants from the isotherms for the pure components. This treatment is, of course, analogous to the method used in developing equations of state for gas mixtures. This approach to mixture adsorption, however, has been based on many untenable assumptions and on empirical arguments.
Recently, two major advances have been made in the theory of gas mixture adsorption? the first is due to Myers and Prausnitz (1) and the second is due to Hoory and
Prausnitz (2). Myers and Prausnitz (1) present a thermodynamic analysis for gas mixture adsorption that is similar to that
used for vapor-liquid equilibria. They define an ideal adsorbed solution, and develop equations for calculating the activity coefficients of the adsorbed phase. Attempts have been made by Kidnay and Myers (3) to modify the equations of Myers and Prausnitz (1). Henson and Kabel (*0 further extended the development of Myers and Prausnitz (l) to include adsorption from a saturated vapor. Hoory and Prasnitz (2) generalize the equations developed by Ross and Oliver (5) for pure gases to the adsorption of gas mixtures. The development of Hoory and Prausnitz (2) differs from that of Myers and Prausnitz (l) in two respectsi first they relate nonideality of mixing in the monolayer to constants in a two-dimensional equation of state,and second they introduce surface heterogeneity in an explicit manner through the use of distribution function.
T-1376 3
The objective of this research was to make a series of measurements on the adsorption of selected pure gases and their binary mixtures on heterogeneous surfaces. The adsorbent selected was Linde Molecular Sieves 13 x, a highly porous material. The gases selected were freon-21 and ethyl chloride. The experimental data obtained provide a good comparision with the predicted
T-1376
THEORY OF ADSORPTION
Adsorption of gas on a solid particle can be described by a three step mechanismi
1) Diffusion of the component from the mainstream of the gas to the external surface of the adsorbent particle (external diffusion).
2) diffusion into the particle through pores (intraparticle diffusion), and
3) adsorption on the interface of the pore
The customary method of correlating adsorption equilibria involves isothermal treatment of the data. Many adsorption isotherms for single-component systems have been proposed over the years. Among the first was the Freundlich isotherm
N = Kp*/n (1)
In recent years this7 form has been derived on
theoretical grounds (6). The Langmuir isotherm (7) in its simplest form
/ m aP , .
T-1376 5
has been widely used to fit isothermal adsorption data and was originally derived from thermodynamic principles assuming adsorption in a single molecular layer. It has been rederived from kinetic(8) and statistical (9) considerations as well. The equation has also been derived by Schay (10) without
resorting to the limitation of no molecular interaction present in the original derivations. If the adsorption is multilayer, the more general isotherm of Brunauer, Emmet and Teller (11) *is a good starting point. More sophisticated approaches seem
necessary when dealing with systems where Knudsen flow and internal molecular adsorption exist.
Adsorption of multicomponent mixtures has received less attention than pure-component adsorption; although industrial applications commonly deal with mixtures. Markham and
Benton (12) extended Langmuirs isotherm to mixtures by deriving results in two equations which assume no interaction between the adsorbed components. Schay (13) has developed a similar equation which considers interaction of the components and gives a better prediction of adsorption from mixtures
especially at higher partial pressures. In the model these interaction coefficients, are a complex function of the two-dimensional residual volumes of the components of the mixture, the maximum capacity of the adsorbent, and the adsorbent area. The resulting equation for multicomponent adsorption becomes
N _ (3)
T-1376 6
The potential theory of adsorption was first advanced and developed by Polanyi (1^,15*16,17) and used by others, such as Lewis (8,18) and Dubinin (19)• The theory, based on thermodynamic principles, states that enough work must be
supplied to compress the gaseous molecules into their adsorbed state such that
where is the work required to compress molecules from the °gas phase to adsorbate in the ith layer. This work or
adsorption potential varies from zero for the outer layer to some maximum at the solid-adsorbate interface. The adsorption potential E^ is a characteristic function of the amount of adsorbed material. A characteristic curve for a given adsorbate-adsorbent system may be established*
Once it has been determined for a temperature the curve will yield adsorption isotherms at any other temperature. This theory has been used to correlate adsorption data, but no
critical test has been possible because the adsorbed phase density has never been evaluated or predicted successfully.
(4)
T-1376
M A T E R I A L S
Adsorbent*
The adsorbent selected for this study was Linde Molecular Sieves 13x. The sieve used was in the form of l/l6M in#
pellets.
The Linde sieve 13x is a Gaussian adsorbent, whose
heterogenietyis described by a Gaussian distribution of adsorp
tive potentials. It is a synthetic Zeolite(Calcium substituted alumina silicate) based on the faujasite structural framework. It possesses high porosity, with pores (in reality, lattice
vacancies) of uniform size and essentially molecular dimensions. It adsorbs small molecules only, is selective on molecular shape, and have a particular affinity for unsaturated and polar
molecules. The opening into the cavity was about 5A° in diameter.
Molecular sieves are used primarily in gas treatment but also are effective for drying organic liquids.
Adsorbates*
The gases selected for this investigation were freon-21 7
T-1376 8
and ethyl chloride. The gases were of research grade, with purities of 99*95#« Freon-21 is colorless, non-flammable,
non-toxic, and is mainly used as a refrigerent and as a solvent. Ethyl chloride is colorless, highly flammable and toxic. It is mainly used as refrigerent and solvent. Both the gases have approximately the same thermal conductivity.
T-1376
EQUIPMENT AND PROCEDURE
In the first phase of the investigation, pure component measurements were made. The flow-diagram for the apparatus
is shown in Figure 1. In the second phase of the investiga tion, the equipment was modified to allow mixture measurements to he made. The flow diagram for the mixture adsorption is shown in Figure 2. The pure gas data are tabulated in
appendix 1 and the mixture data are tabulated in appendix. 3. Pure Component Measurements
The pure component measurements were made in three steps *
* Measurement of the dead volume of the system, Reactivation of the adsorbent,
Measurement of the pure gas adsorption.
Measurement of the dead volume of the system1 The step-wise procedure is as follows*
a. Keep valve k and 5 closed and start vacuum pump 1
* The adsorption system includes everything right of valve I to the reference point on the left leg of the manometer.
T-1376
DESCRIPTION OF SYMBOLS USED IN FLOW SHEET
•1* Pure gas cylinder 2, Helium gas cylinder 3. 100 cc gas burette
Constant temperature water bath 5. Adsorbent cell
6. Constant volume mercury manometer with 10 mm ID bore tubing.
7« Mercury trap
8. Molecular sieve column for pressure drops 9. Mercury trap
10. Molecular sieve column for pressure drops Valves 1 and 6 are l/8M OD Whitey
Valves 2 and 5 are l/k" OD Whitey 1 Valves I and IV are two way glass stopper Valves II and III are three way glass stopper Vacuum pump 1 and 2 are two vacuum pumps
/
/
F i g u r e 1 F l o w d i a g r a m fo r p u r e c o m p o n e n t me asurement
T-1376 11
and 2.
b. Open valves k and 5 simultaneously so that mercury in reservoir under the manometer does not rise in the
legs of manometer. Open valves 6 and I to pull a vacuum on the back line and gas-burette. Keep valves II and IV closed.
c. After about two hours, close valve 6 and open valve 2. Allow helium to flow in the burette by opening valve I.
»
d. Open valve IV and bring the gas-burette to atmospheric pressure with helium. Adjust the mercury in both arms of the burette to the same level by opening valve II to vacuum line or the pressure line. This is the initial reading of the burette.
e. Raise mercury in the manometer to isolate the adsorption system by opening valve III to the pressure line.
Initially under good vacuum, the mercury in the manometer legs will be at the same level. Allow some helium to flow in the system by opening valve I to the system. Again bring the mercury in both arms of the burette to the same level. This will be the final burette reading.
f. Bring the mercury in the manometer to the reference point by adjusting valve III to the pressure line or the
vacuum line. The mercury level at the reference point keeps the system voldme constant. Read the system pressure i.e. difference in mercury-level in both legs
T-1376 12
of manometer*
g* Note the following things:
Atmospheric pressure and temperature, initial and final burette readings, system pressure and room temperature* See appendix 2 for the calculation of the dead volume of the system.
h. Add more helium to increase the system pressure differ entially to obtain some more readings*
Reactivation of Adsorbent: Repeat steps a and b of procedure I for about 2b hours while heating the adsorbent cell to about 380°F in a wax-bath and keeping valve 2 closed. The wax used for heating was petroleum wax with melting point range 112-124°F and flash point range bl0-^30°F. The wax was melted in a 500 ml beaker. The temperature was controlled by using a powerstat.
Measurement of the pure gas adscrption: The step-wise procedure is as follows:
a* Close valves I and 6. Allow one of the gases to flow in the gas-burette by opening valves I and 1. Open valve IV to allow the gas in the burette to come to atmospheric pressure* Bring the mercury to the same level in both arms of the burette* This is the initial burette
reading.
b* Remove the wax bath from around the adsorbent cell and replace it with a water bath adjusted to maintain a temperature of 50^C.
T-1376 13
c. Repeat steps e through g as in the case of dead volume measurements.
Repeat the steps above for another gas. See appendix l for tabulation of the pure gas measurements.
T-1376 14
DESCRIPTION OF SYMBOLS USED IN FLOW SHEET
1. Pure gas cylinder 2. Helium gas cylinder
100 cc gas burette
4, Constant temperature water bath 5* Adsorbent cell
6. Constant volume mercury manometer with 10 mm ID bore tubing.
7• Mercury trap
8. Gas chromatograph 9* Mercury trap
10. Molecular sieve column for pressure drop
Valves 1,6 and 8 through 10 are 1/8" 0D Whitey Valves 2 through 5 and 7 are 1/4” 0D Whitey Valves I and IV are two way glass stopper •Valves II and III ar£ three way glass stopper
V.P. 1 and 2 are two Vacuum pump C.P. circulation pump.
« « i » » l v O •» 1.1 +> c <D B q> u 3 » as 0) 6 0) +> X c § & of £ o CM a> $4 3 W> •rl
T-1376 15
Procedure for Mixture Isotherm
Measurements for binary mixtures were made in 3 steps: Reactivation of the adsorbent
Introduction of the gas mixtures
Chromatographic analysis of the gas-phase at equilibrium Reactivation of adsorbent: First fill the system between
valves 8,9 and 10 with helium. Close the valves 8,9 and 10 and reactivate the adsorbent as in step II of the procedure •for pure component measurements. The reason for isolating
part of the system is that the chromatograph sample valve is not entirely leak-proof. The rest of the system is leak- tight so at atmospheric system pressure we can make mixture measurements. After about 2k hours, remove the wax bath.
Introduction of the gas mixtures: The step-wise procedure is as follows:
a. Close valve 6. Open valve 1 to let one of the pure gas into the burette. Close valve I and measure the volume of gas in the burette by opening valve IV and bringing the mercury to the same level in both arms of the
burette. Note the reading. The volume of gas is the burette reading plus the uncalibrated volume of burette, b* Change the pure gas cylinder and evacuate the line from
the gas-cylinder to valve 6 by opening valve 6. After half an hour, close valve 6 and open valve 1. Slowly
/
open valve I and let the gas into the burette. Close
T-1376
16
valves I and 1. Bring the mercury to the same level and note the reading. The volume of gas introduced in this step is the difference between the two burette
readings. These two volume gives the composition of the binary mixtures. Raise and lower mercury in burette few time by means of valve II to mix the gases.
c. Raise the mercury in manometer legs by opening valve III to the pressure line, and open valve I to the adsorption system to let the gas mixture in the burette flow in. At the same time put the constant temperature water bath under the adsorbent and adjust it to maintain the bath temperature at 50°C. Note the volume of the mixture introduced.
d. The system pressure does not reach atmospheric pressure and so another mixture of about the same composition is prepared and introduced into the system to bring the system pressure to about atmospheric pressure.
e. Open valves 8 and 10. Keep valves 9 closed and switch on the circulation pump to circulate the mixture around the system. After about 26 to 30 hours switch-off the circulation pump and run the chromotographic analysis of the gas mixture in the sample loop. At this time read and note atmospheric pressure and temperature, the temperature of the water bath and the system pressure. Chromotographic analysis of the gas-phase at equilibrium: The
T-13?6 17
step-wise procedure is as follows*
a. Set the helium carrier gas flow through the chrom to- graph to about 10 psig. Switch on the recorder and thermal conductivity circuit and allow few minutes to stabilize the recorder.
b. During the introduction of gas mixture, the sample valve remains in position 1 so that it is connected to the system. The sample valve is now switched to
position two so that the equilibrium gas mixture in the loop will be carried to the chrom otograph. Measure and record the peak heights. Since the thermal conductivities of the two gases are about same, the peak heights were used to get the compositions.
Repeat the above steps at various compositions at a fixed pressure and temperature for the system.
T-1376 18
Analysis of Gases using Gas Chromotograohv?
Gas chromotographic technique was used in this study to determine the equilibrium composition of gases in a binary mixture«
Chromotography is a physical method of separation in which the components to be separated are distributed between two phases, one of which is a stationary bed of large area and the other, a fluid that percolates through the stationary bed.
The gas chromotograph utilized in this investigation was manufactured by Podbielniak Inc. It consists of a carrier gas system, gas and liquid injection system, column and detection system.
Gas Sampling?
Gas samples are usually injected either by a gas-tight syringe or a gas-sampling valve.
The gas-sampling valve used in this investigation was the Perkin-Elmer precision type. It is mainly a rotating stainless steel body and Teflon valve rotor. In one position a sample loop of known volume is filled at a known pressure and then swept into the column when the valve is rotated to the second position. Valves should permit reproducible in’jection to with in l/2 percent.
Chromotograph Column?
The preparation of a packed gas chromotograph column may be devided into five separate steps. The solid support must be obtained and subjected to particle-size grading. It
T-1376 19
may also be treated with various chemicals to modify it in way# The stationary phase must be obtained or made. This is the material which is responsible for the separation, and may be a silicone fluid, a polyester or any number of relatively low-vapor-pressure materials? the stationary phase must be coated on the support. The next step is to pack the column
with the coated packing. Finally the column must be conditioned prior to use.
The gas chromatograph column was manufactured by Beckman Corporation. Following are the data on this columnt
Type t Material1 Dimensions s Partition liquids Inert Support s Maximum Recommended GC-2A Copper length - 12 feet CD - 1/4"
Dow Corning 200-500 (20# weight ratio)
Chrom P (*1*2/60 mesh size)
Temperatures 250 C
Maximum 1
Usable
Temperatures 275 0 Column Conditionings
There are three reasons for conditioning columns prior
/
to uses
1. To reduce background due to column bleed.
T-13?6 20
3# To avoid contamination of detectors, feed-throughs, etc. by partition liquid light ends.
The time and temperature for conditioning will vary with the type of partition liquid and the percentage coating, the sensitivity required for the analysis, whether temperature programming is to be used and to some extent on the column length, diameter and flow rate. The column outlet should be
disconnected during the conditioning period to avoid accumulation of stationary phase or its decomposition products in the
detector.
Chromotograoh Detector»
The detector used in this instrument is of thermal conductivity type. The thermal conductivity unit has the
advantage of being moderate in'cost, and satisfactorily sensitive to any sample component having different conductivity than
the carrier gas. This sensitivity arises from the fact that a thermal conductivity detector is basically a wheatstone bridge, which is among the most sensitive of the simple electrical measuring circuits •
The characteristic of thermal conductivity detectors
which makes them responsive to changes in effluent gas composition also makes them responsive to a very small temperature changes due to other factors. An easy calculation, based on the
equations in Fig. 3t will show that a temperature differential between the sensing resistance filaments of only 0.0005°C will
Rs
R
r OUT .4 5 1 OUT " 2 — » E ( A R = r c - rr ) 'OUT OUT R« Rs 2 + RINS " R + RLEADSFigure 3. TEMPERATURE - SENSING BRIDGE
T-13?6
21
produce an output of 5 v, or 0.5# full scale pen movement in a 1-mv recorder, with a detector current of 300 ma. With
thermistor-sensing elements the same 5 v output will be caused by 0.00015°C change in one element of a detector at 200°C.
Only a 0.00007°C change would cause a 5 v output from a detector at 25°C.
Such small temperature changes can be caused by variations in carrier gas flow, drafts on the instrument, line voltage variations on the heating element.
Other characteristics of test samples, such as specific heat and density as well as operational parameters of
temperature, gas turbulence in the filament zones, and radiant and conductive heat exchange between detector body and filam ent also measurably influence the detector response to
T-1376
22
R E S U L T S
The results are discussed in two parts* Pure component adsorption isotherms Binary mixture adsorption isotherms
Pure Component Adsorption Isotherms
The isotherms of pure freon-21 and ethyl chloride are
presented in figure and the results are tabulated in Tablel. The results are reported as volume adsorbed at STP per gram of adsorbent as a function of equilibrium system pressure in mm of mercury.
Patel(32) has studied the adsorption of freon-21 and ethyl chloride on sterling FT-D5 carbon black ( Homogeneous surface). The results are given in Table 2.
Comparing the results obtained by him with the results
/
of this study, it seems that the amount of the gases adsorbed at STP per gram of adsorbent is considerably higher in the case of molecular sieve. The probable reason for the higher adsorption in case of molecular sieve may be its high
o o CM CM fe M < o O o a) •o •H H O jc O CM cn H >>+» a* +> « T3 C of X rN w *4 at CM W O , © - 'w ^ rHOfe 3 _ O £ <M © 6 O H o 2 S s & ° 3*h © w +> *o © ^ -H &« to •a C < o © u h£> O 00 O NOo xno o oC^N VfNCM
T-13?6 23
Table 1
Pure Component Isotherms (Linde Molecular Sieve 13X)
Pressure mm of Hg Freon-21, 323°K Amount adsorbed cc(STP)/gm. Ethyl Chloride 323°K Pressure Amount mm of Hg adsorbed ce(STP)/gm 4-0.0 54.25 23.0 45.00 100.5 60.00 66.0 57.90 220.0 64.60 159.0 62.30 330.0 68.0 251.0 63.40 4-07.0 70.76 333.0 66.00 4-93.0 76.05 11-35.0 67.80 556.0 77.51 490.0 70.50 615.0 80.03 570.0 72.44 695.0 75.73 /
T-1376 24
*
Table 2
Pure Component Isotherms (Sterling FT-D5 Carbon Black)
Freon-21, 323°K Ethyl chloride, 323°K
Pressure Amount adsorbed Pressure Amount adsorbed
mm of Hg cc(STP)/gram mm of Hg cc (STP)/gram 35.3 0.21 58.3 0.29 139.3 0.88 14-6.2 0.75 262.6 1.35 260.9 1.30 377.9 1.70 358.5 1.55 4-66.0 2.06 477.9 1.85 573.1 2.4-0 590.5 2.33
T-1376 25
porosity and its molecular structure*
Binary Adsorption Isotherms
The isotherms for mixtures of freon-21 and ethyl chloride are shown in figure 5 and are tabulated in Table 3«
There are a number of techniques in the literature: for predicting mixture adsorption isotherms using pure component
isotherms and most of these are summarized by Young and Crowell(22). The simplified method of Kidnay and Myers (3) was used in this
study*
A comparison of calculated and experimental values are shown in figure 5• Details of the calculations are in given in Appendix 5«
The results presented in Table 3 shows that the total amount adsorbed per gram of adsorbent is independent of the composition* The results obtained by Patel (32) for the adsorption of the mixture of freon-21 and ethyl chloride on carbon black (Sterling FT-D5) were in good agreement with the results by Kidnay and Myers simplified method* However, in the present study the results for the adsorption of the same
gases on Linde Moleular Sieve 13X were in poor agreement and deviated considerably from those predicted by Kidnay and
Myers simplified method. The disagreement between experimental and predicted results in this study may be mainly due to
the non-ideality that exists in the adsorbed phase. It is quite likely also because of contamination of gas streams and the molecular sieve bed.
Figure 5
Ethyl chloride Freon-21
Experimental
Predicted by Kidnay and Myers simplified method
V o l . a d s o r b e d ( S T P ) m l / g m of a d s o r b e n t T-1376 20 10 0.2 0.6 0.8 1.0 / Y - Freon-21
Figure 5. Freon-21 Ethyl chloride adsorption on Linde Moleular Sieve 13X. at K
Mix tu r e A d s o r p t i o n I s o t h e r m s T-1376 26 o> •o •H c u o o H H -P A •H O CO O H A > 5 £ x: o -p 0 w 0) (0 rH Ctf CM jC I A C 1 o 00 a> Qj J-i O A Q> -£*H So u s. o A A £h O CO rH O >i O A -P to w <D u o CO rd <J H CM I c c c o O 0) i £ c • 3 o oc S5 o xn • pH CM o o • o VO XA 00 c^-o o d to U A 3 vo VO CO «H xn \o CO 0 xn vA © U £ A £ o CM • rH xn O m • 00 vO O 00 o 00 -3- -a-o on 00 xn Xn -d* (V VT\ o OV rH c*-o o • Do rn o rH • 00 CM O O • on vo xn Cw 0 00 cv 0 Ov xn vo xn OV • • • • • • 00 CM 0 Ov cn rH CM « xn xn xn vo -5-CM 00 00 O rH -a-O 00 O on 00 00 • • • • • • 00 CM VO CM .3 -CM CM rH rH m ov vo on xn xn W 4 XA vO >» U 3 o U 0) E o o VO VA II 0) U 3 CO (0 <D U A 0) W) cd 0) > < /
T-13?6 27
S U M M A R Y
The pure component isotherms of freon-21 and ethyl chloride were measured at 323°K and in the pressure range of 0 to 695 iron of mercury. Binary adsorption isotherms of mixtures at various compositions were measured at 323°K and at 560 mm of mercury. The adsorbent used was Linde Molecular Sieve 13x pellets. The experimental values are in poor agreement with the mixture values predicted by Kidnay and Myers method.
It is hoped that the results of this study may help to the basic understanding of the adsorption process and thereby aid in the development of quantitative design for industrial use.
T-1376 28 N O T A T I O N a A b £ K n N P R T atm mano v V
Langmuir constant, mg. moles/atm. gm constant, mg. moles/gm atm.
Langmuir constant, l/atm
work of compression, adsorption potential? calories/gm mole Freundlich constant, mg. moles Preundlich exponential constant mg. moles adsorbed/gm adsorbent pressure, atm
gas constant temperature, °K
Tbath water bath
atmospheric temperature
temperature surrounding manometer volume adsorbate, cc.
Volume cc.
T-13?6
Y mole fraction in gas phase Greek letters
p Schay*s interaction constant, dimensionless ar density, mg. moles/cc. 0? function of Subscripts a adsorbate state %g gaseous state i ith layer j jth layer
T-1376
R E F E R E N C E S
1. Myers, A.L., and Prausnitz, J.M., Thermodynamics of mixed gas adsorption* Am0 Inst. Chem. Eng. Jour., v. 11, no.l, p. 121-127,(1965).
2. Hoory, S.E., ad Prausnitz, J.M., Monolayer adsorption of gas mixtures on homogeneous and hetrogeneous
solids* Chem. Eng. Prog. Symp., v.63, no. 7^* p. 3-9, (1967).
3. Kidnay, A.J., and Myers, A.L., A simplified method for the prediction of multicomponent adsorption equilibria from single gas isotherms* Am. Inst. Chem. Eng. Jour., v. 12, no.5* p. 981-986, (1966). Henson, T.L., and Kabel, R.L., On the ideality of adsorbed solutions* Chem. Eng. Prog. Symp., v.63, no. 7^, p. 36-M, (1967).
5. Ross, S. and Oliver, J.P., On physical adsorption* New York, Interscience Publishers, J. Wiley and Sons, Ch. 1, (196*0.
6. Baly, E.C.C., On physical adsorption* Proc. Roy. Soc., v. A160, p. *1-65, (1937).
7. Langmuir, I., On physical adsorption* Phys. Rev., v.8, p. 1^9, (1916).
8. , On physical adsorption* Journ. Am.
Chem. Soc., v. *1-0, p. 1361,(1918).
9. Fowler, R.H., and Guggenheim, E.A., Statistical thermodynamics* New York, Macmillan, (1939).
10. Schay, G., Jour. Chem Phys., (Hungary), v. 53* P»691* (1956).
11. Brunauer, S., Efmmet, P.H., and Teller* E., Physical adsorption, Jour. Am. Chem. Soc., v. 78, p.5963*
(1956)
T-1376 31 12
.
13. 14. 15. 16.
17. 18. 19. 20.
21.
22.
23. 24. 25. 26.
27. 28.Markham, E.D., and Benton, A.F., Physical adsorption: Jour. Am. Chem. Soc., v. 53, p. 497, (1931)•
Schay, G., Fejes, P., and Szethmary, J., On physical adsorption: Acta. Chim. Acad. Sci., Hungary, v. 12, P. 299, (1957).
Polanyi, M., Ber. Deut. Physik, Ges., On physical adsorption, v. 16, p. 1012, (1914).
. Ver. Deut. Physik, Ges., On physical adsorption 1 v. 18, p. 55, (1916).
• . Z. Electrochemie, On physical adsorption: v. 2 6, p.370,(1920).
. Z. Physik, Chem., On physical adsorption: v. A 138, p. 459, (1928).
Lewis, W.K., Gilliland, E.R., Chertow, B., and Codogan, W.P., Adsorption equilibria, hydrocarbon gas mixtures:
Ind. and Eng. Chem., v. 42, no. 7» p. 1319 - 1326 (1950). Dubinin, M.M., Chem. Rev., v. 60, p.235, (I960)•
Lederman, P.B., and Williams, B., The adsorption of nitrogen-methane on molecular sieves: Am. Inst. Chem. Eng. Jour., v. 10, no. 1, p.30 - 34,(1964).
Mattick, L.R., and Szymanski, H.A., Lectures on gas
chromotography: New York, Plenum Press, p. 33-68, (1962). Young, D.M. and Crowell, A.D., Physical adsorption
og gases: London, Butterworths, Ch. 11,(1962).
Kidnay, A.J., and Hiza, M.J., The low temperature removal of small quantities of Nitrogen or Methane from Hydrogen gas by physical adsorption on a synthetic zeolite:
Am. Inst. Chem. Eng. Jour., v. 12, no.l, p. 58-63, (1966)• Hoory, S.E., Ph. D. desertation: University' of
California, Berkely, Ch. 11-111,(1966).
Szepesy, L., and Illes, V., Adsorption of gases and
gas mixtures, I: Acta. Chim. Hung., v. 35*P* 37 - 51» (1963). ______________ , Adsorption of gases and gas mixtures
III: Acta. Chim. Hung, v. 35, p. 245-253* (1963).
Kidnay, A.J., Ph.D. desertation, Colorado School of Mines Golden, Ch. 2, (1968).
Brunauer,S., The adsorption of gases and vapors: Princeton, Princeton University Press, (1943).
T-1376 32
29# Barrer, R.M., Colston papers* London, Butterworths, v. IQ p. 6 - 3^# (1958)
30. de Boer, J.H., The Dynamical character of adsorption London, The Clarendon Press, Oxford, ch. 7, (1953)*
31 • The Dynamical character ofadsorption*
The Clarendon Press, Oxford, ch. 8, (1953)•
32. Patel, G., M.Sc. Thesis, Colorado School of Mines Golden,(1971)•
T-1376
A P P E N D I X
/
T-1376
A P P E N D I X I
Table 1
Total dead volume measurements
atm mm of Hg T atm deg C ^initial ml v . final ml p system mm of Hg T manometer deg C 622.0 24.8 91.60 79.30 162.5 23.3 622.0 24.8 79.60 69.50 283.0 23.4 622.0 24.8 69.50 62.50 383.5 23.4 622.0 25.0 62.50 53.00 501.0 23.7 622.0 25.0 53.00 47.90 57^.0 23.9 622.0 25.0 47.90 41.50 658.0 23.9 / / 33 X
T-1376 3^
Table 2
Dead volume measurements of the system that remains at ambient conditions p atm mm of Hg ^atm deg C ^initial ml Vfinalml P T system manometer mm of Hg deg C 615.2 23.4 83.90 83.20 83.0 22.0 615.2 2J.b 83.20 76.00 178.0 22.0 615.2 2J.k 76.00 67.50 290.0 22.0 615.0 2 3 A 67.50 58.90 lf.05.0 22.0 615.2 23.^ 58.90 11.7.50 560.0 22.0 615.2 2 3 A ^7.50 lH.20 636.5 1 22.0
T-1376 35
Table 3
Pure ethyl chloride measurements
Patm mm of Hg Tatm deg C ^initial ml Vfinal ml P system mm of Hg T bath deg C Tmanometer deg C 613.1 24.8 91.50 28.80 23.0 50.0 25.8 612.9 24.5 28.60 7.90 66.0 50.0 24.70 614.9 24.1 91.80 78.90 159.0 50.0 22.5 615.4 24.8 79.0 60.90 251.0 50.0 23.3 616.1 25.0 61.50 51.40 ^35.0 50.0 26.7 619.6 24.8 50.90 43.60 490.0 50.0 22.9 620.8 24.5 43.50 35.30 570.0 50.0 22.1 620.8 24.3 35.30 21.30 695.0 50.0 22.1
T-1376 36
Table 4*
Pure Freon-21 measurements
p •atm mm of Hg ^atm deg C ^initial ml v vfinal ml P T system bath mm of Hg deg C Tmanometer deg C 610.4 25.0 99.10 22.00 4*0.0 50.0 22.9 610.8 25.0 21.80 9.00 100.5 50.0 22.7 611.0 25.0 98.60 81.00 220.0 50.0 22.5 616,9 24*.4* 80.90 69.90 330.0 50.0 22.4* 619.1 24* 6 69.60 59.60 4*07.0 50.0 CslCM • 0 622.6 24.0 60.00 47.50 493.0 50.0 21.6 623.2 24.0 4*7.4-0 4*0.90 556.0 50.0 22.3 623.4* 24.9 4*0.70 32.4*0 615.0 50.0 21.0 i
T-1376
A P P E N D I X II Table 1
Pure component calculations
Dead volume of whole system Dead volume of system at ambient condition P system mm of Hg Volume ml. P system mm of Hg Volume ml. 1 6 2 .5 4 ? .2 0 8 3 .0 4 5 .4 0 2 8 3 .0 4 7 .0 0 1 7 8 .0 4 6 .0 0 3 8 3 .5 4 7 .2 0 2 9 0 .0 4 6 .2 0 5 0 1 .0 4 7 .2 0 4 0 5 .0 4 6 .0 0 5 7 4 .0 4 7 .4 0 5 6 0 .0 4 6 .0 0 6 5 8 .0 4 7 .3 0 6 3 6 .5 4 6 .2 0 / / ' / 37
T-13?6 38
Table 2
Pure ethyl chloride Pure freon-21
p system mm of Hg. Vol. ad(STP)/gm ml mm of Hg Psystem I”x . ad(STP)/gm 23.0 45.00 40.0 54.25 66.0 57.90 62.30 100.5 60.00 159.0 220.0 64.60 251.O 63.40 330.0 68.00 333.0 66.00 407.0 70.76 433.0 6?. 80 493.0 76.05 490.0 70.50 556.0 77.51 570.0 72.44 615.0 80.03 695.0 75.73
T-13?6 39
Sample calculation for total dead volume of the systemt ^atm ~ ^22*0 mm of Hg at 2^.8°C read from barometer.
The above pressure reading is corrected to 0°C by
taking manometric corrections from the Hand book of Chemistry by Lange, 10th edition p0 1696-7•
For the above pressure reading at 23.2°C, the correction *is 2*5 mm of Hg.
Therefore Pa^.m at 0°C = 6l9«5 mm of Hg.
The system pressure is read from the manometer and is corrected for the temperature effect..
P system j. at T manometer . * 162 • 5 mm of Hg at 23.3°C^ 6 J J
u
i h-Since area of leg of manometer is same then the
differential height read at T°C should be corrected to 0°C as follows PHg at T°C x A x hat T°C = ^Hg at 0°C x A x hat 0°C Therefore 1 h at 0°C = hQ = Psystein = h at 0,oC x pHg at T°C / Hg at 0°C P X P * system T Po /
T-1376 40
where p ^ ** density of mercury at T C and P o 55 density of mercury at 0°C
From Lange's handbook of chemistry (p.1119) ,o. at 23.3 C * 13.538 gm/ml Hg and at 0°C PVgr = 13*596 gm/ml Therefore Psystem at 0°C = 13^596 x 1 6 2 mm ofHs « 161.5 mm of Hg.
Now the volume of Helium introduced into the system is equal to 91.60 - 79.30 * 12.30 ml. The dead volume of the system is therefore
P° Vd sr dead volume = ^intro x a^m
P°
system
* 12.30 ml x 619.5 mm of Hg
“ 161.5 mm ofHg
* 47.20 ml
The same procedure is followed in the case of the dead volume of the system at ambient condition.
Sample calculation for pure gas (freon-21)
Barometric pressure corrected to 0°C I
Patm = 610.4 mm of Hg at 25*0°C
Barometric correction is 2,5 mm of Hg Therefore P ^ m - 610.4 - 2.5
« 607.9 mm of Hg. System pressure correction
^system = 4°*2 mra of Tmano = 2 2*9°C ^Hg at Tmano “ ^T 13*539
T-1376
£ Hg a t ° ° c =Po = !3*596
P O = P° = P v P / p
system at 0 C system system T'ro . 40,. 2 x 13*539
13.596 * 4-0.0 mm of Hg
Volume of gas introduced at atmospheric condition
is corrected to 760.0 mm of Hg and 0°C (STP) using ideal gas equation.
Therefore ,
p
Volume introduced (STP) = -2^*^ x -a— -- x V. .
atm 760.0 intr0
Therefore,
Volume introduced (STP) = SZlftiS x 5°?. £0 x ??#10 298.15 x 760.0
= 56.50 ml
A part of adsoption system remains in air and part of the system remains in the constant temperature water bath.
dead volume of system * dead volume of system + dead volume
in the air of system in
water bath.
4-7.20 ml * 4-6.00 ml +1.20 ml
So for the system pressure of 4-0.0 mm of Hg 4-6.00 ml pure gas is at P° „ and sys mano and 1.20 ml pure sas is at~ Psys and Tbath*
Therefore,
Volume of gas (STP) in the system = 9 -g^q\ \^ *x * ?'6 oVo * ° = 2.20 ml
and volume of gas(STP) in the system
T-1376 kz
Therefore ,
Volume of freon-21 adsorbed (STP) * Volume of gas introduced (STP)
- Volume of gas present = 56.50 - (2.200 + 0.053*0
* 5^.25 ml
Therefore
Volume of freon-21 adsorbed (STP) _ ____________ 5^.25_ gm. of adsorbent “ 1.002 gm of adsorbent
* 5^.2^9 gm/ml.
T-1376
A P P E N D I X III
Binary Mixture Adsorption Data
Run 1 mano P .atm = 616.70 mm of Hg. T . = 24-.0uC, T 0 atm • Mixture I Gas Volume, ml Freon-21 29.4-0 + 6.75* * 36.15 Ethyl chloride 4-7*50 - 29*4-0 = 18.10 Total * 54-*2 5
Amount introduced in the system « 54*• 25 ml.
Mixture II
Patm = 6l6-?° ” of »S. Tatm = 24-3°C- Tmano = 23-*°C
Gas Volume, ml 1
Freon-21 4-8.90 - 11.20 « 37*70 Ethyl
chloride 11.20 + 6.75 = 17*95
Total s?/55.65
Amount introduced in the system = 55*65 ml
* 6.75 is volume of undaliberated part of burette.
4-3
22.o°c
* 66.6 3 3 - 4 100.0 * 67.7 32.3 100.0T-1376
Mixture III
Patm s ^16.4* mm Tatm. = 24*5°c . T mano = 23.9°C
Gas Volume, ml * Freon-21 29.^0 + 6.75 = 36.15 67.3 Ethyl Chloride 4*7.00 - 29.4*0 = 17.60 32.7 Total = 53.75 100.0 Amount introduced = 6.70 ml %
Patm = 6l6*4 mm of "s. Tatm = 24.5 °C. Tmano = 23.9°C
Amount introduced * 4*. 20 ml
Patm. - 6l5‘8 “ of Tatm = 2*-°°c.* Tmano = 22*l0° Amount introduced = 9.10 ml#
Patm " 6j5.3 ■« of Hg. Tatm = 24.7 °C. Tmano = 20.5°C
Amount introduced = 5*4*0 ml
Patm - 6l2** nim of Hg* Tatm = 2**°°C* * « , = 20**°C
Amount introduced * 3*80 ml
Patm - 6 U *1 “ °f Hg* Tatm " 2^ 10°C* T»ano = 21*°°C
/
Amount introduced = 11#70 ml
Patm = 610*1 m™ °f Hg* Tatm = 23.8°C, Tmano = 20. Chromatographic Analysist
Helium flow at 10 psig ^atm = 24*.3°C
T-13?6
Pa^m = 610.2 mm of Hg
Psys s ^37*° mm of Hg
Freon-21 peak height = 25.5/32.0" Ethyl chloride peak height « 7/32"
T-1376 46 Run 2 Patm * 6 2 3 . 6 0 mm of Hg, Tatm = 24.0°C, - 21,4 Mixture I Gas Volume,ml # Freon-21 48.10 - 30.20 = 17.90 32.60 Ethyl chloride 30.20 + 6.75 = 36.95 67.40 Total = 54.85 100.00 %
Amount introduced in the system = 5^.85 nil Mixture II
Patm = 6 2 3 . 7 0 mm of Hg, Tatm = 23.9°C. Tmano = 21.0°C
Gas Volume,ml #
Freon-21 11.60 + 6.75 * 18.35 32.90
Ethyl
chloride *1-9.10 - 11.60= 37.50 67.10
Total « 55.85 100.00
Amount introduced in the system = 55.85 ml Mixture III
Patm “ 623-6 ■» °f Hg. Tatm = 23.9°C. Tmano = 22.0°C.
Gas Volume, ml # Freon-21 47.50 - 29.60 = 17.90 1 33.00 Ethyl chloride 29.60 + 6.75 = 36.35 67.00 Total = 54.25 100.00 Amount introduced = 5.80ml
Patm = 6>23.6 mm of Hg. Tatm = 23.9°C. Tmano = 22.2°C
T-1376
Amount introduced = 1.80 ml
^atm 622.9 mm of Hg, = 23.7 °C* manoT Amount introduced * 2.60 ml
^atm 622.5 mm of Hg, Tatm = 23.8°C, Tmano Amount introduced = 3*0 ml
P s
atm 622.5 mm of Hg, Tatm = 23.1°C• Tmano Amount introduced = 8.50 ml
^atm 622.0 mm of Hg, = 23.2°C• Tmano .Amount introduced = 6.?0 ml
Patm 620 mm of Hg, T&tm = 23 .0°C, Tmano Amount introduced = 8.?0 ml
p =
atm 618.5 mm of Hg, T&tm = 2 3.^°C, 'r mano = Amount introduced = 3*20 ml
^atm 618.5 mm of Hg, T&tm * 23.6°C, Tmano Chromotosraphic Analysis:
Helium flow at 10 psig T =
atm 2^.0°C
Attenuation = 2.0 T mano* 2^.3°C
^atm = 6l6.0 mm of Hg T bath= 50.0°C
Psys = 650.0 mm of Hg
Freon-21 peak height - 19/32"
Ethyl chloride peak height = 28/32"
/ / 22.2°C 23.1°C = 21.1°C = 20.6°C = 20.8°C 9.6°C = 20.1°C
T-13?6 R un 3 Mixture I Patm " 611^° lnm of HS* Tatm = 23*4°C -Gas Volume v ml Freon-21 15*30 + 6.75 = 22.05 Ethyl chloride 48.40 - 15*30 * 33*10 Total * 55*15
Amount introduced in the system = 55*15 rol Mixture II Patm = 6ll*3° mm of HS* Tatm = 23*3°C Gas Volume, ml Freon-21 50.80 - 26.70 * 24.10 Ethyl chloride 26.70 + 6.75 =33*45 Total * 57*55
Amount introduced in the system = 55*80 ml Mixture III Patm = 6l1-10 ”lm of **’ Tatm = 23*6°C ’ Gas Volume,ml Freon-21 14.00 + 6.75 * 20.75 Ethyl chloride 49.60 - 14.00 = 35.60 Total 56.35 Amount added = 7.50 ml 7 p=+m -611.1 mm of Hg, atm Tatm = 23.8°C, Amount added = 6*30 ml T Qr^ = 23.5 C mano 40.0 60.0 100.0 T mano = 23*3 C * 41.85 58.15 100.00
Patm = 6l2*2 min of Hg atm = 23-9°C,
T mano * 23.6 C J 36.85 63*15 100.00 Tmarm * 23.70 mano T = 2 3 . 2 C mano J
T-1376 49
Amount added = 8.50 ml
P s
atm 614.7 mm of Hg, Tatm = 2*-l0c' Tmano Amount added « 8.70 ml
Patm 617.8 mm of Hg, Tatm - 2^ ° ° C* Tmano Amount added * 9.00 ml
P =
atm 619.4 mm of Hg, Tatm - 23*V°C» Tmano Amount added = 1.40 ml
P =
atm 621.9 mm of Hg, Tatm “ 23»°°c « Tmano Chromotographic Analysis:
Helium flow at 10.0 psig ^atm = ^3.5°C
Attenuation = 2.0 T mano 22.8°C
Patm = 623«° of Tbath= 50*5°C
Psys = 639.0 mm of Hg Freon-21 peak height = 21/32M
Ethyl chloride peak height = 22/32"
/ / 22A°C 21,8°C 21.1°C 21.0°C
T-1376 50 Run 4 Mixture I Tatm = 2k'k C ' ^atm s ^l^.O mm **g» Gas Volume,ml Freon-21 12.20 + 6.75 = 18.95 Ethyl chloride 69.80 - 12.20 = 57.60 Total = 76.55
.Amount introduced in the system = 76.55 ml Mixture II Patm = 6l3‘80 ■» °f HS- Tatm = 2**°°c Gas Volume, ml Freon-21 56.90 - 40.20 = 16.?0 Ethyl chloride 40.20 + 6.75 =46.95 Total = 63.65
Amount introduced in the system = 41.90 ml Mixture III Patm = 6l3*8 ®» of Hg* Tatm * ^ C-Gas Volume, ml Freon-21 9.20 + 6.75 ® 15.95 Ethyl chloride 59.90 - 9.20 = 50.70 Total * 66.65 Amount introduced = 6.30 ml / Patm = 6l5*l mB of Hg* T=+™ = 24.0°C,atm Amount introduced « 3*80 ml > atm P„+„ =615.8 mm of Hg, T&tm = 24.4°C, T mano = 22.?C ( 2^.70 75.30 100.00 T mano * 22.0 C 26.20 73.80 100.00 T _ = 23.0 Cmano 23.90 76.10 100.00 T mano * 24.2°C T „ » 23.6 C mano
T-1376 51
Amount introduced = ?.00 ml Patm = 6l6*^ mm of "S' Tatm Amount introduced = 5»i0 ml Patm = 6l6*^ ,nm of "S' Tatm = Amount introduced = 8*30 ml
Patm = 6l7'7 mm of Tatm
Chromotographic Analysist Helium flow at 10 psig •Attenuation =2.0
Patm 55 6*8.30 mm of Hg Psys ~ ^59*0 mm of Hg
Freon-21 peak height = 13.5/32” Ethyl chloride peak height = 29/32”
/
/
/ = 24.3 C, ’ T „mano 2^.5°C, T ^ = 22, mano = 24,1 C , Tmano T = atm 2^.5°C T ^ = 24-.2°Cmano ^*bath“ 50.0°C 22.9°C k°C 20.1°CT-1376 52 Run 5 Mixture I atm Gas - 615.90 mm of Hg, Tatm = Zk.Z°C, Tmano = 22.6 C Volume, ml Freon-21 47.^0 - 36.80 = 10.60 Ethyl chloride 36.80+6.75 = ^3.55 Total * 54.15
.Amount introduced in the system = 5^.15 nil Mixture II Patm = 616,0 mm of Hg* Tatm = 2^‘3°C. Gas Volume, ml Freon-21 4.85 + 6.75 = 11.60 Ethyl chloride 51*10 - 4.85 * 46.25 Total * 57.85
Amount introduced in the system * 45.30 ml. Mixture III Patm = 616,0 mm of Hg* Tatm “ 24,5°C* ' Gas Volume, ml Freon-21 8.60 + 6.75 = 15*35 Ethyl chloride 70.00 - 8.60 « 61.40 Total = 76.75 Amount added = 17.30 ml Patm = 616,0 mm of Hg* Tatm * 24*5°C. Amount added = 1.90 ml Patm = 615,3 mm of Hg' Tatm " 2k-3°c 19.50 80.50 100.00 T mano = 22.8 C 20.0 80.0 100.0 mano = 23.2 C 20.00 / 80.00 100.00 mano « 23.2 C Tmar4ft * 23.1C mano
T-1376 53
Amount added = 4-, 4-0 ml
Patm 615.5 mm of Hg, Tatm = 2^.1°C, Tmano = 23.8°C Amount added * 3.4-0 ml
P =
atm 617.0 mm of Hg, Tatm ts 2k.0°C, Tmano s 23.8°C Amount added = 6.60 ml
P s
atm 617.9 mm of Hg, Tatm s 23.0°C, Tmano = 23.5°C Amount added = 2.4-0 ml
Patm 616.9 mm of Hg, ^atm = 2it-.0°C, Tmano s 24.3°C Amount added = 11.80 ml
P =
atm 6l6.5 mm of Hg, Tatm s 23.7°C Tmano s 24.4°C Amount added * 9*00 ml
P =
atm 616.7 mm of Hg, Tatm s 2^.0°C, Tmano s 2k,k°C Chromotographic Analysisi
Helium flow at 10 psig ^atm “ 23.8°C
Attenuation =2.0 T mano= 2k.5°C
Patm = &l6*6 mm of Hg Tbath= 50.1°C
Psys * ^39.0 mm of Hg
Freon-21 peak height = 5/32
Ethyl chloride peak height = 11/32w
/
T-1376 54
Run 6 Mixture I
Patm = 615,0 mm of Hg* Tatm = mano
Gas Freon-21 24.90 + 6.75 Ethyl chloride 56.60 - 24.90 Volume, ml - 31.65 « 31.70 * 63.35 Total
Amount introduced in the system = 63.35 ml Mixture II « 24.4 C * 50.0 50.0 100,0 Patm = 6l^*l mm of Hg* Gas Freon-21 47.30 - 20.30 Ethyl chloride 20.30 + 6.75 Total Tatm - 24,8°c Volume,ml = 27.00 = 27.05 = 5^.05 mano = 24.2 C * 50.0 50.0 100.0
Amount introduced in the system = 47.25 ml Mixture III Patm = 615,2 mm of «g Tatm = 2Zf,8°C Gas Volume, ml Freon-21 24.50 + 6,75 s 31.25 Ethyl chloride 55-70 - 24.50 * 31.20 Total * 62.45 Amount added = 11.10 ml
Patm = 615,2 ram of HS* Tatm = 2^,8°c Amount added = 3*70 ml Patm = 615,8 mm of Hg* Tatm = 24,5°c T mano = 24.8°C 50.0 50.0 100.0 Tmanrt = 24.1 C mano T „ = 2 3.IC mano
T-13?6 Amount added = 8.00 ml ^atm 616.4 mm Hg, ^atm Amount added = 4.30 ml *atm 618.6 mm of Hg, Tatm Amount added = 4.10 ml P = atm 615.9 mm of Hg, Tatm Amount added = 2.50 ml ^atm “ 616.20 mm of Hg,T ^ Amount added = 3.40 ml P s atm 618.5 mm of Hg, Tatm Amount added = 1.50 ml P atm = 621.4 mm of Hg, Tatm Amount added = 1.50 ml ^atm 621.8 mm of Hg, Tatm Chromotograohic Analysis> Helium flow at 10 psig Attenuation =2.0
*atm = ^21*0 mm **g
PgyS = 6l8.0 mm of Hg
Freon-21 peak height =11/32" Ethyl chloride peak height =
24.2°C, T „ mano = 22.^°C o 2b.6 C , T mano = 22,3 C^ 24j5°C, T mano = 23.8°C 24.8°C, T - = 23.2°C mano 2^.8°C, T „ = mano 2b.0°C 23.5°C, mano = 24.3°C 23.6°C, = 2*.3°C Tatm " 2^ ° ° C Tmano“ 2^ ° ° C Tbath = 50.0°C 6.5/32"
T-1376
A P P E N D I X I V
Binary Mixture Sample Calculation for Run No.21
The following steps are involved in the calculation 1) Calculate the exact composition of feed and the
volume of each gas introduced at STP
2) Calculate the equilibrium composition of the gaseous mixture in the system.
3) Calculate the volume of each gas adsorbed at STP. Step 1
In the calculation of the feed composition, the volume of the uncaliberated part of gas-burette is needed and was determined in the previous investigation (3 2) as
Volume of uncaliberated part = 6.75 ml For mixture I
Freon-21 Volume » 17»90 ml Ethyl chloride volume = 36.95 ml Total gas volume - 5^*85 ml
T-1376 57
Therefore
Percent freon-21 in the mixture = 17*90 x 100 55.85 = 32*6 £ Similarly ethyl chloride = 67.5 % Similarly for mixture II
Percent freon-21 « 32,90 % and Percent ethyl chloride = 67.10 % and for mixture III
Percent freon-21 = 33*0 % and fo ethyl chloride = 67.0 % Therefore
average percent of ethyl ✓ „ .,n . ~ , chloride in the system‘ = SZ*»0 .t£Z* ^
-= 67.17% and average percent of freon-21
in the system = 32*Qy%
for mixture I
amount introduced = 55.85 ml
Patm = 623*60 mm of HS - Tatm = Zk'°°C
Barometer reading correction to 0°C = 2,40 mm of Hg Therefore P°tm = 623.60 - 2.50 - 621.20 mm of Hg. so volume introduced at STP * 55.85 x 271,15 x 621.20 297.15 x 760.O = 51.20 ml. for mixture II amount introduced = 55*85 ml Patm = 623-7 ■» °f Tatm = 23*9°C 67.00
T-1376
Barometer reading correction = 2.40 mm of Hg. Therefore P° = 623.70 - 2.<4-0 = 621.50 mm of Hg So volume introduced at STP ■ 35.85 x 273.15 x 621.30 297.05 x 760.0 = 41.90 ml for mixture III
(i) amount introduced = 5*8 ml
Patm = 623.6 mm of Hg. Tatm= 23.9°C
Barometer reading correction = 2.50 mm of Hg Therefore = 623.60 - 2.50 *= 621.20 mm of Hg So volume introduced at STP _ 5.8 x 273.15 x 621.20 297.05 x 760.0 * 5.36 ml
(ii) amount added = 1.80 ml
Patm " 622*9 lnm of Tatm “ 23*7°C
Barometer reading correction = 2.50 mm of Hg Therefore - 620.5 mm of Hg
So volume introduced at STP
* 1.80 x 273.15 x 620.50 296.85 x 760.0 * 1.35 ml
(iii) volume introduced « 2.60 ml
Patm = 622*5° mra of Hg, Tatm. = 23.8°C
Barometer reading correction = 2.52 mm of Hg Therefore =622.5 - 2.52 * 620.08 mm of Kg So volume introduced at STP
T-13?6 59
2.60 x 273.15 x 620.08 296.95
= 1.95 ml (iv) Volume introduced = J.O mis
Patm = 622-50 mm of Hg, Tatm = 23.1°C
Barometer reading correction = 2.25 mm of Hg Therefore P°tm « 622.50 - 2.25 * 620.25 mm of Hg. So volume introduced at STP - 3*0 x 273.15 x 620.25 296.25 x 760.0 = 2.26 ml. (v) Volume introduced = 8.50 ml Patm “ 622'° mm of HS‘ Tatm = 23-2°C
Barometer reading correction = 2.30 mm of Hg. Therefore P°tm = 622.0 - 2.30 = 6l9»70 mm of Hg. So volume introduced at STP . 8.50 X 273.15 x 619.70 296.35 x 760.0 e 6.38 ml (vi) Volume introduced = 6.70 ml
Patm = 620'6 ”>m of Hg* Tatm = 23*° °c
Barometer reading correction = 2.30 mm of Hg. Therefore P°tm = 620.60 - 2.30 « 618.30 mm of Hg. So volume introduced at STP * 6.70 x 273.15 x 618.30 296.15 x 760.0 « 5«25 ml
T-1376 60
(vii) Volume introduced = 8.70 ml
Patm = 618‘5° «» °f Hg. Tatn. = 23^ ° C
Barometer reading correction = 2.35 mm of Hg. Therefore P^tm 88 618.50 - 2.35 - 616.15 mm of Hg. So volume introduced at STP - 8,70 x 273.15 x 616.16 296.45 x 7^0.0 = 6.^9ml
(viii) Volume introduced = 3*20 ml
Patm = 618*5° ■» Hg. Tatm = 23.6°C
Barometer reading correction = 2.35 mm of Hg. Therefore = 618.50 - 2.35 = 616.15 mm of Hg. So volume introduced at STP - 3.20x273.15x616.15 296.75 x 760.0 * 2.39 ml
So Total volume introduced at STP s III.60 ml.
Therefore volume of freon-21 introduced (STP) * 111.60 x 0.3283
« 36.60 ml
and volume of ethyl chloride introduced(STP) = 75.OO ml.
Step 2
Calculation of equilibrium composition of gases
T-1376 61
was difficult to obtain caliberation curves for the pure gases due to leak in sample valve on the chromotograph, a peak
ratio was the means used to get the composition. This approxi mation is valid since there is not much difference in thermal
conductivity of both the gases.
Freon-21 peak height * 19/32 Ethyl chloride peak
height = 28/32
•Therefore
* of Freon-21 100
= kOfo and percent of Ethyl chloride = 60.0^ Step 3
The sample valve on chromotograph is included in the system andsince it is not leakproof, the sample loop was first filled with helium at atmospheric pressure, and so that much helium is mixed with the feed. The volume of that loop is 5.05 ml determined as followsi
1/8*' OD Cu-tubing, 37*6^ in long with volume = 2.03 ml l/k" OD Cu-tubing, 6.50 in long with volume = 3*02 ml Therefore
Total volume - 5*05 ml.
Also due to a mixing problem in* the system, /
part of the system will be at the feed composition. This volume is as followst
T-1376 62
Volume « 6*83 ml Burette's top valve to tee near circulation pump 3*50 in* Cu-tubing, with cm ID, Vol. = 1.12 ml. 1.75 in Cu-tubing, with 1.00 cm ID, Vol. - 3*^0 ml 12.00 in Cu-tubing, with 0.065 in ID, Vol = O.65 ml Therefore
Total volume at feed composition * 12.10 ml
Thus we have for the system
12.10 ml at feed composition, P„„« and T_„^^
r 9 sys mano
*38.95 ®1 at equilibrium composition, Psys and Tman0 and 1.20 ml at equilibrium composition, Pgys amd 1 ^ .
The effective system pressure will be the system pressure less the partial pressure of the helium which is mixed with the gases.
Therefore
effective) = - P__ro x vol % helium
sys sys sys
« 6*50 mm of Hg - 650.O mm of Hg x ^§715 = 650.0 - 80.9 * 5^9*10 mm of Hg. Pg (effective) * 569*10 mm of Hg x Tmano Hg at 0°C « 569*10 mm of Hg x 13C593§ = 566.0 mm of Hg.
The volume of gas mixture present at STP will be 12.10 x 666.0 x 273.16 760V0 x 297.15 = 8.30 ml at feed composition /18.95 x 566.0 x 273.15 760.0 x 297TT5 *5 26.70 ml at equilibrium composition
T-1376 63 and 1.20 x 566.0 x 273.15 ana ?60.0 x 323.15 s 0#75? ml at equilibrium composition Volume of mixture present ml (STP) * Freon-21 Vol. present Ethyl % chloride Vol. presei 8.300 32.83 2.725 67.17 5.575 26.?00 4-0.00 10.695 60.00 16.005 0.757 4-0.00 0.303 60.00 0.4-54 Total 13.723 22.034
Gas Volume into (STP) Volume present Volume adsorbed
ml (STP) ml pergram Freon-21 36.60 Ethyl chloride 75*00 Total 111.60 13.723 22.034 35.757 22.877 52.966 75.843
T-1376
A P P E N D I X V
Prediction of mixture isotherm
The procedure for calculating mixture adsorption from the pure component isotherms is as-follows*
1. Select the value of P°v(on pure gas isotherms),
© j r
560 mm of Hg*
2. Select a value nt lying between n ^ P ^ ) and n2<P°y), where subscript 1 refers to freon-21 and 2 refers to ethyl chloride
3* Prom the pure gas isotherms obtain Pgy(n^) and
W
V
4* Calculate x^ using pO _ pO Y j. pO Y sy ” s y l 1 sy2 2 x2 = 1 " X1 64T-1376 65
5. Calculate y, using yl " Psvl-Xl
Psy y2 B yx
6. Calculate volume (STP) adsorbed/gm of adsorbent using
nl s xi-nt
nz = (1 - x1).nt "t " nl + n2
and y2 = Gas-phase equilibrium composition for component 1 and 2
T-1376
APPENDIX VI.
ERROR ESTIMATION
Error in the results may be caused by errors made in various measurements during the experimental investigation. Following are the possible sources of error in measurements.
Burette» Volume of the caliberated part * 100.0 cc. Magnitude of smallest division * 0.2 cc. Possible error in reading the
the volume - ±Ol cc
2, Mercury Manometer* Scale is from 0 mm of Hg to 990 mm of Hg.
Magnitude of smallest division*! mm. of Hg.
Possible error in reading the pressure * ± 0.5 mm of Hg. 3* Peak Heights on the Chromotograph Chartt
Peak heights were measured by scale It32
Possible error in measuring the peak height** 1/6k in
T-1376 68
Gas Sampling Valve> Possible error could be caused by the difference in sample volume of different samples introduced to the chromotograph. But, as the sensitivity of the detector depends on the concentration of the gases in the sample mixture rather than the volume of the sample, it is less likely to be the source of error in the results.
Flow of the carrier gas in the chromotographt The constant flow of the helium gas is maintained in each run indirectly by
maintaining the constant 10 psig pressure of helium in the chromotograph•
Dead Volume Measurementi The accuracy of the data may be
dependent on the accuracy of the dead volume measurement of the system.