GRID-CONNECTED MICRO-GRID
OPERATIONAL STRATEGY
EVALUATION
Investigation of how microgrid load configurations, battery energy storage
system type and control can support system specification
MARTIN MANCUSO
School of Business, Society and Engineering Course: Degree Project in Sustainable Energy Systems
Supervisor: Jan Sandberg Examiner: Maher Azaza Co-supervisor: Pietro Campana
ABSTRACT
Operational performance of grid-connected microgrid with integrated solar photovoltaic (PV) electricity production and battery energy storage (BES) is investigated. These distributed energy resources (DERs) have the potential to reduce conventionally produced electrical power and contribute to reduction of greenhouse gas emissions. This investigation is based upon the DER’s techno-economic specifications and theoretical performance, consumer load data and electrical utility retail and distribution data. Available literature provides the basis for DER specification and performance. Actual consumer load profile data is available for residential and commercial consumer sector customers. The electrical utility data is obtained from Mälarenergi, AB. The aim is to investigate how to use simulations to specify a grid connected microgrid with DERs (PV production and a BES system) for two consumer sectors considering a range of objectives. An open-source, MATLAB-based simulation tool called Opti-CE has successfully been utilized. This package employs a genetic algorithm for multi-objective optimization. To support attainment of one of the multi-objectives, peak shaving of the consumer load, a battery operational strategy algorithm has been developed for the
simulation. With respect to balancing peak shaving and self-consumption one of the
simulations supports specification of a commercial sector application with 117 kWp PV power rating paired with a lithium ion battery with 41.1 kWh capacity. The simulation of this
system predicts the possibility to shave the customer load profile peaks for the month of April by 20%. The corresponding self-consumption ratio is 88%. Differences in the relationship between the load profiles and the system performance have been qualitatively noted. Furthermore, simulation results for lead-acid, lithium-ion and vanadium-redox flow battery systems are compared to reveal that lithium ion delivers the best balance between total annualized cost and peak shaving performance for both residential and commercial applications.
Keywords: Peak shaving, battery operational strategy, self-consumption, self-sufficiency, micro-grid, battery energy storage, electric load profile, electricity production and
PREFACE
This degree project has been carried out in fulfilment of requirements for the master’s program in sustainable energy systems (AMM02) at Mälardalen University, in Västerås Sweden. The idealistic objective of the work is to contribute to advancement of the application of sustainable energy technology.
I am grateful for the interaction I have had with all the faculty at MDH who have participated in support of this Masters’ program. Special thanks can be directed to specific faculty, in chronological order, for the magnitude and quality of impact they had on my experience in this program. Milica Rancic for her excellent instruction in numerical methods with
MATLAB (MMA307). Pietro Campana gave a warm welcome with positive, optimistic energy to set the tone for all the students during coordination of the introduction to sustainable energy systems (ERA204). His contribution continued as advisor for the group project in sustainable energy systems (ERA305) and then as Co-advisor for this degree project. In my view, Jan Sandberg is the cornerstone in the foundation of this program. His instruction is motivational, challenging, and interactive. Defense of work for his courses occurs in a collegial atmosphere which elevated my confidence. And his supervision both for courses and for this project show a high degree of commitment to both the technical content and to sharing it with the students.
Special thanks to my family who has been patient with my preoccupation with this program for nearly two years. “Gubben i kontoret,” will emerge soon to adopt a regular lifestyle.
Västerås, June 2018 Martin Mancuso
SUMMARY
Photovoltaic systems and battery energy storage are distributed energy resources (DERs) that can reduce customer loads, and thus consumption of conventionally produced electricity and greenhouse gas emissions. Combination of these DERs in a microgrid can be beneficial to both microgrid customer/owner (prosumer) and the grid operator. For instance, the combination of DERs with an energy storage system can contribute to the mitigation of the adverse effects of PV or wind power intermittency to the grid, including voltage fluctuation and frequency deviation. One beneficial power management concept for microgrid and energy storage systems is peak shaving. Battery energy storage systems with advanced management strategies can reduce peaks of the macro-grid and at the same time can contribute to increased PV power self-sufficiency and self-consumption, resulting in lower annualized system costs accrued by the prosumer.
The fundamental aim of this degree project is to investigate how to use simulations to specify a grid connected microgrid with DERs (PV production and a BES system) based upon load profiles for two consumer sectors: residential and commercial/industrial. The photovoltaic generation equipment combined with BES components encompass an array of system specifications. Previous research has separately considered opportunities and challenges of peak-shaving, BES and PV self-consumption. Can a BES system operational strategy, in combination with application of a multi-objective optimization algorithm, support selection of specifications for PV and battery energy storage equipment in a grid-connected micro-grid?
A simulation model of a grid-connected microgrid with PV power production combined with BES has been developed. Two load profiles and three types of batteries have been considered while performing dynamic simulations and optimization. The battery types are lead-acid (Pb-A), lithium-ion (Li-Ion) and vanadium-redox flow (VR-Flow). The open-source code OptiCE has been used for the PV and BES system simulation and optimization. OptiCE runs in Matlab® environment and it was originally developed for hybrid power system applications. This code utilizes Matlab® optimization toolbox for multi-objective optimization by
application of a genetic algorithm. The PV system production in the simulation relies on climatic data for Västerås, Sweden. Validated solar radiation and photovoltaic power output equations are applied by the model. The original Matlab® battery control function within OptiCE has been upgraded to perform peak shaving and manage BES charge/discharge for self-consumption.
The overall simulation carried out with the Opti-CE package of MATLAB scripts generates a wide array of results relating to system operation and performance. For a grid-connected microgrid with BES and PV power production, the power imported from the grid is that which is registered at a meter. Without PV and BES, the electric load profile and the power from the grid are equivalent. Implementation of PV and BES reduces imported power which is directly correlated to total annualized costs for the system: the first objective function of the optimization. The microgrid peak shaving performance is reflected in the results for the second objective function: the summation of the power that exceeds the peak shaving targets. The self-sufficiency of the system is the third objective function.
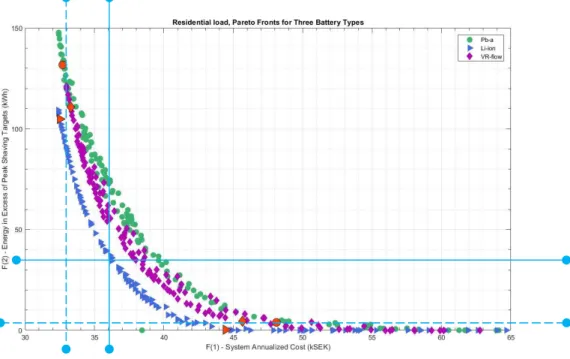
The Pareto frontiers for both load profiles (residential and commercial) reveal the correlation between annualized cost and peak shaving performance. One resulting commercial system targets 20% peak shaving with a self-sufficiency ratio of 0.18 and a self-consumption ratio of 0.88. Two different sets of solutions are highlighted on the Pareto frontiers. The first set of solutions (option 1) represents low performance peak shaving and low annualized cost, while the second set of solutions (option 2) represents effective peak shaving at high annualized cost. A vertical line intersecting the Pareto frontiers for a single chosen annualized cost indicates that a lithium-ion battery provides better peak shaving results than the other two battery options. On the other hand, an intersecting horizontal line indicates that, for a given peak shaving performance, the lithium-ion battery shows lower annualized cost.
A summary of the annualized costs considering different scenarios (customers of the commercial buildings not forming a microgrid, customers of the commercial building forming a microgrid, option 1 and option 2) is presented. The summary clearly shows that the implementation of the microgrid allows reducing the connection costs to the grid reducing the annualized costs. The implementation of the battery for peak shaving tends to increase the annualized costs since the savings are comparable or lower than the annualized costs of the investments and operation. Overviews of annual system performance are
provided with load vs. imported power overlay plots and system energy balance plots. These graphs represent the dynamic performance of the various systems: 3 battery types for two system solution (specification) options. A representative option 2 system consists of a 117 kWp PV system and 41.1 kWh Li-ion battery. A closer look at the simulation results showing the energy balance for this system during the month of April is presented. Similar results have been generated by the simulations based upon the residential electricity load profile. An integrated operational strategy for balancing peak shaving and PV self-sufficiency is the basis for the simulations carried out in this degree project. The battery types clearly affect the techno-economic optimization results. The comparison between lead-acid, lithium-ion and vanadium-redox flow battery systems shows that lithium-ion batteries have the best performances in terms of performing peak shaving and increasing PV-self-consumption at low annualized costs. While peak shaving allows reducing the power demand component of the electricity tariff, the battery investment leads to increased annualized costs based on the economic assumptions of this study.
CONTENTS
1 INTRODUCTION ...1
1.1 Background ... 2
1.1.1 Swedish market PV generation highlights ... 2
1.1.2 Battery energy storage technology ... 3
1.1.3 Photovoltaic generation combined with energy storage ... 5
1.1.4 Macrogrid performance considerations ... 6
1.2 Purpose/Aim ... 7 1.3 Research questions ... 8 1.4 Delimitations ... 8 2 METHOD ...9 2.1. Literature Study ... 9 2.2. Modelling... 9 2.2.1 Controlling factors ... 9 2.2.2 Problem data ...10 2.2.3 Simulations ...10
2.3 Result presentation and analysis ...10
3 THEORETICAL FRAMEWORK/ LITERATURE STUDY ... 11
3.1 Technical focus on peak shaving ...11
3.2. Technical focus on self-consumption ...13
3.3. Techno-economic analyses ...13
3.4 System monitoring hardware ...14
4 CURRENT STUDY ... 17
4.1 The simulation model structure ...17
4.2 Technical principles ...19
4.2.1 Solar radiation and PV system production ...19
4.2.2 Battery charging and discharging ...20
4.3 Microgrid configuration cost of operation ...25
5 RESULTS ... 30
5.1 Simulated operation of residential microgrid ...30
5.1.1 Lead-acid battery system ...35
5.1.2 Lithium ion battery system...38
5.1.3 Vanadium-redox flow battery system ...40
5.1.4 Residential microgrid system performance evaluations ...42
5.2 Simulated operation of commercial/industrial microgrid ...45
5.2.1 Lead-acid battery system ...48
5.2.2 Lithium ion battery system...51
5.2.3 Vanadium-redox flow battery system ...53
5.2.4 Commercial microgrid system performance evaluations ...55
6 DISCUSSION... 59
6.1 Methodology ...59
6.2 System performance and energy balance ...60
6.3 Research questions ...61
7 CONCLUSIONS ... 63
8 SUGGESTIONS FOR FURTHER WORK ... 64
REFERENCES ... 65
LIST OF FIGURES
Figure 1: Grid-connected microgrid topology that integrates PV production and BES. ... 5 Figure 2: File structure for microgrid model solution with MATLAB based Opti-CE
simulation model. ... 17 Figure 3: Logical conditions for determination of the applicable energy balance equations
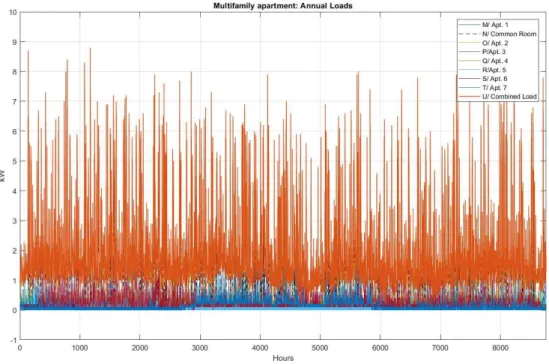
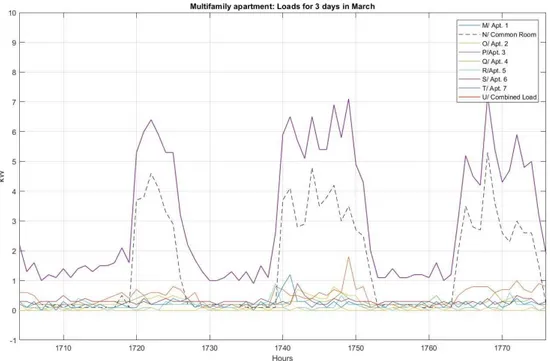
for five operational conditions. ... 22 Figure 4: Annual load profiles for simulation of Residential sector microgrid operation. ... 31 Figure 5: January residential sector load profile. Note daily peaks. ... 31 Figure 6: Residential load profile for three days in March. Note the impact of common
room load on the combined load. ... 32 Figure 7: Residential load profile for three days in August. Note the impact of common
room load on the combined load. ... 32 Figure 8: Pareto fronts for three battery types deployed in residential microgrid
simulation. Options (red data points) presented in detail in sections 0 through 5.1.3 ... 33 Figure 9: Total annualized costs of option one and option two optimal solutions chosen for
detailed investigation. ... 33 Figure 10: Annual electric load and power consumption from the grid for option 1. Installed PV power 2.3 kWp. Lead-acid battery capacity 1.0 kWh. SSR=13%. SCR=94%. 35 Figure 11: Annual power consumption from the grid, PV power production and battery
state of charge for option 1. Installed PV power 2.3 kWp. Battery capacity 1.0 kWh. ... 36 Figure 12: Annual electric load and power consumption from the grid for option 2. Installed
PV power 11.8 kWp. Lead-acid battery capacity 5.1 kWh. SSR=34%. SCR=47%. ... 37 Figure 13: Annual power consumption from the grid, PV power production and battery
state of charge for option 1. Installed PV power 11.8 kWp. Battery capacity 5.1 kWh. ... 37 Figure 14: Annual electric load and power consumption from the grid for option 1. Installed PV power 2.1 kWp. Lithium-ion battery capacity 1.0 kWh. SSR=12%. SCR=95%. ... 38 Figure 15: Annual power consumption from the grid, PV power production and battery
state of charge for option 1. Installed PV power 2.1 kWp. Battery capacity 1.0 kWh. ... 38 Figure 16: Annual electric load and power consumption from the grid for option 2. Installed PV power 9.9 kWp. Lithium-ion battery capacity 3.6 kWh. SSR=32%. SCR=53%. ... 39 Figure 17: Annual power consumption from the grid, PV power production and battery
state of charge for option 2. Installed PV power 9.9 kWp. Battery capacity 3.6 kWh. ... 39 Figure 18: Annual electric load and power consumption from the grid for option 1. Installed PV power 2.3 kWp. VR-Flow battery capacity 1.0 kWh. SSR=13%. SCR=94%. . 40
Figure 19: Annual power consumption from the grid, PV power production and battery state of charge for option 1. Installed PV power 2.3 kWp. Battery capacity 1.0 kWh. ... 40 Figure 20: Annual electric load and power consumption from the grid for option 2.
Installed PV power 10.7 kWp. VR-Flow battery capacity 2.4 kWh. SSR=33%. SCR=50%. ...41 Figure 21: Annual power consumption from the grid, PV power production and battery
state of charge for option 2. Installed PV power 10.7 kWp. Battery capacity 2.4 kWh. ...41 Figure 22: Option one system. PV power 2.3 kWp. Battery capacity 1.0 kWh. Energy
balance plot for month of March. Twelve peaks targeted for shaving. ... 42 Figure 23: Removal of electric load plot allows closer attention to detail. E.g.: six fully
shaved peaks, battery fully discharged for 6. 3 days (circled) for closer
examination. ... 43 Figure 24: Option one system. Installed PV power 2.3 kWp. Battery capacity 1.0 kWh.
Energy balance detail for three days of peak-shaving in March. ... 43 Figure 25: Option two system. PV power 10.7 kWp. Battery capacity 2.4 kWh. Energy
balance plot for month of August. Three days for closer examination. ... 44 Figure 26: Option two syst. Energy balance detail for 3 days of peak-shaving in August. 44 Figure 27: Annual load profiles for simulation of commercial sector microgrid operation. 45 Figure 28: January commercial sector load profile. Note the five daily peaks for business
days and weekly usage pattern indicated by the flat weekend consumption... 46 Figure 29: Pareto fronts for three battery types deployed in commercial microgrid
simulation. Options (red points) presented in detail in sections 5.2.1 through 5.2.3 ... 46 Figure 30: Total annualized costs of option one and option two optimal solutions chosen for
detailed investigation. ... 47 Figure 31: Annual electric load and power consumption from the grid for option 1. Installed
PV power 22.1 kWp. Lead-acid battery capacity 13.6 kWh. SSR=3.8%.
SCR=100%. ... 48 Figure 32: Annual power consumption from the grid, PV power production and battery
state of charge for option 1. Installed PV power 22.1 kWp. Battery capacity 13.6 kWh. ... 49 Figure 33: Annual electric load and power consumption from the grid for option 2.
Installed PV power 130 kWp. Lead-acid battery capacity 44.2 kWh. SSR=19%. SCR=87%. ... 50 Figure 34: Annual power consumption from the grid, PV power production and battery
state of charge for option 1. Installed PV power 130 kWp. Battery capacity 44.2 kWh. ... 50 Figure 35: Annual electric load and power consumption from the grid for option 1. Installed
PV power 22.0 kWp. Lithium-ion battery capacity 13.6 kWh. SSR=3.8%.
SCR=100%. ... 51 Figure 36: Annual power consumption from the grid, PV power production and battery
Figure 37: Annual electric load and power consumption from the grid for option 2.
Installed PV power 117 kWp. Lithium-ion battery capacity 41.0 kWh. SSR=18%. SCR=88%. ... 52 Figure 38: Annual power consumption from the grid, PV power production and battery
state of charge for option 2. Installed PV power 117 kWp. Battery capacity 41.0 kWh. ... 52 Figure 39: Annual electric load and power consumption from the grid for option 1. Installed
PV power 24.1 kWp. VR-Flow battery capacity 13.5 kWh. SSR=4.2%.
SCR=100%. ... 53 Figure 40: Annual power consumption from the grid, PV power production and battery
state of charge for option 1. Installed PV power 24.1 kWp. Battery capacity 13.5 kWh. ... 53 Figure 41: Annual electric load and power consumption from the grid for option 2. Installed
PV power 133 kWp. VR-Flow battery capacity 20.6 kWh. SSR=20%. SCR=86%. ... 54 Figure 42: Annual power consumption from the grid, PV power production and battery
state of charge for option 2. Installed PV power 133 kWp. Battery capacity 20.6 kWh. ... 54 Figure 43: Energy balance plot for month of January. Option one system. PV power 24.1
kWp. VR-Flow battery capacity 13.5 kWh. Fourteen peaks targeted for shaving at 135 kW (10% reduction). Seven successfully held below limit. ... 55 Figure 44: Energy balance plot for month of January. Option two system. PV power 133
kWp. VR-Flow battery capacity 20.6 kWh. Fourteen peaks targeted for shaving at 135 kW (10% reduction). Eleven successfully held below the limit. ... 55 Figure 45: Energy balance plot for month of April. Option two system. PV power 117 kWp.
Lithium-ion battery capacity 41.1 kWh. Twenty peaks targeted for shaving. Nineteen successfully held below limit (bottom half removes customer demand profile for clarity). ... 56 Figure 46: Energy balance plot for month of April. Option one system. PV power 24.1 kWp.
VR-Flow battery capacity 13.5 kWh. Twenty peaks targeted for shaving at 90 kW. All shaved, but none held below limit. ... 57 Figure 47: Energy balance plot for month of April. Option two system. PV power 133 kWp.
VR-Flow battery capacity 20.6 kWh. Twenty peaks targeted for shaving at 100 kW. Fifteen successfully held below limit. ... 57 Figure 48: Energy balance plot for month of October. Option one system. PV power 22.0
kWp. Lithium-ion battery capacity 13.6 kWh. Twenty peaks targeted for shaving at 112 kW (15% reduction). All shaved, only 5 held below limit (note battery SOC > 0 for four days within ring). ... 58
LIST OF TABLES
Table 1: Geoclimatic data for solar radiation calculation ...19
Table 2: PV array specifications and performance parameters ... 20
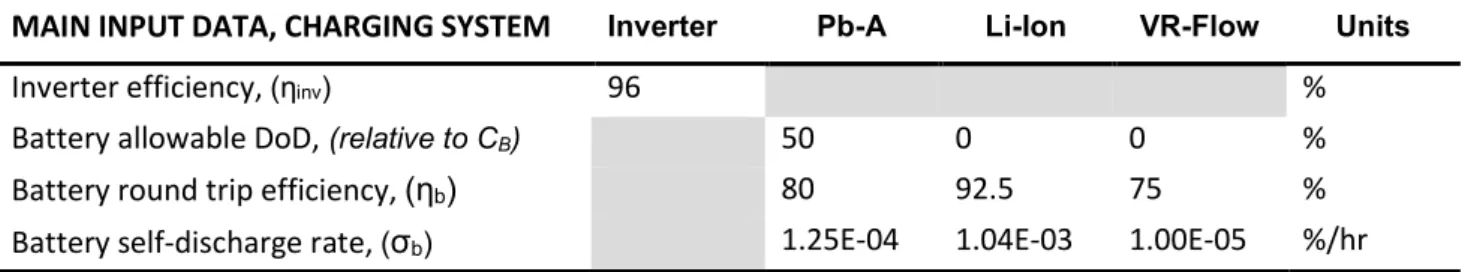
Table 3: Microgrid system charging equipment parameters (Fakhir & Mohamed, 2017). 23 Table 4: Genetic algorithm decision variable specifications for optimization of residential microgrid system. Note that the upper boundary is 99.9% of monthly peak load. ... 24
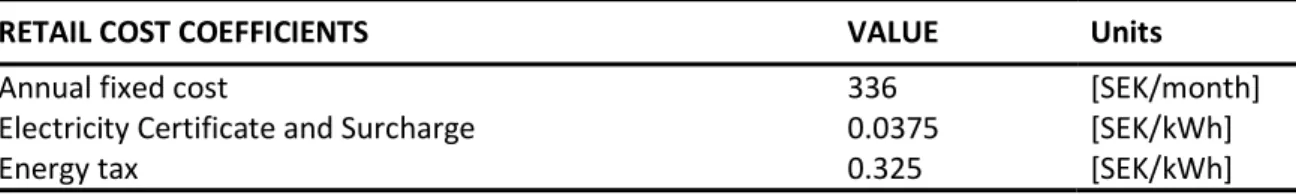
Table 5: Genetic algorithm decision variable specifications for optimization of commercial microgrid system. Note that the upper boundary is 99% of monthly peak load. 24 Table 6: Retail cost coefficients from Mälarenergi (Hammarberg, 2018) ... 26
Table 7: Distribution cost coefficients for residential customers (Mälarenergi, 2016b) ... 27
Table 8: Distribution cost coefficients for commercial customers (Mälarenergi, 2016a) ... 27
Table 9: Distribution cost coefficients for all customers (Mälarenergi, 2016a) ... 27
Table 10: Variation in battery costs and lifetimes with respect to battery type ... 29
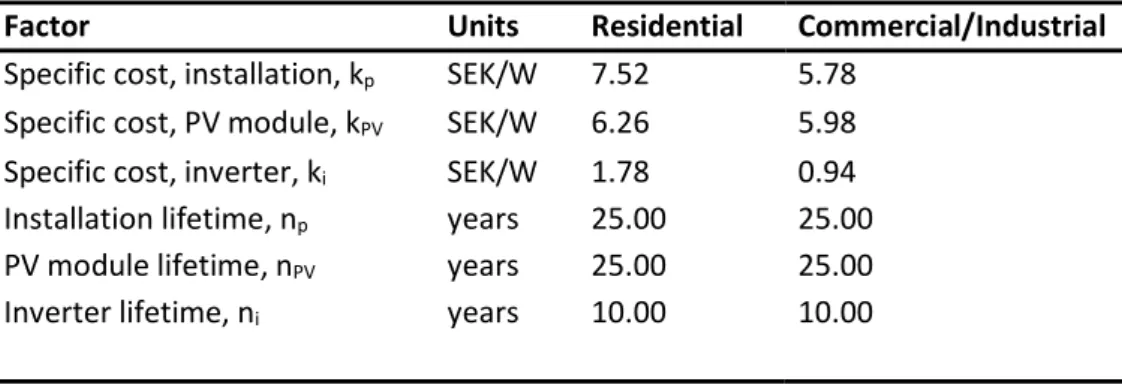
Table 11: Variation in PV, Inverter and installation costs with respect to customer sector (residential, commercial) ... 29
Table 12: Summary of residential system characteristics, options 1 & 2 for each battery type. ... 34
Table 13: Monthly peak shaving targets (kW) for optimal solution option 1 with lead-acid battery. ... 35
Table 14: Monthly peak shaving targets (kW) for optimal solution option 2 with lead-acid battery. ... 37
Table 15: Monthly peak shaving targets (kW) for optimal solution option 1, lithium-ion batteries. ... 38
Table 16: Monthly peak shaving targets (kW) for optimal solution option 2, lithium-ion batteries. ... 39
Table 17: Monthly peak shaving targets (kW) for solution opt. 1 - Vanadium-redox flow battery. ... 40
Table 18: Monthly peak shaving targets (kW) for solution opt. 2 - Vanadium-redox flow battery. ...41
Table 19: Monthly peak shaving reductions (%) for optimal solution option 1, VR-Flow battery. ... 43
Table 20: Monthly peak shaving reductions (%) for optimal solution option 2, VR-Flow battery. ... 44
Table 21: Summary of commercial system characteristics, options 1 & 2 for each battery type. ... 47
Table 22: Monthly peak shaving targets (kW) for optimal solution option 1 with lead-acid batteries. ... 48
Table 23: Monthly peak shaving targets (kW) for optimal solution option 2 with lead-acid batteries. ... 50
Table 24: Monthly peak shaving targets (kW) for optimal solution option 1 with lithium-ion battery. ... 51
Table 26: Monthly peak shaving targets (kW) for solution opt. 1 - Vanadium-redox flow battery. ... 53 Table 27: Monthly peak shaving targets (kW) for solution opt. 2 - Vanadium-redox flow
battery. ... 54
NOMENCLATURE
Symbol Description Unit
A Ampere A
ACi Annualized cost for system component i SEK
ACbat Annual cost for the battery SEK
ACPV Annual cost for the PV SEK
Area_pv Solar panel area M2
CAPi Capacity for component i Wh
CB Battery capacity specification --
ACbat Annual cost for the battery SEK
CDSO,y Distribution cost of electricity SEK
Clow Battery discharge limit --
CO&M,y Operation and maintenance cost at year y SEK
CRT,y Retail cost of imported electricity SEK
Ctot Total cost SEK
B Battery efficiency %
inv Inverter efficiency %
pv,STC Solar panel efficiency at standard test
conditions %
h Hour h
i Interest rate %
ICi Initial (start-up) cost for component, i SEK
Inv Investment cost SEK
ki Specific cost for component, i SEK/(rated
performance)
kWh Kilowatt-hour kWh
mu_Voc Value of the model V
MWh Megawatt hour MWh
ni Lifetime of component, i or project
NOCT Nominal operating cell temperature °C
PB,t Battery power at time t W
PG,peak Grid peak power W
PG,t Grid power at time t W
Symbol Description Unit
PGim,t Imported grid power at time t W
PL,t Load at time t W
PPV,t Power production at time t W
RRT,y Revenue for electricity fed to the grid SEK
Self-discharge rate %
SOCt State of Charge at time t %
T Temperature °C
TSTC Standard test conditions temperature °C
V Volt V
Vmp Maximum Power voltage V
W Watt W
Wh Watthour Wh
ABBREVIATIONS
Abbreviation Description
AC Alternating current
BES Battery energy storage
CHP Combined heat and power
CHREM Canadian Hybrid Residential End-Use Energy and
GHG emissions mode
DAQ Data Acquisition
DC Direct current
DER Distributed energy source
DoD Depth of discharge (for a battery)
DOE Department of energy (United States)
EMS Energy management system
ESS Energy storage system
HEM Home energy management
IEA International energy agency
IEEE Institute of Electrical and Electronics Engineers
IRR Internal rate of return
Li-Ion Lithium ion
NaS Sodium sulfur
NPV Net present value
Pb-Acid Lead acid
PV Photovoltaic
PVPSP Photovoltaic power systems programme
RBC Relative battery capacity
SCR Self-consumption ratio
SEK Swedish Kronor
SHE Selective harmonic elimination
SSR Self-sufficiency ratio
VAT Value added tax
1 INTRODUCTION
A 2012 journal article (Ton & Smith, 2012) published by U.S. Department of Energy (DOE) defines a microgrid as: ‘‘a group of interconnected loads and distributed energy resources (DERs) within clearly defined electrical boundaries that acts as a single controllable entity with respect to the grid.” A microgrid can connect and disconnect from the grid to enable it to operate in both grid-connected or island-mode. The authors note that promotion of microgrid installations is a significant element in the DOE’s larger strategic initiative for modernization of the macro-grid. The Swedish government Ministry of Environment and Energy has appointed members to a Swedish Smartgrid Forum. In support of their mission to promote dialog about the potential of smart grid technology and facilitate international business opportunities they have published a strategy document (Forum för smarta elnät, 2017) that also recognizes development of microgrid technology as an essential element with respect to integration of DERs in the national distribution network, or grid.
Renewable energy from solar photovoltaic (PV) and wind generation equipment are
examples of DERs. In contrast to traditional hydro-power, combined heat and power (CHP), and nuclear power generation, these resources are small-scale. This allows a broad
geographic distribution through the grid. It has become common that customers of electricity utilities/distribution system are owner-operators of PV power production equipment. Furthermore, production is dependent on weather conditions at the location where the equipment is installed. Weather events can induce abrupt fluctuations in power generation. The intermittent nature of production leads to classification of these resources as “non-dispatchable.” Production cannot be directly controlled to match demand and can fluctuate abruptly. Commonly cited (Datta, Senjyu, Yona, Funabashi, & Kim, 2010; Hill, Such, Chen, Gonzalez, & Grady, 2012) adverse effects of power fluctuation from grid-connected DERs include voltage fluctuation and frequency deviation. It is generally recognized that combination of DERs with an energy storage system (ESS) can make an effective contribution for mitigation of adverse effects upon the larger distribution grid. Optimal microgrid configurations will consider both technical and economic performance. Capital investment costs for components in the system are fundamental to the system economic model. Grid operators’ rate structure typically provides an economic incentive for customers to reduce the peaks in their load demand profile. The rate structure for exporting surplus PV power into the grid also stimulates interest in ESSs deployed for optimized self-consumption.
1.1 Background
This degree project will consider microgrid configurations which specify solar PV generation and battery energy storage (BES) systems. PV module costs have decreased steadily during the past decade. Battery technology improvements and cost reductions have occurred as well. Integration of microgrids with PV power generation and BES systems necessitates research and development of control strategies. Theoretical operation (simulation) and practical (actual control hardware) operation of such a microgrid system requires balanced consideration to multiple objectives such as minimized annualized costs, minimized peak loads demanded from the grid, and maximized self-sufficiency.
1.1.1 Swedish market PV generation highlights
The Swedish government collects and distributes statistics related to Swedish electricity generation and consumption. (Statistiska centralbyrån [Statistics Sweden], 2017). During 2016 total generation of 152 TWh is reported. The majority of this is provided by hydropower and nuclear power with 40.5 and 39.7 percent shares respectively. For 2016, consumption of 141 TWh is reported. The industrial, service and household sectors are the largest consumers with 49.5, 42.3 and 35.1 TWh consumption respectively. Domestic consumption during the ten-year period 2007-2016 ranges from to 134 TWh in 2014 to 147 TWh in 2010. No clear trend is evident.
The International Energy Agency (IEA) Photovoltaic Power Systems Programme (PVPSP) is a collaborative research and development initiative among IEA member nations. The PVPSP collects and publishes national survey reports from members. These cover PV market development, support policies, PV industry status, and research and development activities. In the 2016 survey report for Sweden, Johan Lindahl (2017) asserts an average PV yield of 950 kWh per each kilowatt of installed PV capacity (kWp). The national survey report has relied on capacity information collected from installers since 1992. For 2016, an installed capacity of grid-connected PV of 193 MWp is reported. For the average PV yield, annual generation with respect to 2016 installed capacity is 183 MWh. Thus, Swedish market PV electricity production as a percentage of total production is 0.12%.
Despite the minimal contribution PV production makes toward fulfillment of consumption demand, significant installed capacity increases are shown by annual data tabulated by Lindahl (2017). During the five-year period between 2011 and 2016 the installed capacity for grid-connected PV generation increased more than twenty-fold, from 8.77 MWp to 193 MWp. For the same period, the installation rate increased ten-fold from 7.13 to 77.6 MWp per year. Lindahl attributes this growth to a variety of factors. The fundamental impetus has been a direct capital subsidy program funded by the Swedish government since 2006. But factors such as declining system prices, public popularity, and attention from electric utilities are also noted as stimulants to the growth in installed capacity. The increasing number of
installation firms must certainly also contribute. Lindahl (2017) remarks that in 201o he was aware of fewer than fifty active companies, but that by the end of 2016, the number had exceeded two hundred.
Fundamental cost data can also be obtained from the 2016 survey report for Sweden.
Lindahl (2017) presents system cost data broken down for two representative installations. A grid-connected, roof-mounted, residential system with an installed output rated in the 4-6 kWp range is reported to have a total installed cost (including value added tax or “VAT”) of 19.45 SEK/ kWp. And a grid-connected, roof-mounted, commercial system with an installed output rated in the 40-60 kWp range is reported to have a total installed cost (including VAT) of 12.70 SEK/ kWp.
1.1.2 Battery energy storage technology
The primary components of a BES system are batteries, a charge controller, and a
bi-directional inverter connecting the storage system to the AC side. Potential battery types for such systems include lead-acid, lithium-ion, and vanadium-redox flow batteries.
Nominal battery capacity is the specified maximum energy the battery can store, commonly expressed in kWh. Battery power rating specifies the amount of power that can flow out of or into the battery (discharge power and charge power). Energy density (Wh/L) and specific energy (Wh/kg) relate energy to volume and mass respectively. Depth of discharge (DoD) relates the energy level of the battery at a given instant relative to the nominal battery capacity, expressed in percent. Battery cycle life is the number of charge/discharge cycles that a battery withstands before available capacity is reduced below 80% of the nominal (original) capacity (Tant, Geth, Six, Tant, & Driesen, 2013). Cycle life decreases for increasing DoDs.
AllCell Technologies, a North American supplier of lithium-ion (Li-Ion) battery packs
published a white paper (Albright, Edie, & Al-Hallaj, 2012) comparing lead-acid (Pb-Acid) to Li-Ion batteries in stationary applications. Li-Ion batteries are reported to have more than double the energy density and almost four times the specific energy of Pb-Acid batteries. The energy density of Li-Ion batteries allows equivalent nominal capacity installation in a smaller packaging volume. Furthermore, the higher values for specific energy of Li-Ion batteries gives equivalent performance with lower mass, allowing easier installation and maintenance. The AllCell paper (Albright et al., 2012) also provides comparisons for cycle life and specific cost (USD/kWh). A typical cycle life for a Pb-Acid battery pack is 1000 obtained at 50% DoD, while for metal oxide or iron phosphate variants of Li-Ion it is 1900 or 3000 cycles
respectively obtained at 80% DoD. Approximate specific cost for Pb-Acid is reported at 120 USD/kWh versus 600 for the metal oxide Li-Ion category. Note that the cost advantage for Pb-Acid diminishes due to both the reduced cycle life and the applicable DoD. Specification of Pb-Acid batteries with a discharge range equivalent to that of a Li-Ion battery pack necessitates a higher nominal capacity for equivalent discharge range. Furthermore, the lower cycle life will lead to more frequent replacement.
It may be asserted that cost reductions in Li-Ion batteries may soon make them
applications in battery electric vehicles. They refer to two research publications (from 2012) related to electric vehicle battery performance that Li-Ion battery costs in the range of 600 to 1500 USD/kWh. Considering variation in Li-Ion cell specifications, this is in line with the AllCell data. However, Nykvist and Nilsson’s data analysis reveals that, for the electric vehicle industry, specific cost for 2014 is approximately 410 USD/kWh. Furthermore, market leading vehicles, the Tesla Model S and Nissan Leaf report costs around 300 USD/kWh. While the approximate annual decline of 14% between 2007 and 2014 is
expected to decrease, the reported data estimates Li-Ion battery costs for 2020 to fall in the range of 200 to 500 USD/kWh.
The third type of battery for energy storage systems, vanadium-redox flow (VR-Flow)
batteries have a unique operating principle. A technology review paper (Alotto, Guarnieri, & Moro, 2014) presents the basic principle and geometry. Two vanadium-based electrolyte fluids are stored in separate tanks. These fluids are pumped through a cell or stack where a combination of reduction and oxidation reactions take place on opposite sides of a
membrane, which is impermeable to electrons. This forces the electrons extracted from the reactions to migrate through electrodes at opposite ends of the stack. Another review (Ulaganathan et al., 2016) of recent research and development of VR-Flow batteries notes that the stack configuration governs the power rating of the system and the volume of the electrolytes in the tanks determines the energy storage capacity. VR-Flow batteries require computer control.
One easily accessible financial media source (Conca, 2016) implies that VR-Flow battery technology is aimed primarily at utility-scale BES applications. Conca further asserts (2016) that VR-Flow battery cost per kWh is less than half of Li-Ion. Multiple research publications (Alotto et al., 2014; Ulaganathan et al., 2016; Viswanathan et al., 2014) concur with Conca: these VR-Flow battery application studies focus on medium to large scale grid stabilization applications where cited power and energy ratings range from 50 kW with 200 kWh to a system rated at 4 MW/6MWh. At least one research paper presents a residential application study. This German research study (Uhrig, Koenig, Suriyah, & Leibfried, 2016) covers systems in the range 2-5 kW/5-20 kWh.
The characteristic VR-Flow battery power/energy duality noted by Ulaganathan complicates specific cost determination. Therefore, the research studies cited in the preceding paragraph present an array of specific cost estimates with a range from 175 to 4600 USD/kWh. The duality is also reflected in the costs presented for residential application (Uhrig et al., 2016) where the costs are between 600 and 1500 USD/kWh. These research results clearly do not support the Forbes magazine (Conca, 2016), broad-stroke assertion for a 50% cost advantage for VR-Flow battery with respect to Li-Ion.
BES systems for residential applications in the Swedish market are in their infancy. Lindahl (2017) notes that a direct capital subsidy for storage of self-produced electricity is offered to private owners of residential property. The subsidy offers 60% of eligible system costs, not to exceed 50000 SEK. It is further reported that 1.70 MWh of battery capacity was installed in combination with PV systems during 2016. The total installed battery capacity is unknown, as this was the first-year during which installers were surveyed to provide this data.
1.1.3 Photovoltaic generation combined with energy storage
Any survey of available technical literature quickly reveals the global interest (Campana, Atif, Mohamed, Zhang, & Ying, 2017; Rahimi et al., 2013; Uddin et al., 2018) that has developed surrounding integration of renewable energy sources into the grid. These example papers have a shared aim: to study the application of energy storage systems to carry out peak shaving. Peak shaving is a process to reduce the peaks in a load profile which decreases the demand for power export from the grid. For a reference case of a microgrid with no DERs, simply adding an energy storage system (ESS) will allow implementation of an operational strategy to reduce the peaks in the load demand profile. PV generation added to the microgrid along with an ESS, provides an additional means to reduce the peaks. The circumstances surrounding the choice of deployment (PV or ESS) must be addressed in the system control strategy. The ESS provides an opportunity to control the negative peaks (the valleys) that occur when PV generation exceeds the load demand profile. In a microgrid without ESS, the surplus power is usually exported to the grid. An ESS allows the surplus power to remain on the customer side of the meter for use at a later moment in time.
The operation of a grid-connected microgrid PV generation system, with two-way power flow at the connection point, maintains a simple energy balance between the load and the energy sources as follows:
Equation 1: 𝑃, = 𝑃 , + 𝑃 ,
When the PV generation, PPV,t, is less than the load demand , PL,t, power flows from the centralized generation in the grid to balance the deficit. Algebraically, this imported power flow (consumed from the grid) is positive along with the PV power. When the PV generation is greater than the load demand, power flows into the grid to balance the surplus. This exported (negative) power flow is surplus from the PV generation. No active control of power flow is needed. This can be clarified with Figure 1 here, where PB,t is zero.
Over an explicit time-period, the PV system owner consumes a portion of the cumulative generated power. The self-sufficiency ratio relates the consumed PV power to the total consumed power expressed as follows:
Equation 2:
𝑆𝑆𝑅 =
= 1 −
∫ ( )∫ ( )
∙ 100%
Here the explicit time-period is one year (t1=0 and t2=8760 hours). G is power supplied by the grid and L is the electric load.
Adding a BES system to the microgrid gives the following system energy balance equation:
Equation 3: 𝑃 , = 𝑃 , + 𝑃 , + 𝑃 ,
Here PB,t is the battery rate of charge/discharge. When the PV generation power exceeds the load demand, 𝑃 , > 𝑃, , the surplus power can flow to the grid, to the BES, or to both. For
the microgrid thus configured, active (strategic) control can be applied for a variety of situations. Note two (of many possible) examples.
1. If 𝑃, < 𝑃 , , and the battery state of charge (SOC) is below its capacity, then the surplus PV
power shall be used to charge the battery.
2. If 𝑃, > 𝑃 , , and the battery discharge rate for the time-step will provide the needed power
compensation, then the battery shall be discharged.
These examples of conditional operational specifications reflect the application of programming logic necessary for simulation and/or control of microgrid systems that integrate combined DERs such as PV generation and BES systems.
Peak shaving is an operational strategy that involves evaluation of the load demand to control the power supply imported from the grid and hold it below a specific target value, PPS,
through operation of a BES system. The fundamental control conditions of a peak shaving strategy relate to the order and criteria for how the batteries are discharged and charged. PV generated power and power from the grid are the primary sources utilized to fulfil the load demand according to equation 1 above. However, the peak shaving target provides the basis for an inequality (relative to the demanded load and the PV power) to evaluate deployment of the BES system with respect to power exported from the grid, PG,t.:
If 𝑃, − 𝑃 , ≤ 𝑃 , then 𝑃, = 𝑃, − 𝑃 , .
But, if 𝑃, − 𝑃 , > 𝑃 , it requires that 𝑃 , > 𝑃 , then the BES system may compensate for
the demanded target overshoot.
Note that battery state of charge and performance characteristics necessitate additional conditional logic for complete control.
1.1.4 Macrogrid performance considerations
A microgrid can be optimally designed for performance with respect to the three electricity consumer sectors (household, service/commercial, and industrial). These microgrid
configurations can vary significantly. A fundamental aspect of microgrid operation is the cumulative load demand. The magnitude or scale of the load, and its patterns of application (daily and annually) varies from sector to sector. A second area of variation pertains to system design specifications, such as PV installed power (kWp), BES system capacity (kWh), battery type and peak shaving targets (kW). These specifications vary both within and across the electrical consumer sectors. A third area of interest for microgrid operation relates to optimization objectives. Three relevant objectives a microgrid owner may consider are total annual cost, total imported power from the grid, and self-sufficiency.
1.2 Purpose/Aim
A grid-connected microgrid with battery and BES system can be configured for different electricity consumer sectors with a multitude of possible combinations of system component specifications, to fulfil a range of customer optimization objectives. The fundamental
challenge for this degree project is to develop a simulation and optimization approach that accounts for these variations and leads to an optimal system design. The results of a multi-objective optimization algorithm shall support selection of specifications for PV and battery energy storage equipment from a discrete set of optimal solutions.
1.3 Research questions
Previous researches have separately considered opportunities and challenges of
peak-shaving, BES and PV self-consumption. However, few research studies have considered those simultaneously. Therefore, the research questions that this project aims to answer are:
1. Is it possible to integrate operational strategies that balance peak shaving and PV self-consumption?
2. How do typical residential, commercial, and industrial customer sector electrical load profiles affect the specifications for optimized microgrid configurations?
3. How do the battery types affect the optimization results for the microgrid configurations?
1.4 Delimitations
This project is limited to investigate the benefits of a grid-connected micro-grid configured with PV systems and battery storage. The optimization objectives under consideration are limited to total annual cost, total imported power from the grid, and self-sufficiency. This project has the following additional delimitations:
The microgrid load demand profiles consolidated for the three customer sectors come from customers in Västerås, year 2016.
Solar radiation and ambient temperature profiles for Västerås, 2016.
The system component performance is based on 16 parameters, which are the 12-peak shaving variables, tilt angle, azimuth angle, PV power rating and the battery capacity.
The microgrid project life cycle is 25 years.
2 METHOD
In this section, the methodology is divided into phases and described.
2.1. Literature Study
A literature study has been performed. Publications pertaining to relevant previous research have been collected from online databases like Google Scholar, Science Direct, IEEE and other electronic sources. The research papers have been chosen to ensure deep fundamental knowledge about previous work related to integration of PV power production and BES in grid-connected microgrids. Focus will be on battery technology, peak shaving, and PV self-consumption. This literature study is intended to ensure sufficient novelty for the topic specified for this degree project.
An extended aim of this literature review is to seek existing energy management systems for grid-connected microgrids that integrate PV production with BES with advanced operational strategies. The review shall allow accurate descriptions of the key components, and related functions, for an energy management system (EMS). On this basis, future study might investigate and establish a basic EMS concept.
2.2. Modelling
The grid-connected microgrid topology, shown in figure 1 above, is the basis for the
simulation modelling performed for this degree project. The model allows evaluation of the interaction between the customer load profile and the grid. The primary system elements considered in the model are the customer load, the macro-grid, a bi-directional inverter, the PV power system, the BES system and a control module. The primary challenge of the model development is to specify the algorithm that controls this hardware according to an
operational strategy for peak shaving and maximum self-consumption. This model shall provide the basis upon which the optimization evaluates the decision variables with respect to chosen objective functions.
2.2.1 Controlling factors
For any unique system specification, the interaction between the grid and the customer load is governed by the DC power available from the PV production and the BES system. PV production is controlled by the annual solar radiation and weather at the geographic position of the installation site. As the purpose of the battery is to store surplus PV power, it is
indirectly controlled by weather and geography. The flow of power through the bi-directional inverter is governed by the control strategy.
2.2.2 Problem data
Three categories of data have been collected and applied: time-based profiles relevant to system operation, equipment specification and operation data, and economic data.
The simulation is dependent upon several time-based profiles. These include the customer load profile, solar radiation and outdoor temperatures. The load profiles for three customer categories, residential, commercial/industrial, and industrial, have been provided by the technical advisor. The solar radiation and ambient temperature profiles for Västerås have been obtained from the Meteonorm global climate database.
Equipment specification and operation data have been collected for the three power components in the system: the PV array, the BES system, and the bi-directional DC-AC inverter. For the PV generation capacity, relevant equipment performance parameters will be collected. These include installed power kWp, (or peak power), module efficiency pv, and temperature coefficient of the output power, . The PV generation is also dependent upon a solar radiation calculation that requires some parameters related to the installation geometry (e.g.: tilt angle, 0) and several geographic parameters. For the BES system, relevant
equipment performance parameters also are needed for the range of battery types
investigated. These include capacity CB (kWh), power rating PB,max (kW), charge/discharge efficiency B, and state of charge (SOC) limits (%). For the inverter, a representative
efficiency inv, is required. The control strategy to implement peak shaving will depend on monthly peak power limits (peak shaving limits) Pps, (kW) which are specified based upon a percentage of the customer load profile monthly peaks. The decision variables for
optimization are a subset of the equipment specification and operation data. These include PV installed power, BES capacity and monthly peak-shaving limits.
The system economic performance is governed by electric utility costs, equipment costs and operation costs. Electric utility production and distribution costs will be obtained from Mälarenergi AB. Equipment investment, operation and maintenance costs will also be considered.
2.2.3 Simulations
A simulation software tool called Opti-CE has been employed for the system model specification and solution. Opti-CE is a MATLAB-based open-source code collection developed for hybrid power system applications. This software utilizes MATLAB’s genetic algorithm for multi-variable optimization. Unique for this work, the MATLAB battery control function has been adapted to perform peak shaving and manage BES
charge/discharge for self-consumption.
2.3 Result presentation and analysis
MATLAB version R2017b has been employed to plot the simulation results for interpretation for discussion and conclusions. Microsoft excel will be employed for data tabulation.
3 THEORETICAL FRAMEWORK/ LITERATURE STUDY
Evaluation of recent studies pertaining to microgrid configurations and operational strategies provides essential background for the current study. Furthermore, such evaluation lends perspective regarding the novelty of this work. Published studies have been obtained for which the effect of peak-shaving strategies is of primary interest. Other studies focus on maximizing self-consumption. Such studies tend to have a technical focus. However, especially relative to maximizing self-consumption, some economic aspects may also be included in the evaluation. Some studies emphasize a techno-economic focus from the outset. The preceding studies are theoretical in nature. The operational strategies are implemented in a simulation environment rather than with actual hardware. To establish a basis for extended consideration regarding practical application of microgrids which
integrate PV production and a BES system, some literature reviewing system monitoring hardware has been sought.
3.1 Technical focus on peak shaving
Results of a study assessing BES system sizing and performance for residential application has been published by (Leadbetter & Swan, 2012). The research is based upon household electricity demand profiles obtained from a national model called the Canadian Hybrid Residential End-Use Energy and GHG emissions model (CHREM). This model considers five regions of the country and encompasses approximately 17,000 statistically relevant
households. Peak shaving is carried out for the profiles in various regions with respect to a demand limit selected based upon a percentile method. The selected demand limits
correspond to a level below which 98.5% of the individual power consumption levels fall. The system operation is simulated with a model developed with MATLAB. Battery discharge is allowed only between 05:oo and 23:59. Charging is allowed only during the remaining hours. Selective parametric variations of energy storage capacity, inverter size (power capability), and grid demand limit are carried out. Plots for the relationship between energy storage capacity and peak limits support a manual selection of BES system capacity. The results are then presented as a range of peak reductions (40-50%) for a range of BES system capacities (5-8 kWh) valid for four of the 5 regions. The analysis results give a clear indication that the peak limit reduction with respect to increases in storage capacity has a point beyond which diminishing returns are observed. I.e.: a 40% peak reduction is achieved with 4 kWh of storage, but a 50% reduction requires double the storage. The peak reductions are asserted to benefit the grid operator. However, benefits to the household residents are only noted as interesting for future study.
Researchers Telaretti and Duschonet have conducted a techno-economic analysis of the application of BES systems to carry out peak shaving. The aim of the study is to specify a
system: specification of the operational strategy, the sizing, and the consequent effect on the power consumption. The operational strategy is time-based. The battery charges during the night and is discharged when both the load and electricity costs are high, during the day. The battery is dimensioned with respect to achieving a level grid consumption for “shoulder seasons” (spring and fall). Results of a series of daily simulations for a large office facility in an Italian climate zone are presented. Power consumption diagrams show that during summer and winter, the peak is flattened (shaved) significantly while the shoulder seasons show consumption to be completely level. Their second paper (Telaretti & Dusonchet, 2016b) focuses on the economic performance of the simulated system. Lithium-Ion (Li-Ion), advanced lead-acid, sodium-sulphur (NaS), and flow batteries are the four battery
technologies considered for the economic analysis. Net present value (NPV) and internal rate of return (IRR) are calculated for each. None of the technologies are currently cost-effective. However parametric studies are presented which indicate that Li-Ion technology would be profitable for cost reductions expected by 2020.
Another technical study (Rahimi et al., 2013) presents a method to utilize BES systems, distributed through the grid to perform peak load shaving. The objective is to demonstrate a “simple and effective” peak shaving algorithm. To accomplish this, they simulate a utility-owned, BES system that implements their peak shaving scheme. The simulation is based upon an Institute of Electrical and Electronics Engineers (IEEE) standard grid model, the IEEE 34 bus distribution test feeder. Three BES systems are distributed in the feeder, which also contains 34 customer loads. The effect of the BES system operation is evaluated with respect to the aggregate load at the interconnection point. The algorithm is based upon the relationship between the forecasted aggregate load and its average load. It relies on a discretization method that is based upon the areas above or below the average. The
discretization considers the area between the load profile and its average over specified time intervals. The charge/discharge is then shared among the BES devices. The feeder in the simulation has aggregate load for a one-week period ranging between 400 and 800 kW. Two simulation cases which vary the battery specifications (increase the capacity and power rating) demonstrate a reduction in peak with the control algorithm. The cases also show that increases in BES capacity and power increase the peak shaving effect.
Lead members (Wang, Zarghami, & Vaziri, 2016) of Rahimi’s research team (from the study just cited), investigate a system that integrates PV production and BES systems into the grid. A system operated with an energy management strategy that carries out peak shaving is simulated. The paper relies on advanced electrical engineering mathematics to represent the operation of the system with a “state space model.” This is presented as a differential
equation expressed in what is referred to as an “affine non-linear form” expressed with matrices. This state-space model has been simulated with MATLAB/Simulink/
SimPowerSystems. The model includes 10, 3 kW PV production systems paired with 35 kWh BES systems. The result shows that the grid sees reduced peaks (evening consumption during battery discharge) and valleys (daytime PV peak production fed into the grid).
3.2. Technical focus on self-consumption
PV household power production combined with BES is the subject of a study carried out by researchers (Moshövel et al., 2015) that aims to optimize the relationship between
self-consumption and grid relief with a simulation model. Fixed system specifications provide the basis of the MATLAB model for analysis. German feed-in limitations at 70% of system
nominal power rating results in production curtailment considered a waste of power. Common self-consumption strategies utilizing BES often results in full batteries when PV production is highest. Forecasting of peak PV production can be considered within the operational strategy to shift charging for correspondence to the peak. A novel forecasting method is proposed and investigated: persistence forecasting. Four operational strategies become the variable in the investigation. The first is the baseline, with no BES. Second is the default maximizing self-consumption. Then two forecasting methods, perfect forecast and persistence forecasting are applied. The results obtained with the persistence forecast yields a self-consumption rate only 4.4% lower than simply maximizing self-sufficiency. When energy losses due to a range of curtailment levels are considered it can be shown that the persistence forecast predicts losses at a 50% curtailment level that are equivalent to losses for a 70% curtailment level with maximum self-sufficiency.
The research team (Nyholm, Goop, Odenberger, & Johnsson, 2016) investigates the degree to which self-consumption and self-sufficiency attained for PV electricity production increases with integrated BES in the system. This work is based on household annual load demand profiles collected for over 2000 households by the electrical utility E.ON. The known geographic positions for the data collection supports modelling of household systems for annual performance simulations. System component specification ranges for the
investigation are determined with respect to system parameter ratios. The investigated range of installed PV power in kWp is specified to fall between 0.1 and 30.6 kWp through limiting the range of the system Array Load Ratio (ALR). The ALR relates installed power to average hourly power for the year. The investigated range of battery capacities falls between 0.15 and 100 kWh, through limiting the system Battery Demand Ratio (BDR). The BDR relates battery capacity to annual average demand. Ultimately, 122 combinations of battery and PV specifications are analyzed for each of over 2000 households. The vast array of results is plotted with respect to a third ratio, Relative Battery Capacity (RBC) for trend analysis. The RBC relates battery capacity to annual PV electricity production. It can be noted that it is practical to increase self-consumption between 18 and 48 percentage points.
3.3. Techno-economic analyses
A study has been conducted (Lehmann, Weeber, Böhner, & Steinhilper, 2016) that
investigates separate applications of peak shaving and self-consumption operation strategies to industrial application of photovoltaic production combined with a BES system. The objective is to evaluate the cost of the system over the service life with respect to the
electricity demand profile and appropriate regional irradiation profile. The peak demand is around 700 kW. Peak shaving optimization is based upon 315 kWp installed PV power for varying peak shaving targets and battery types and capacities. The results indicate that positive NPV is limited to systems which provide peak shaving between 4 and 10 percent with capacities between 10 and 250 kWh, depending on battery type. Self-consumption
optimization considers four installed peak PV power specifications between 200 and 600 kWp for storage capacities between 0 and 200 kWh. The PV production systems’ baseline self-consumptions fall in the 77 to 86 percent range. Only BES systems with less than 20kWh capacity are predicted to have positive NPV. Furthermore, these provide a marginal (2-4) percentage point increase in self-consumption.
Other researchers (Luthander, Widén, Munkhammar, & Lingfors, 2016) have carried out a techno-economic analysis of microgrid configurations that integrate PV-power production integrated with BES. A map of an actual urban neighbourhood provides useful rooftop area and building orientations upon which PV production is estimated for a community of homes. This provides a basis for implementation of a model for PV-electricity production selected from available literature. The Swedish Energy Agency has recorded household consumption datasets between 2005 and 2008 from which 21 are selected for distribution amongst the homes. A lead-acid battery is specified and implemented in the model, likewise from available literature. The battery capacity (kWh) ratio with respect to installed PV power (kWp) is a variable restricted to the range between 0 and 2. Four microgrid configurations are specified. MATLAB is employed to simulate annual operation. Results allow comparison of self-consumption ratios and curtailment losses for the four configurations. The simulation of a microgrid configuration with homes sharing a centralized BES system and a common meter predicts the highest self-consumption ratio and revenue.
3.4 System monitoring hardware
The mismatch between demand and PV production along with the intermittency presents a challenge not only during specification of this equipment. For an installed system,
performance verification can be of interest. If a simulation model exists for the system, and utility meter records are available for a representative time interval, then the meteorological records for the nearest national weather station will allow an indicative measure of
performance. Explicit performance would require an on-site measurement of the necessary system and meteorological parameters.
(Madeti & Singh, 2017) have prepared a review paper on the topic of measurement technology related to PV system monitoring. The objective is to prepare and present a comprehensive review of PV monitoring systems. The focus is on system operational architecture and system components rather than the specific PV performance and control parameters possible to evaluate with the acquired sensor data. Detailed information is presented (in text and tables) for four fundamental measurement sensors: current sensors, voltage sensors, solar radiation sensors, and temperature sensors. The purpose of
plant.” The authors cite nearly ten publications that deal with PV production system models, performance benchmarks, and system component fault detection. Specific details are not covered. Extending the function of the monitoring system to include production
management is named as a future opportunity. The authors assert that expertise is required for operation of the data acquisition (DAQ) controller, data transmission equipment, as well as the data storage and analysis equipment. The challenges of design, implementation, maintenance and operation of monitoring systems are well outlined in one section.
Regarding the system componentry this includes power consumption, harsh environmental conditions, sensor reliability, and sensor calibration. Regarding system operation this includes the lack of common measurement and post-processing protocols as well as the need for qualified personnel (PV System experts) to process the acquired PV System data. The conclusion reiterates the authors’ chosen focus: measurement sensors and data acquisition systems. They also note the complexity of sorting through available literature and finding a common design approach. Consequently, an explicit outline or example of the requirements fulfilled by chosen monitored parameters is not provided.
Another review of PV system monitoring (Rahman, Selvaraj, Rahim, & Hasanuzzaman, 2018) aims to collect and present an overview of a wide selection of monitoring systems used or proposed for PV installations. The introduction is very tentative about the application for the acquired data. It is simply asserted that the systems will acquire data for “important
parameters.” Their literature study supports presentation of eleven cases which highlight either a technique or available hardware collection are presented. It is here that a diligent reader of this review gets a better grip on the data application. The purpose of the data acquired from monitoring systems is for recording selected system operating parameters and meteorological conditions to enable calculations which can reveal system performance and/or malfunction. String level measurements can support direct fault detection for the PV panels. The focus is on available hardware for data acquisition and processing. Eleven cases which highlight either a technique or available hardware collection are presented.
Measurement devices are noted, but no explicit details are provided about data analysis. None of the cases which include BES indicate that the monitoring system integrates control. Battery control is mentioned only in a short section that touts use of an Arduino platform microcontroller module. This section contains no citations, but it asserts that the module has the module’s ability to “meet all the required criteria of PV monitoring.”
Research on home energy management (HEM) systems has been published (Rajalingam & Malathi, 2016) from an investigation of home power management methods implemented for reduction of electricity cost and peak demand. In combination with this an application of a selective harmonic elimination (SHE) method is investigated to reduce harmonic distortion caused by the DC to AC inverter providing higher power quality. Results from a comparative study simulating two HEM algorithms are presented. The authors do not provide details for the two algorithms, but they cite a document from their literature study for one of the two. The HEM algorithm for source priority selects the power source, with the solar PV source assigned first priority. The algorithm for load priority reviews hierarchical assignment of priority among “smart” home appliances. Smart appliances are equipped with their own
for the home. Results presented for the HEM algorithm for source priority show lower power consumption and lower cost. Although the smart-home is equipped with a battery as well as PV generation, no details are provided regarding control of battery operation. The smart homes are implemented in a larger distribution system model created and an SHE method is analyzed in the MATLAB/Simulink environment for power quality investigation. The chosen SHE method is called selective harmonic compensation. Again, details are not provided, but a citation to literature covering the method is made. Simulation results indicate that the method successfully reduces harmonic distortion from the inverter. The authors also
propose (without any supporting citations) that an Arduino based microcontroller might be a suitable solution to implement for” home automation applications.”
4 CURRENT STUDY
This section presents an overview of the simulation model structure. The technical principles are also outlined. Additionally, details pertinent to calculating the cost of operation for the various electricity consumer sectors are provided.
4.1 The simulation model structure
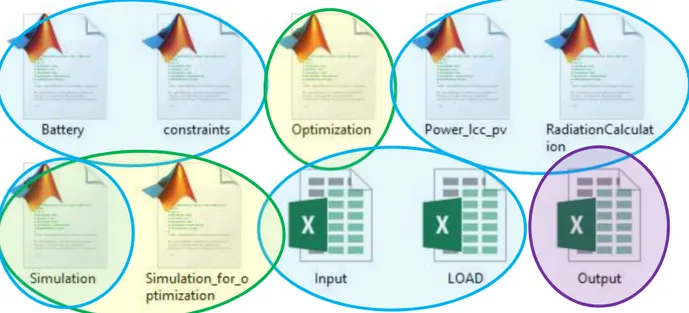
The MATLAB-based open-source simulation environment provided by Opti-CE consists of ten files as shown in Figure 2 here:
Figure 2: File structure for microgrid model solution with MATLAB based Opti-CE
simulation model.
Computer Aided Engineering is accompanied by three phases of modelling activity. A model is built or specified. The model is then analysed either for a discrete solution or for a time-based sequence of solutions. This is followed by analysis of results. Commercial software tools often refer to these three phases as pre-processing, solution, and post-processing. The Opti-CE structure reflects these phases. In Figure 2, Blue fields enclose pre-processing files for model specification. Green/yellow fields enclose processing files for model solution, and the purple field indicates the results file upon which post-processing can be based.
“LOAD” and “Input,” are excel spreadsheets for pre-processing. “Input” is a database of parameters which characterize the system model. This includes climatic data and solar radiation data for the geographic location of the simulation. It includes technical
performance parameters for the PV system, the inverter, and the battery. It includes the aggregate load profile for the microgrid. And it includes Swedish electricity market history data, i.e.: Elspot prices. LOAD is a collection of electricity consumer load profiles.
which apply the equations which simulate system performance. The “Battery” function includes the conditional logic to implement the control strategy for battery discharge and charge.
The MATLAB script, “Simulation.m” is a solver for simulation of a system that includes DERs with fixed specifications. I.e.: no optimization is carried out for the solution. This script calculates total annualized costs for three configurations: individually connected customers, customers consolidated to share a common meter (a basic grid-connected microgrid), and when the microgrid integrates DERs. This research will be limited to DER simulations which simultaneously integrate BES and PV generation in the microgrid.
The scripts “Simulation_for_Optimization” and “Optimization” are solvers to support selection of an optimal system specification. An essential element of the “Optimization” script is specification of a set of decision variables which set the upper and lower bounds for the parameters which are varied during the optimization.
The final file, “Output,” is an excel spreadsheet utilized during post-processing. It is a database from which evaluation of the optimization results can be based.