VTI rapport 570A Published 2007
www.vti.se/publications
VMS – Variable Message Signs
A literature review
Sara Nygårdhs Gabriel Helmers
Publisher: Publication:
VTI rapport 570A Published: 2007 Project code: 80643 Dnr: 2006/0055-28
SE-581 95 Linköping Sweden Project:
Use of VMS
Author: Sponsor:
Sara Nygårdhs Gabriel Helmers
Danish Road Directorate
Title:
VMS – Variable Message Signs. A literature review
Abstract (background, aim, method, result) max 200 words:
This literature review is primarily aimed at describing studies that deal with the interaction between driver behaviour and variable message signs, VMS. The collected references are, for the most part, published in Europe or studies about European conditions, published during the years of 2000–2005. Areas treated in the study are effects on driver behaviour, driver attitudes, design, understanding and recall of VMS, and accidents and regulations concerning VMS.
The literature review is supplemented by a behavioural background and recommendations from a behavioural science perspective.
Keywords:
Literature review, VMS, variable message sign
Utgivare: Publikation:
VTI rapport 570A Utgivningsår: 2007 Projektnummer: 80643 Dnr: 2006/0055-28 581 95 Linköping Projektnamn: Användning av VMS Författare: Uppdragsgivare: Sara Nygårdhs Gabriel Helmers Vejdirektoratet, Danmark Titel: VMS – Variabla meddelandeskyltar. En litteraturstudie
Referat (bakgrund, syfte, metod, resultat) max 200 ord:
Denna litteraturstudie redovisar i huvudsak undersökningar som har syftat till att undersöka sambandet mellan trafikantbeteende och variabla meddelandeskyltar, VMS. De samlade referenserna är till
övervägande del publicerade i Europa eller handlar om europeiska förhållanden samt är utgivna under åren 2000–2005.
Områden som behandlas i studien är effekter på förarbeteende, förarattityder, utformning, förståelse och hågkomst av VMS samt olyckor och regelverk gällande VMS.
Litteraturstudien är kompletterad med en beteendevetenskaplig bakgrund och rekommendationer ur ett beteendeperspektiv.
Nyckelord:
Litteraturstudie, VMS, variabel meddelandeskylt
Preface
This study has been performed on commission by Danish Road Directorate where Kenneth Kjemtrup has been the contact. The literature review has been carried out by Sara Nygårdhs, VTI, and was supplemented with a chapter on VMS behavioural background and recommendations by Gabriel Helmers, behavioural scientist. The author would like to thank Hillevi Nilsson Ternström at BIC, the library and
information centre at VTI, for information retrieval and Sven-Olof Lundkvist, VTI, for support during the work.
Linköping December 2006
Quality review
Internal peer review was performed on 2006-12-11 by researcher Sven-Olof Lundkvist. Sara Nygårdhs has made alterations to the final manuscript of the report on 2006-12-13. The research director of the project manager Gudrun Öberg examined and approved the report for publication on 2007-01-05.
Kvalitetsgranskning
Intern peer review har genomförts 2006-12-11 av forskare Sven-Olof Lundkvist. Sara Nygårdhs har genomfört justeringar av slutligt rapportmanus 2006-12-13.
Projektledarens närmaste chef Gudrun Öberg har därefter granskat och godkänt publikationen för publicering 2007-01-05.
Contents
Summary... 7
Sammanfattning ... 5
1 Introduction ... 9
2 Definitions ... 10
3 Effects on Driver Behaviour ... 11
3.1 Speed Limit Signs... 12
3.2 Danger Warning Signs... 14
3.3 Informative Signs ... 15
4 Driver Attitudes ... 19
4.1 Speed Limit Signs... 19
4.2 Danger Warning Signs... 20
4.3 Informative Signs ... 21
5 Design, Understanding and Recall of Signs... 22
6 Accidents ... 31
7 Message Data Bases... 32
8 Regulations, Recommendations and Use of VMS ... 33
8.1 The Nordic Countries... 33
8.2 Other European Countries ... 36
9 Criteria for VMS ... 38
10 Future Research - Proposals in the Literature ... 39
11 VMS – Behavioural Background and Recommendations ... 40
11.1 Some Basic Principles of a Mental Model of Driver Behaviour ... 40
11.2 To Influence Driver Behaviour by Fixed and Variable Message Signs .. 43
11.3 Recommendations for the Use of VMS... 44
VMS – Variable Message Signs. A literature review
by Sara Nygårdhs and Gabriel Helmers
VTI (Swedish National Road and Transport Research Institute) SE-581 95 Linköping Sweden
Summary
The acronym VMS stands for Variable Message Sign. It is a sign for the purpose of displaying one of a number of messages that may be changed or switched on or off as required (CEN, 2005).
This literature review is primarily aimed at describing studies that deal with the interaction between driver behaviour and VMS. The collected references are, for the most part, published in Europe or studies about European conditions, published during the years of 2000-2005.
Areas treated in the study are effects on driver behaviour, driver attitudes, design, understanding and recall of VMS, accidents and regulations concerning VMS. Some of the studies are referred to below.
In a research project it was concluded that variable speed limit signs were most often obeyed, but display of extra information justifying the speed limit led to higher compliance. A warning sign alone was less effective than the combination of speed limit sign and additional information.
An English study describes a warning system for fog on motorways in London. When the fog messages were shown, there was a significant speed decrease. The conclusions of the investigation indicate that the fog warnings caught the attention of the drivers for fog ahead and that the drivers were better prepared to drive safely through the fog. The expectations of the driver and the reliability of the information are two important factors to consider when showing a VMS. The system must work and show correct messages because the drivers expect to get updated information and the information has to be reliable to be obeyed.
A Finnish study states that drivers accept VMS and rely on the system. Almost all drivers consider VMS based on real-weather and road condition data to be necessary. The most common advantages mentioned with VMS are improved traffic flow and increased traffic safety.
In another Finnish study, drivers declare that with VMS their attention is focused on searching for potential hazards, they test the road for slipperiness and are more careful when overtaking. Most drivers accepted lowered speed limits and found variable speed limits valuable. It is concluded that an effective variable message sign may draw attention from other, fixed signs. This leads to recommending slippery road signs only at critical spots, and variable speed limits for longer road sections.
The literature review is supplemented by a behavioural background and recommendations from a behavioural science perspective.
VMS – Variabla meddelandeskyltar. En litteraturstudie
av Sara Nygårdhs och Gabriel Helmers VTI
581 95 Linköping
Sammanfattning
Förkortningen VMS står för Variable Message Sign, dvs. variabel meddelandeskylt. Det är en skylt som är gjord för att visa ett av ett antal meddelanden som kan ändras, stängas av eller slås på efter behov (CEN, 2005).
Denna litteraturstudie redovisar i huvudsak undersökningar som har syftat till att undersöka sambandet mellan trafikantbeteende och VMS. De samlade referenserna är till övervägande del publicerade i Europa eller handlar om europeiska förhållanden samt är utgivna under åren 2000-2005.
Områden som behandlas i studien är effekter på förarbeteende, förarattityder, utformning, förståelse och hågkomst av VMS samt olyckor och regelverk gällande VMS. Några av studierna refereras nedan.
I ett forskningsprojekt fann man att variabla hastighetsskyltar åtlyddes i hög grad, men kompletterande information som rättfärdigade hastighetsbegränsningen ledde till högre efterlevnad. Varningsskyltar utan hastighetsbegränsning var mindre effektiva än kombinationen av hastighetsbegränsning och ytterligare information.
En engelsk studie beskriver ett varningssystem för dimma på motorväg i London. När meddelande om dimma visades minskade hastigheten signifikant. Slutsatserna från studien tyder på att dimvarningarna gör att förarna blir uppmärksamma på kommande dimma och att de blir bättre förberedda på att köra säkert genom dimman.
Förarens förväntningar och tillförlitligheten hos informationen är två viktiga faktorer som måste övervägas när en VMS ska visas. Systemet måste fungera och visa korrekta meddelanden eftersom förarna förväntar sig att få uppdaterad information och informa-tionen måste vara tillförlitlig för att åtlydas.
En finsk studie konstaterar att förare accepterar VMS och litar på systemet. Nästan alla förare anser att VMS baserade på realtidsvärden för väder och vägtillstånd är
nödvändiga. Bättre trafikflöde och ökad trafiksäkerhet hör till de vanligast nämnda fördelarna med VMS.
I en annan finsk studie uppger förarna att med VMS fokuseras deras uppmärksamhet på att söka efter möjliga risker, de testar om vägen är hal och är försiktigare vid omkör-ningar. De flesta förare accepterade lägre hastighetsbegränsningar och tyckte att variabla hastighetsbegränsningar hade ett värde. Slutsatsen från denna studie är att en effektiv variabel meddelandeskylt kan ta uppmärksamhet från andra, fasta, skyltar. Detta leder till en rekommendation av halkvarningsskyltar enbart vid kritiska punkter, och att variabla hastighetsbegränsningsskyltar ska finnas på längre vägsträckor. Litteraturstudien är kompletterad med en beteendevetenskaplig bakgrund och rekommendationer ur ett beteendeperspektiv.
1 Introduction
The acronym VMS stands for Variable Message Sign. It is a sign for the purpose of displaying one of a number of messages that may be changed or switched on or off as required (CEN, 2005).
This literature review is aimed at the interaction between human behaviour and VMS. The collected references are, for the most part, published in Europe or are studies about European conditions, published during the years of 2000-2005.
2 Definitions
VMS is a composed conception of dynamic message signs. Some examples of those kinds of signs are:
• Sign with speed limit altered depending on weather or traffic conditions or both. • Sign activated by speeding drivers. (Vehicle activated signs, VAS.)
• Parking sign showing if there are available spaces in a car park. (Not included in this literature study.)
• Tunnel management, i.e. overhead signs showing which lanes can be used for entering the tunnel.
Some definitions related to VMS (Vägverket, 2003):
• Message: A configuration of sign symbols and/or characters. • Pictogram: A message consisting of stylized pictures.
• Active message: When the road sign is in operation and the appropriate message is completely visible. The appropriate message can be that no message is shown (blank message space).
• Variable Message Sign, VMS: A road sign which by active message can show alternate messages which can be altered when required.
• Continuous VMS: A variable message sign that can present messages in the shape of intact sign images or intact characters or both. Continuous road signs are from a distance perceived in the same way as stationary road signs.
• Discontinuous VMS: A variable message sign based on pixel technique.
• Display surface: The visible part of a variable message sign which incorporates the pixels or the variable parts demanded for a message to be presented.
• Colour inversion: By colour inversion is meant a colour scheme of the sign image based on luminous symbols, border and characters shown on a dark ground. Colour inversion can only be made on luminous discontinuous VMS. • Luminance: A measure of how much light an area emits and which indicates
how bright the human eye perceives a surface. Measured in cd/m2. • Visibility: The visual range of a road sign.
• Visual performance: A measure of visibility and legibility for a variable message sign under varying visual conditions and when considering human ability.
3
Effects on Driver Behaviour
Steinhoff et al. (2000) report on experiments supported by the European Commission within the scope of the research project TROPIC, with the aim of developing VMS knowledge in Europe. One investigation was made in order to find out whether the compliance was higher for a speed limit sign displayed with another sign explaining why the speed limit was set. It was concluded that speed limit signs were most often obeyed, but display of extra information justifying the speed limit led to even higher compliance. Warning signs without speed limits were less effective than the
combination of speed limit sign and additional information. Another experiment focused on the comprehension of combinations of messages and symbols. Confusion arose between signs indicating the distance to a dangerous area and the spatial extension of some condition. Also, the “lane closed” sign led to confusion. Except for these signs, most drivers correctly interpreted the VMS in 1.0–2.5 s. There was also an experiment of perception at a three-lane-road outside Munich. The signs were displayed above the three traffic lanes with five parallel spaces for messages. Sometimes there were only three speed limit signs, one for each lane, and sometimes they were complemented by two explanatory signs between them. See Figure 3.1.
Figure 3.1 Examples of signs displayed above a three-lane-road outside Munich. The upper signs have a shorter perception time than the lower signs. Steinhoff et al., 2000.
It was found that the more information (for example speed limit signs together with warning signs), the longer the perception time. The shape of the additional information sign had no observable effect on any lane. When different combinations of wet road warnings were investigated it was concluded that the willingness to comply with a speed limit increases when it is displayed together with a sign justifying the speed limit. The drivers want the reason for the speed limit to be explained by a warning sign between the speed limit displays. Symbols were better than pure text messages and redundant information should be avoided. From these tests the conclusions were that:
• Critical safety messages can be perceived by most drivers in real traffic. • Most drivers favour additional information to the speed limit.
• Additional information does not have a large effect on compliance to speed. An explanation for the last conclusion could be that drivers do not consider the warning reliable. Another explanation could be that speed change is not the best measure of compliance and that the driver instead could have increased attention and more farsighted driving to increase safety.
In Sweden, a Road Weather Information System (RWIS) collects data through weather stations strategically located. Tests of cooperation with variable message signs have been carried out, where warning messages as well as recommended speed limits could be posted (Karlberg, 2002). This led to decreases in average speed by about 10 %, decreases in speed distribution by about 20 % and increased spacing between vehicles.
In connection to the rebuilding of the motorway ring road in Copenhagen, cameras and variable message signs have been established where the road was widened (Copenhagen Plans Ahead, 2005). The signs show both speed and information messages. By means of this, the traffic is successfully redirected so the traffic volume in rush-hour has decreased.
3.1
Speed Limit Signs
In the Netherlands, VMS may be used for two different purposes; for information about incidents and for general advice (de Craen & de Niet, 2002). It seems that displaying incident information in the form of adjusted speed limits leads to a change in driver behaviour. This change is greater if the lower speed is accompanied by an explanation of the reason for the lower limit.
A German study (Steinhoff et al., 2002) examined how effective dynamic speed limits were on three motorways, using traffic flow measures. Both surveys and laboratory investigations showed that all safety related signs were interpreted fast and, for the most part, correctly. When the difference between the prescribed speed limit and the actual traffic situation was large, the compliance was lower. The conclusion was that the greatest improvement can be made by optimizing the detection of an occurring incident (less error alarms, correct right-on-time warnings), and also to make the difference between warnings and preventing strategies clear.
Steinhoff et al. (2001) showed, using two statistical methodologies, that the compliance rate cannot simply be measured by comparing the speed change of the vehicles with the mandatory speed limit. More context-specific data, such as the current and previous traffic states must be calculated with as well. Poor compliance with VMS could be explained by the drivers’ previous experience of unreliable and inaccurate information. From proceedings from a conference (Rämä et al., 2001) some results can be read when speed limits are lowered automatically during adverse road conditions and in some cases warning signs for slippery road are shown as well. It was concluded that raising the speed limit from 80 km/h to 100 km/h led to increased mean speed by 3.9 km/h for cars travelling in good road surface conditions. Lowering the speed limit from 100 km/h to 80 km/h during poor weather conditions, on the other hand, decreased the mean speed by 3.0 km/h. If the slippery road sign was shown, the mean speed decreased by 2.5 km/h in poor road conditions.
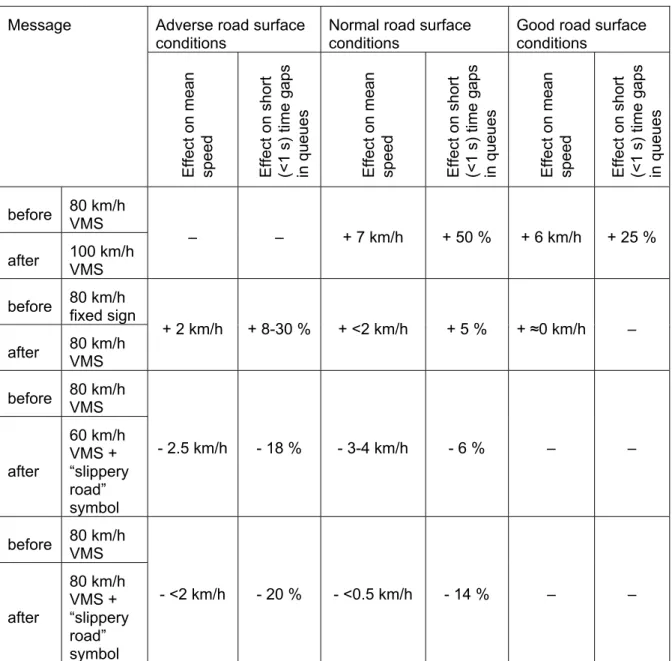
Hautala et al. (2002) report on a study where the effects of variable speed limits were investigated on the E18. The speed limits used were 60, 80 and 100 km/h, respectively. A before-and-after study was carried out on traffic flow effects. Table 3.1 shows the results. As an example, an increase of the speed limit from 80 km/h to 100 km/h on the variable message sign led to increased mean speed of cars and vans by about 7 km/h in normal and by about 6 km/h in good road surface conditions.
Table 3.1 Traffic flow effects in adverse, normal and good road surface conditions, respectively. (Hautala et al., 2002.)
Adverse road surface
conditions Normal road surface conditions Good road surface conditions Message Effect on me an speed Effec t on sho rt (<1 s) time g aps in queues Effect on me an speed Effec t on sho rt (<1 s) time g aps in queues Effect on me an speed Effec t on sho rt (<1 s) time g aps in queues before 80 km/h VMS after 100 km/h VMS – – + 7 km/h + 50 % + 6 km/h + 25 %
before 80 km/h fixed sign after 80 km/h VMS + 2 km/h + 8-30 % + <2 km/h + 5 % + ≈0 km/h – before 80 km/h VMS after 60 km/h VMS + “slippery road” symbol - 2.5 km/h - 18 % - 3-4 km/h - 6 % – – before 80 km/h VMS after 80 km/h VMS + “slippery road” symbol - <2 km/h - 20 % - <0.5 km/h - 14 % – –
A particular type of speed limit signs are the vehicle activated signs (VAS). These signs are activated by speeding vehicles or where the speed must be reduced because of a special danger (VAS with RMS and data gathering built in, 2005). Siemens is one of the companies which has thought about the hazard outside schools, where the speed limit should be lowered at certain periods of time. From Siemens’s point of view the low speed limit should only be activated at the start and at the end of the school day. At holidays, the speed should naturally not be lowered. When the speed limit is
permanently set to a low value, frequent drivers will find that this is often inappropriate and therefore neglect the sign, which leads to higher speeds.
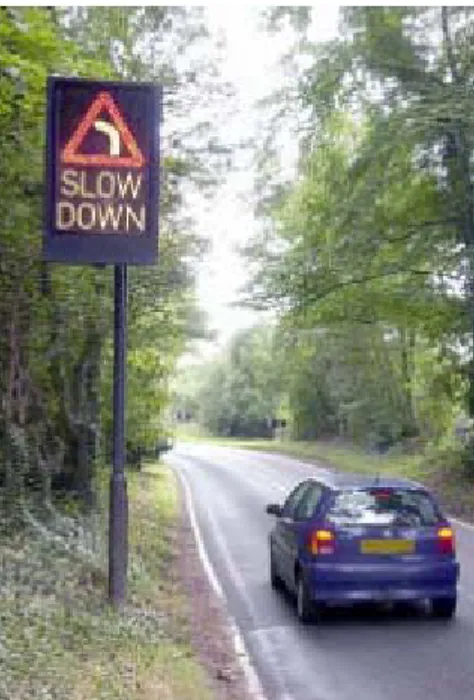
As an attempt to change the driver attitudes towards speeding, interactive electronic signs have been installed at ten points on a road in the United Kingdom (Changing attitudes towards speeding, 2002). The signs immediately show the vehicle speed and the message is repeatedly given along the route. Several different messages can be
displayed, all with the aim to slow speeding vehicles down. Results from the trial show an 11 km/h decrease in average vehicle speed.
On several places in England, a large test on vehicle-activated signs was carried out (Winnett & Wheeler, 2002). Signs for mandatory speed limit, warning signs for bends and junctions, and safety camera repeater signs were lit up when a vehicle was driving too fast. (See Figure 3.2.) Speed data before and after installation of VAS was collected, and accident data and public opinions were investigated. The results showed that for lit up speed limit roundel signs, the average mean speed was reduced by about 6 km/h (4 mph). For signs where the speed limit was also reduced by 16 km/h (10 mph), the mean speeds were reduced as much as by 22 km/h (14 mph). Lit up junction and bend warning signs reduced mean speeds by up to 11 km/h (7 mph), and the safety camera repeater signs led to reductions of up to 6 km/h (4 mph). In addition, the percentage of vehicles exceeding the speed limit was reduced, especially for the speed limit roundels. The authors of the report conclude that drivers can be influenced to reduce speed by VAS. Vehicle-activated signs appear to effectively reduce speeds and especially to reduce the number of drivers exceeding the speed limit. No proof that drivers would become less responsive to the signs over time has been found, even over three years.
Figure 3.2 Warning sign for bend. Winnett & Wheeler, 2002.
3.2
Danger Warning Signs
Cooper & Sawyer (2005) describe a warning system for fog on motorways in London. The system automatically detects fog by detectors at 54 fog prone areas along the motorway. When the visibility is less than 250 m the word “fog” is shown on the variable message signs at 0.8 to 2.2 km before the traffic encounters the detector. During periods of heavy fog extra warnings can be stated on signs at 1.8 to 3.8 km before the detectors. The effectiveness of the system was examined by speed
measurements during fog. Twelve VMS were chosen for evaluation: all at three-lane sections of motorway and also sufficiently far from intersections so that vehicles
normally should be travelling with constant speed and without changing lanes. A pair of inductive loops was established in the lane about 300 m after the signs in order to
collect data. During the evaluation period from November 1990 to the end of March 1992 fog frequently occurred and a total of about 240 data files were collected, where each file contained data for about 20 000 vehicles. The study measured vehicle speeds and also compared the mean speed change during the observation period before and after showing fog warning messages at VMS. The speed changes were also compared to the speed changes at the same time during days without fog. When the fog messages were shown, there was a significant speed decrease by on the average 2.9 km/h. The speeds decreased the most at the inner, faster lanes, while less speed reductions occurred at outer, slower lanes. Faster vehicles slowed down more than the average when the fog warnings were shown. When the signals were turned off the speed increased. The conclusions of the investigation were that the speed decreases indicate that the fog warnings caught the attention of the drivers for fog ahead and that the drivers were better prepared to drive safely through the fog.
By introducing a similar system the mean speeds in southern Saudi Arabia were also reduced by fog (Al-Ghamdi, 2004). In this case the speed decrease was 6.5 km/h. A comparison between VMS and in-vehicle information was carried out in the
Netherlands (Hogema & Goebel, 2000). The study was performed in a driving simulator where the drivers occasionally were confronted with a stationary traffic queue.
Sometimes they were given information by variable message signs, sometimes by in-car information and sometimes there was no information at all. It was concluded that with a queue warning system drivers slowed down in advance of the tail of the queue, and the maximum decelerations were smaller than without a system. The in-car information led to behaviour closest to the condition without any pre-warning information. The
conclusion was that replacing roadside information with in-car information will not always lead to better results in terms of driving behaviour.
In an American driver simulator study the effect of real-time information for weather and casualty risks via VMS and advisory systems inside the car was investigated (Boyle & Mannering, 2004). During the journey in the driving simulator, data about the driver speed behaviour was collected under four different conditions: messages inside the car, messages outside of the car, messages both inside and outside the car, and without any message. The results show that although the speed is significantly reduced during adverse conditions due to messages, the drivers tend to compensate for this reduction by increasing speed when the message is out of sight or no longer valid.
3.3 Informative
Signs
According to Kronborg (2001) the compliance of a VMS when it comes to alternate road choice depends mainly on the following factors:
• How many have read the message on the VMS? • How many understood the message on the VMS? • How many trusted the message on the VMS?
• For how many drivers is it relevant to use the alternative route? • How accessible is the regular road perceived?
• How accessible is the alternate road perceived? • How well do the motorists know the alternate road?
• What is said in the radio and other IT-based systems? • How do the motorists experience the traffic situation?
Kronborg’s conclusion is that between 0 and 40 % of the road-users normally choose an alternative route after being aware of the information through VMS. The share strongly varies depending on the different factors above.
Two major problems with traffic diversion are that:
• The alternative road network can be heavily loaded and a diversion could lead to delays there.
• If all drivers achieve the traffic diversion information the socioeconomic effect could be negative because drivers with higher time values than the average driver often choose an alternative route spontaneously.
Kronborg means that planned road work at night is a situation when diversion works well.
There are two important things to consider when showing a VMS. These are the driver expectations and the credibility of the information (Kronborg, 2001). With driver expectations is meant that the system has to work and show correct messages because the drivers expect to get updated information. This is a necessity that must be provided for. Credibility means that the information has to be relevant and rational to be obeyed. Furthermore, Kronborg says:
• Less information or no information at all is better than an ill-founded message. To not show any message is better than guessing.
• Never show messages that the motorists do not find rational. Regulating instructions about road choice should only be given if well motivated.
• Never encourage motorists to deviate from the ordinary route in order to balance demand with accessible capacity in rush-hours, unless this favours the individual driver. This may produce great credibility problems.
• The recommended alternate road must result in an evident improvement (saving of time) of the journey.
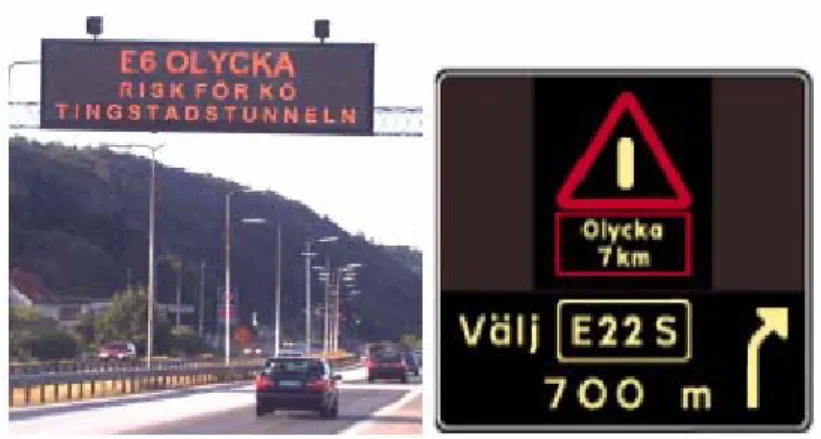
The literature study made by Kronborg shows that accident message together with diversion has had the largest effect on the compliance of the message. Another Swedish study is described in which the message “E6 Risk för kö Tingstadstunneln” (“E6 Risk of queue Tingstad Tunnel”) was shown for ten minutes and when the queue length was one kilometre. See Figure 3.3.
Figure 3.3 Left: Sign showing “E6 Accident, Risk of queue, Tingstad tunnel”. Right: Sign showing “Accident 7 km, Choose E22 S, 700 m”. Kronborg, 2001.
The drivers were interviewed in the evening by telephone and hardly 20 % of the total number of interviewee chose another route because of the message. Others did not remember which message had been shown or they had a destination which made it irrelevant to choose another route. Of those remembering the message and who had a possibility to choose another route, slightly more than 40 % did.
Furthermore, Kronborg (2001) found that in Paris where there are 350 VMS on the ring motorway, 80 % of the drivers preferred to be informed of travel time rather than queue lengths. 82 % of the questioned drivers regularly using the VMS road network in Scotland say they follow the information from the VMS although it doesn’t agree with other information. Investigations in Japan show that, in the following order, experience, feeling, VMS and radio information, respectively, are the decision grounds having the largest impact when considering choosing an alternative route. When a route is driven for the first time an alternative route is seldom chosen.
In trials between Lund and Malmö in Sweden 6–41 % of the drivers responded to VMS suggesting alternative routes to avoid congestion (Davidsson & Taylor, 2003). For maximum delay to be controlled, 30 % of the drivers would have to follow the recommendation. It is not considered desirable to get all vehicles to diverge from a congested route, because the alternative road network would in that case be overloaded. Empirical studies on diversion have been carried out in Norway to investigate the effects of variable message signs on driver behaviour (Erke et al., 2005). In the main study, two sites were used for VMS on which the signs changed every quarter of an hour between 22:30 and 24:00, to either a blank message or to a text message. The information presented was a road closure and a recommendation to choose another route. It was found that about one fifth of the drivers who otherwise would have chosen the closed route, changed their route choice in accordance with the recommended route on the VMS. Most of those who continued past the supposedly closed road, diverted on other exits between the posted message and the place where the road was closed. Only a few people drove to the closure. Average speeds were considerably reduced when there was text on the VMS. At both test sites, the average speed was reduced by 4.7 and 6.0 km/h, respectively. The part of cars braking when the signs showed text increased from 0 to 7 % at one site, and from 3 to 19 % at the other. The authors conclude that the technical characteristics of the text messages (bad legibility at large distances) might contribute to braking vehicles and speed reduction. It is also a special challenge that the variable message signs post information that for the most part is unexpected, and that
text is harder to link to actions than known symbols. This may also be a source of speed reduction, while it takes some time to perceive and interpret the message.
In Scotland, a system called NADICS, Scotland’s National Driver Information and Control System is used (Traffic Scotland). Information about disturbances on the Scottish main roads can be gained from VMS and a website showing where the
disturbances are and which messages are shown on the different variable message signs. The reason for this is to enhance the safety and effectiveness of the road network. By messages through VMS drivers are warned of problems on the road network
beforehand, such as road maintenance, accidents, adverse weather conditions and road closures. This information can help the drivers to slow down, change lanes or choose the best alternative route. When specific traffic information is not necessary, safety messages such as ”Drive with consideration”, ”Frustration can cause accidents” and ”Please be a courteous driver”, but also information about parking spaces and about the website for Traffic Scotland is shown.
In the Netherlands VMS may be used for information about incidents and for general advice (de Craen & de Niet, 2002). Interviews with and observations of car drivers indicate that not much attention is paid to the general messages. The extra information does, however, not seem to have any negative road safety effects either, according to the authors.
4 Driver
Attitudes
A comparing study of driver attitudes to VMS in Canada and United Kingdom was reported by Cheng (2002). The drivers in the U.K. were older and had more years of driving experience, whereas the Canadian drivers were more familiar with VMS. The results from questionnaires showed that Canadian drivers regarded VMS as more effective and more useful. Most drivers in both countries preferred to receive traffic information through radio and VMS’s (in the article by Cheng, however, it is not mentioned whether these were selected among other information channels or if this was the answer of an open question). A large proportion of the interviewed drivers would be frustrated if the information on the VMS was inaccurate and 80 % of the drivers would like the displayed message to include the time when it was first posted. Overall, the VMS’s were recognized to be “somewhat up-to-date”, slightly more than “somewhat reliable” and more than “somewhat useful”. Canadian drivers, who were more exposed to VMS, found the information more reliable, effective, up-to-date and useful than the British drivers. They also thought that safety slogans were effective means of achieving a safer driving environment. A conclusion from the study was that when more VMS’s are installed in the United Kingdom, driver perception is likely to improve as exposure and experience increase.
4.1
Speed Limit Signs
In a Finnish investigation (Schirokoff & Vitikka, 2002) the speed limits were varied by VMS, primarily based on weather and road conditions. For stretches of the road without junctions, the speed limit was 100 km/h during normal road conditions, 80 km/h during bad and 70 km/h during really bad road conditions. At junctions, the speed limit was 80 km/h for normal road conditions, 70 km/h for bad and 60 km/h for really bad road conditions. The driver attitudes to this were analysed through road-side interviews. Most drivers knew that the signs were variable but older people to a smaller degree. Most of them also knew that the speed limits were controlled according to weather and road conditions, but did not know that the data was collected automatically.
Additionally, 11-16 % thought that the speed limits were also controlled by the
prevailing traffic situation. Generally the drivers accepted the dynamic speed limits and trusted that they were correct with respect to the circumstances. Maintaining this trust sets high quality requirements for the operation and control of the system.
In another Finnish study (Rämä et al., 2001) it was stated that drivers accept VMS on the E18 and rely on the system. 96 % of the drivers consider VMS based on real-weather and road condition data to be necessary. Inadequate speed limits, however, increase the mean speed and decrease the time gap between cars. In a field study where VMS replaced the fixed speed limit 80 km/h, 78 % of the drivers considered 80 km/h to be the appropriate speed limit in poor road surface conditions in daylight (Hautala et al., 2002). 67 % considered the appropriate speed limit in good road surface conditions in the dark to be at most 80 km/h. The most common advantages mentioned were improved traffic flow and increased traffic safety.
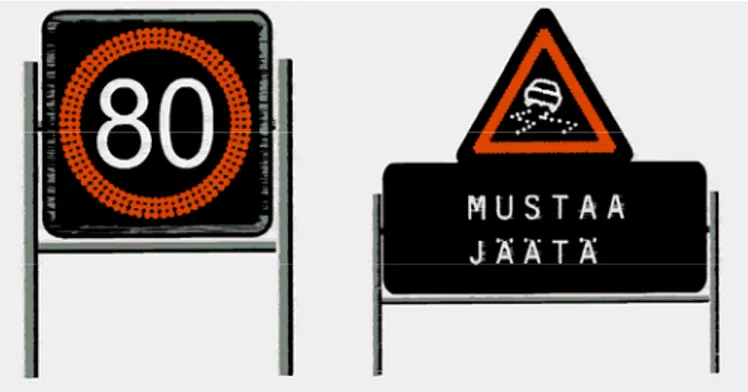
VMS showing a minimum headway sign (minimum distance between two cars) decrease the proportion of short headways (Rämä, 2001). This sign in addition to a slippery road condition sign lead to decreased mean speed of cars travelling in free-flow traffic by 1–2 km/h. (See Figure 4.1.)
Figure 4.1 Slippery road condition sign and minimum headway sign. Rämä, 2001.
Drivers themselves state that with VMS their attention is being focused on searching for potential hazards, they test the road for slipperiness and are more careful when
overtaking. In the winter, weather-controlled speed limits lowered from 100 km/h to 80 km/h decrease the speed by 3.4 km/h. The effectiveness was highest when the adverse conditions were hard to detect. Most drivers accepted lowered speed limits and found variable speed limits valuable. It is concluded that an effective variable message sign may draw attention from other, fixed signs. This leads to recommending slippery road signs only at critical spots, and variable speed limits for longer road sections. In England, a large test on vehicle-activated signs was carried out, where signs for mandatory speed limit, warning signs for bends and junctions, and safety camera repeater signs were lit up for speeding vehicles (Winnett & Wheeler, 2002). Public opinions were collected in locations where speed limit roundels or junction signs had been installed. The public response on use of vehicle-activated signs was very positive. Most drivers connected their own speed to the signs being triggered. They thought that exceeding the speed limit triggered the speed limit roundel sign and that the junction sign was triggered to make them slow down or to warn them about a specific hazard.
4.2
Danger Warning Signs
An interview study on variable queue warning signs was carried out in Gothenburg (Dahlstedt, 2002). Morning drivers were interviewed the same day about the
circumstances of the morning traffic in which they participated. Some of the different driver opinions were that:
• the signs were surely helping drivers who were not familiar with the road • the signs must be expensive
• it is a waste to have VMS because of the constant morning queues • the signs are a useful reminder
• the first signs should be placed further in advance (making it possible to take another road)
• it is better to have radio information
• the signs should stop the traffic to avoid getting stuck in the tunnel.
It was clear that the signs did not always work properly, since some interviewed drivers had noticed that the sign was off when there was a queue, and some drivers had noticed that the sign was on when the traffic was free-flowing. The author concludes that a complete reliability on the function and the information of the system is crucial for accepting this and similar systems in the long run. Many of the interviewed drivers had
both seen the signs and interpreted them correctly. However, the distances between vehicles were somewhat shorter after introducing the queue warning signs than before.
4.3 Informative
Signs
Investigations in the United Kingdom showed that drivers want more variable message signs (Cooper & Mitchell, 2002). They would like to be informed about traffic events such as incidents and hazards. Safety-related non-traffic messages such as “KEEP YOUR DISTANCE” are expected to have a speed reducing effect on drivers, at least in the short term. It is suggested that these signs are to be tested in trials for a duration of at least one year in an area with a substantial number of signals.
In a Finnish study regarding end users’ opinions on different transport telematic
services, it was seen that the users appreciated automatic camera enforcement, variable speed limit signs and real-time weather and road condition information the most (Anttila et al., 2003). For drivers, incident information before and during the trip was considered as the most important services. For public transport travellers, route
planning, travel time estimation and real-time stop time was found most important. Both drivers and public transport travellers thought that more public funding should be
allocated to public transport services than to driver services.
A study by Chatterjee & McDonald (2004) concludes from field trials in Europe that considerable diversions occur when the information given on the VMS differs from the normal route advice. If no traffic problems are reported on the major route, the use of alternative routes decreases. The drivers like the travel time information and find it to be useful in traffic diversion. Diversion on the VMS is seen as effective in making travel times shorter and reducing environmental impacts.
5
Design, Understanding and Recall of Signs
Free text signs normally have 3–4 lines of text with about 20 characters in each line (Kronborg, 2001).
A comparison between two VMS technologies has been made by Penttinen et al. (2000a; 2000b). The technologies used were:
• Fibre-optic signs with small lenses, where the legend was white and the background was black. The output level was adjusted automatically depending on the ambient light.
• Electromechanical signs with a fluorescent retroreflective sheeting, with black legend and yellow background.
The speed at the test site was normally 80 km/h but during the test it was 60 km/h shown by VMS of the two technologies previously mentioned. Speed data was collected and driver interviews were carried out during weekdays, in daylight as well as in the dark. The following results were found:
• In daylight there was no significant speed difference connected to the two VMS technologies.
• In the night-time, the fibre-optic sign induced cars and vans to slow down significantly more (3.9 km/h) than the electromechanical sign did.
• The speed limit was exceeded less often with the fibre-optic VMS in the dark. • Drivers recalled the fibre-optic sign more frequently than the electromechanical
sign. In the dark, the fibre-optic sign was recalled by 74 % and the electromechanical sign by 57 % of the drivers.
• A high level of brightness was recalled by the drivers for both signs, except for in darkness, when they frequently thought that the electromechanical sign was a conventional one.
• Both in daylight and in night-time, drivers recognized the fibre-optic signs to be variable more often than the electromechanical sign.
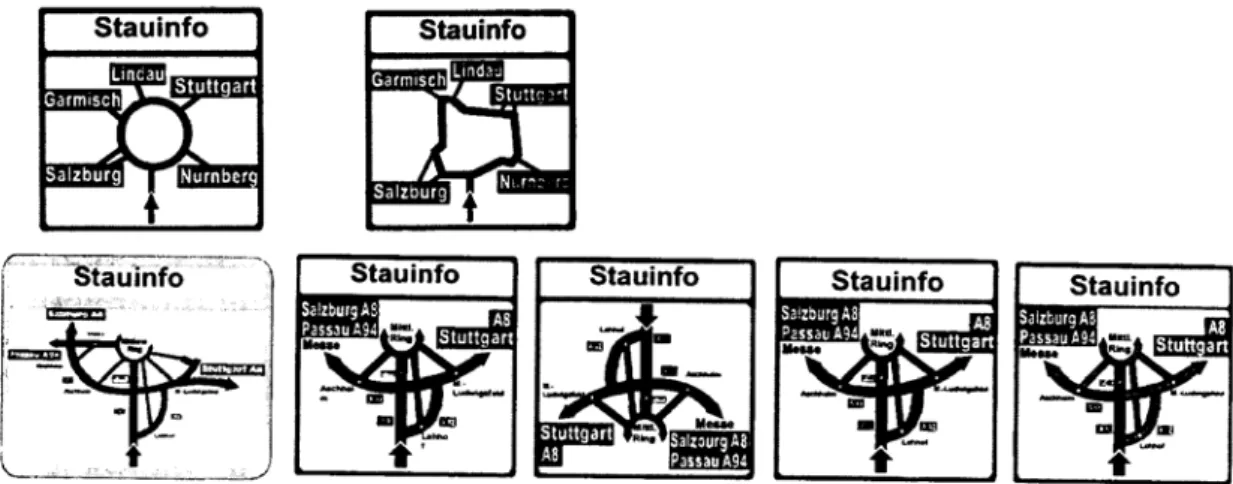
Colour coding of signs for congestion was tested for different types of signs in simulator studies in Germany (Tsavachidis et al., 2000). Some of the signs were ring road designs while others were motorway designs. See Figure 5.1.
Figure 5.1 Signs for congestion used in simulator studies in Germany. Note that the colour coding cannot be seen in the figures here. Tsavachidis et al., 2000.
None of the signs presented indicated a safety risk but the comprehension varied much between them. The ring road designs were found to be simple and easy to understand while the complex motorway designs were harder to comprehend. Laboratory and simulator experiments resulted in the following recommendations:
• A network graph should be given from the drivers’ perspective.
• Only two colours should be used for indicating congestion (one for congested and one for not congested). This reduces the complexity of the information. • A network graph should be schematic but with the important characteristics
distinct.
• An information sign should have a header specifying its functionality (for example “CONGESTION INFO”).
• Only supervised parts of the network should be shown on a dynamic sign. • When a new information system is installed, additional static information signs
should be installed before the system in order to enhance driver alertness.
Driver comprehension of 20 different VMS designs for congestion was tested in driving simulator experiments in the United Kingdom (Richards et al., 2004).
Figure 5.2 Example of VMS design for congestion used in driving simulator experiments in the United Kingdom. Richards et al., 2004.
The comprehension was measured by asking the drivers to answer one question for each sign concerning the congestion message. While driving, some of the drivers were
questioned in advance of observing the sign, and some of them were questioned after having observed the VMS. “Which was the quickest route?” and “What was the journey time on the M42/M5 route?” are examples of those questions. For some of the drivers, the viewing time was four seconds for each sign, and for some it was six seconds. Afterwards, they were also asked to fill in a questionnaire on basic facts like age, gender, mileage and driving experience, but also on how they experienced the different VMS designs. Additionally, there was a map-reading task, which had the aim of rating the subjects to be either good or bad at map-reading. The significant results (p>0.05) were the following:
• The drivers with only four seconds of viewing time for each sign experienced less problems with the VMS than drivers with six seconds of viewing time. • The drivers who were given the question before having observed the VMS gave
a correct answer to the question asked during driving to a higher extent, they found the VMS to be more useful and experienced less problems with the VMS than drivers being questioned after having observed the VMS.
• Drivers of age 35 years or younger gave a correct answer to the question asked during driving to a higher extent, they found the VMS to be more useful, but also experienced a lower understanding of the VMS than drivers older than 35 years.
• Drivers with mileage less than 6000 km/year gave a correct answer to the
question asked during driving to a higher extent, they found the VMS to be more useful and experienced less problems with the VMS than drivers with mileage more than 6000 km/year.
• Persons with driving experience 5 years or less gave a correct answer to the question asked during driving to a higher extent, they found the VMS to be more useful, but also experienced a lower understanding of the VMS than persons with driving experience of more than 5 years.
• Men correctly answered the question asked during driving to a higher extent than women.
• Drivers with good map-reading ability gave a correct answer to the question asked during driving to a higher extent, and they experienced a higher understanding of the VMS than drivers with bad map-reading ability.
Some conclusions connected to the design of the signs were made: • Three lines of text were harder to understand than two lines.
• A majority of the subjects (about 75 %) preferred non-flashing signs to flashing signs of the same design.
• Colour-coding led to interpreting problems – about 75 % thought that green colour indicated the quickest route while the other 25 % thought it meant the route was free-flowing. Also there was a problem when subjects thought a black arrow implied that the route was closed.
• There was confusion whether the journey time displayed was calculated from the location of the sign or from the decision-point of the route to the destination. A study on comprehension of VMS reported by Luoma et al. (2001) was carried out in Finland, England and Italy. The problems investigated were:
• How do drivers understand factors that influence the control of VMS? • How do drivers interpret flashing displays and amber lanterns on the display
compared to a steady display?
• How do drivers interpret different speed displays?
From each country previously mentioned, 32 subjects were chosen. All the participants were 25 to 35 years old and had a driver’s license. It was concluded that gender and driving experience did not influence the results, but country did. For instance, the Finnish subjects thought it more likely that the signs were switched on according to information by sensors, while in Italy it was more often thought that the police had control of the signs. In England, the most common answer was that they did not know what controlled the VMS. For flashing displays and amber lanterns, the answers were different for different messages. For the fog message, for example, roughly one third of the English subjects tended to recognize the two signs as more conspicuous than the steady sign, while Finnish and Italian subjects assumed flashing displays or amber lanterns to either indicate a stronger warning or to have no added meaning. An example of different interpretations is the “keep your distance” sign. Some Finnish subjects thought that the flashing sign meant that the drivers’ own headway was too short, while others thought that there had been an incident. Some Italian subjects found the flashing sign distracting, as some thought the amber lanterns indicated police control. The speed display with a red circle was most often thought to be a restriction sign in all three countries. Almost all Finnish and Italian and slightly more than half of the English subjects interpreted the sign as a restriction or instruction. Using amber lanterns seemed to make drivers more likely to interpret the sign as a warning sign. The signs with a white circle or no circle were more likely to be considered information than restriction. The authors found that there is a need for harmonisation of speed limit displays in Europe.
Figure 5.3 Examples of different speed limit signs: without circle, with red circle, and with amber lanterns, respectively. Luoma et al., 2001.
In Sweden, a message understanding test was carried out as reported by Samuelsson (1999). The subjects were told to push a button when they had read the message presented on a computer screen. For each message, they were asked to answer three questions: 1) whether they were certain about the meaning of the message, 2) how they thought the road scene was where the message would be stated and 3) what
consequences they thought the message would have on their driving. As a result of this investigation, Samuelsson recommends that the message should be shorter than four words to shorten reading times. There is a conflict between clarity and reading time of the message, which leads to the recommendation that it is better to make sure that the message is read, i.e. a short message, than knowing the exact cause of the message. From the study it can be concluded that the risk of uncertainty is larger when passing a message that the driver did not have time to read, compared to passing a short message that does not specify what has happened. As an example it is better to know that the road is slippery, than to know why it is.
In the Netherlands, a legibility study was carried out in connection to the future introduction of a red circle on speed limit signs (Alferdinck, 2001a). In a field
experiment four types of variable message signs were tested on the speed limits 50, 70, 80, 90, 100 and 120 km/h. The subjects were told to approach the VMS until they could read them clearly and doubtlessly. It was concluded that the old sign, without a red ring, had the largest legibility distance (158 m). A new type of sign with the red ring was second best (136 m), whereas both the old sign, supplemented with a red ring, and a matrix sign had a legibility distance of 111 m. Two explanations for the different results are that the font height varied and that the red ring had a negative influence. Using the old sign, the legibility distance was 29 % longer without the red ring than with it. The conclusion is though, that all legibility distances for the different signs were so large, that road-users are able to react adequately and in time to the message on the VMS. Tests in the United Kingdom, before a new motorway VMS design was established, have shown that given a certain font and capital height in a text message, a message including numerals has lower legibility (Cooper et al., 2004). Further investigations showed that the legibility of numerals could be increased by widening the spacing between them and by using different numeral fonts. Legibility was enhanced when difficult words were either shown in another format, for instance upper case letters, or for a difficult word alone, using a pictogram instead. Using wider letter spacing for the difficult words, the legibility distance increased for one of the words, “Toll”, whereas it decreased for the two other words, “Debris” and “Queue”, respectively. See Figure 5.4.
Figure 5.4 Signs for queue used in tests in the United Kingdom. Cooper et al., 2004.
Static bilingual signs have longer reading times than monolingual static signs. However, Jamson et al. (2001) report on a study that suggests that four-line bilingual VMS
consisting of two lines of text in each language do not differ that much from a two-line monolingual sign. The results were that it is likely that bilingual VMS on Welsh motorways do not result in significant safety reductions.
In 2004, Jamson published an article evaluating bilingual signs of different techniques. Sometimes the message was in English, sometimes in Welsh, and sometimes both in English and Welsh in various combinations. Reading times of the participants were measured according to these conditions. It was found that for bilingual messages with only two lines, one for each language, there was no reading time difference compared to one-line monolingual signs. However, for four-line bilingual messages the reading time was significantly increased. If the lines of the signs were grouped after language, not by content, the reading time was significantly faster. See Figure 5.5.
Figure 5.5 Two examples of four-line bilingual messages. Jamson, 2004.
When the dominant language was located on top of the sign, there was also an
improvement in reading time. In the laboratory situation it was possible to read the signs even faster if case (upper/lower) was used, and then if colour or a separation line
between the languages was used. Learning of a pattern or sequence was investigated and found to improve reading time for colour and language position. However, when there was a sudden change of the pattern, the reading time significantly increased. Four-line messages split over two signs led to a longer total reading time than a two-line message contained on a single sign. If the message was confusing, the reading time for each component increased by more than 50 %. The author of the article finds that future work should concentrate on incorporating the task of sign-reading into the driving task in real world, in order to evaluate various sign configurations.
The organisation WERD/DERD – Western European Road Directors and Deputies – is in favour of a common set of pictograms used in the European Countries (Stainforth, 2004). A non-language based means of displaying information would be preferable so drivers from different countries could understand them.
An interview study on the comprehension of pictograms was carried out in six countries throughout Europe and a total of 795 voluntary drivers were participating from England, Finland, France, Germany, Greece and the Netherlands (Luoma & Rämä, 2001). Their task was divided into three parts. First, they were shown one sign at a time and were
asked to tell the correct meaning of the sign as well as determining if it was a warning sign, an instruction sign or an informative sign. Second, they were asked to compare different signs with the same meaning and select the one they found the best. Third, they should choose between the best pictogram previously chosen and a corresponding text message. The results showed that gender, age and driving experience had no
significant effect on interpreting the sign, whereas country had. This could be due to the fact that in some countries variable message signs with pictograms are more common. Almost all drivers understood that the red triangle meant “warning”. Therefore, it is concluded that use of the red triangle should be harmonised throughout Europe. Some conclusions concerning the different signs tested were as follows: None of the tested pictograms for fog message is recommended because of bad comprehension and frequent clear misunderstandings. (See Figure 5.6.) Each accident pictogram could be used and the recommended one is a pictogram with a car turned upside down in side view, which was preferred by 70 % of the participants. For queue messages, a pictogram with two queues and a red triangle is most recommended, although a pictogram with a single queue (suggested by the Vienna Convention) also performed well. In the choice between a pictogram with a car and wavy lines and a pictogram with an ice crystal, both warning for slippery road, the first sign was preferred by almost all of the drivers and more than 90 % interpreted the sign correctly. None of the tested signs for oncoming vehicle, restricted lane for buses and restricted lane for HOV (high-occupancy vehicles) could be recommended for use because of low
comprehension and frequent misinterpretations. Diversion signs showing an arrow or an arrow with the road number on it are both recommended, although the exact meaning of the pictogram cannot be considered to be known to the drivers.
Figure 5.6 Example of pictograms in the interview study on comprehension. The pictograms in the figure show fog warning messages, but were not recommended because of bad comprehension and frequent clear misunderstandings. Luoma & Rämä, 2001.
The compliance of traffic diversion on VMS has been investigated in London by
Chatterjee et al. (2002). Questionnaires were given to the participants to study the effect different messages would have on the choice of route. Through logistic statistical models the probability of route diversion was related to driver, journey and message characteristics. When the actual responses to activation of diversion messages were studied, only 1/3 of the drivers even saw the information. Only 1/5 of the number of drivers that were expected to make a route change according to the stated intention questionnaire, diverted in reality. When the same study was carried out in another English city where a VMS system was newly installed, the results corresponded better to the expected results. One conclusion from the investigation was that when warnings of future disruption were displayed, the effectiveness may be reduced for more urgent warnings.
In a literature study by Helmers et al. (2004), older drivers’ experience of variable message signs (amongst other things) has been investigated. It was found (Garvey & Mace, 1996) that especially older drivers were favoured by VMS with a positive contrast, i.e. bright symbols on a dark background. In another trial (Upchurch et al., 1992) it was observed that if the sun was behind the sign, older drivers often had difficulties with sun in their eyes. This was particularly true for the fibre-optic signs. Additionally, older drivers had larger problems with the sun behind their back when it was reflected in the sign, especially for the electromechanical signs. In darkness they had difficulties with glare from LED signs and compared to younger persons they experienced twice as much discomfort.
In the United Kingdom, investigations of safety and effectiveness of variable message signs have been carried out (Cooper & Mitchell, 2002). Information recall was greater when more key elements appeared in a message, but when further information was added to the message, the recall was reduced and the later information was recalled least well. The subjects could recall a higher amount of information if there was more
information on the VMS, but the proportion of the recalled message was less. It was found that information overload could occur when too much information is presented on a single line of a VMS. Furthermore, when several signs prevail at the same location, or when a succession of signs and signals are posted after each other, especially at critical locations such as junctions, information overload occurred. In a simulation experiment, VMS and advance direction signs (ADS) were combined in eight different
sign-sequence combinations and the decision time and accuracy of route choice for a given target was measured. There was no significant difference between a blank VMS and a non-traffic VMS regarding neither accuracy of route choice or decision time. Strategic and tactical messages mounted on a gantry led to increased response times and when a strategic message was posted the extra time is equivalent to adding two or three extra destinations to the fixed sign. Mounting VMS and ADS on the same gantry led to most errors for final decisions, while sequences with two VMS in addition to the ADS, mounted on separate structures, performed best. It could also be stated that incorrect responses were greater for VMS displaying contradictory messages.
A field study on the recall of signs was carried out on Finnish main roads by Schirokoff & Luoma (2005). There were fixed danger warning signs on a main road with a variable speed limit system and, also, especially warnings together with the message “traffic investigation” on variable message signs. Additionally, there was a warning sign for bicycle traffic either 50 or 150 m behind the VMS. See Figure 5.7.
Figure 5.7 Signs used in the field study on the recall of signs. Schirokoff & Luoma, 2005.
The control site was a main road with fixed speed limit. 1050 road side interviews were carried out with the result that on the average 6-28 % of the drivers recalled the warning sign correctly. Variable speed limits did not have any effect on the recall of fixed signs,
neither had the distance between the signs. On the test site, 73 % of the interviewee could recall the speed limit, to be compared with 63 % on the control site.
Hautala et al. (2002) report on a study where the effects of variable speed limits, sometimes in combination with explaining text or pictogram, were investigated on the E18. A before-and-after study was carried out on traffic flow effects. It was found that 86 % of the interviewed drivers recalled the speed limit on the VMS. The combination of the symbol “slippery road” and the text “AQUAPLANING” was only recalled by 41 % of the drivers 10 km after passing the sign. This is believed to be due to the long distance from the sign to the interview location. See Figure 5.8.
Figure 5.8 VMS used in the Finnish study on effects of variable speed limits. Hautala et al., 2002.
Dutta et al. (2004) report about a driver simulator study carried out in the USA.
Variable message signs with text messages presented on two consecutive screens were used and the driver behaviour was studied. The message either was or was not repeated, before it was turned off. If it was repeated, the presentation time of the message was 0,5 s per word, and if it was not repeated, the presentation time was 1 s per word. Sometimes there was an obstruction leading to out-of-phase message and sometimes not. The participants in the study were told to drive the simulator for 24 trips through underground tunnels, where each tunnel consisted of a five lane roadway. The driver task was to follow the given information to a specific destination. The results show that the miss rate was significantly higher when there was no repetition, compared to when there was a single repetition of the message. The only situation when the difference was not significant was when there was no obstruction present. When looking at lane change distances, drivers changed lanes later when there was no repetition compared to when there was a repetition. When there was no obstruction, drivers changed lanes later than when there was an obstruction (significant). It was also noted that the sequencing of the messages had an impact of the driver performance when it comes to lane change
distances. It was revealed that the lane change distance was shorter for out-of-sequence messages than it was for in-sequence messages. This was thought to be because of the nature of the message in the second phase, for instance “2 RT LANES CLOSED”.
6 Accidents
Rämä et al. (2003) report on a study on the traffic safety effects of weather controlled speed limits. Additionally, the variable speed limit systems on public roads in Finland were described. In the analysis, the injury accident risk before and after the
implementation of variable speed limits was compared. Similar types of roads, but with fixed speed limits, were used as control stretches. The period studied was from the summer 1990 to the winter season 2001-2002. The evaluation was made on eight two-lane road sections, where the length of the equipped sections varied between 8 and 41 km. Based on sign technology, degree of automation and use of variable warning signs, the different VMS systems were divided into two groups, containing four VMS systems each. Although the results were not significant, it seemed that speed limit systems with fibre optic or LED signs, with control based on automatic classification of road condition situations and which include variable slippery warning signs, reduced the injury accident risk by 13 % in the winter and by 2 % in the summer. This can be
compared to the other group, where the signs were electromechanical, no automatic classification system for the control of the speed limits was used, and no variable warning sign was included. In this group, the injury risk seemed to increase by 8 % in the winter and by 21 % in the summer. The study led to the conclusion that in the future, continued data collection should be made to get significant results.
A system tested in northern England for educating drivers to drive slower, is described by Barnard & Cutler (2005). By combining signs with cameras, speeding vehicles are registered, and variable message signs are activated advising the driver to slow down. The cameras capture the license plate of the vehicle together with information about speed, time and date. The driver then is sent a letter suggesting him or her to slow down. The aim of the system is to educate the drivers rather than catching them and to reduce speeds on a longer stretch of the road network and not only at some exposed areas. Casualties have been reduced by 30 % and the number of collisions by 48 % in the eight areas in which it has been tested.
A large test on vehicle-activated signs was carried out in England (Winnett & Wheeler, 2002). Signs for mandatory speed limit, warning signs for bends and junctions, and safety camera repeater signs were lit up for speeding vehicles. Accidents were significantly reduced by one-third across all of the sites at one of the four locations tested. The safety camera signs had almost no effect on accidents compared to safety cameras alone. Overall, the authors conclude that a substantial accident reduction was accomplished through the use of VAS.
7 Message
Data
Bases
Some countries have message data bases used for harmonising the messages on VMS. The action FIVE (Framework for Harmonised Implementation of VMS in Europe), defines three message categories (Statens vegvesen, 2004):
• Regulating/controlling messages • Warning messages
• Informative messages.
Any inventory of the message data bases in Europe has, however, not been carried out in this literature study but could be an object for future work.
8
Regulations, Recommendations and Use of VMS
Some of the areas in which variable message signs, in the form of dynamic traffic information signs, can be used are described by Balz (2003):
• Completing substitutive signs for route guidance constructions for changing driving lanes.
• Using it as an alternative to classic signs for route guidance constructions for changing driving lanes.
• Supporting individual drivers to change to public transport.
• Supporting road stretch specific information on for instance problem areas. • Preventive traffic information concerning for example working zones, inclining
the drivers to adapt their traffic conditions.
Some areas for harmonisation are also given by Balz (2003):
• Easy-to-understand symbols and pictograms should be used to an as large extent as possible.
• Words internationally understood should be preferred to national notions. • The information should be presented in the same structure concerning type,
position and sequence.
• The information should consist of maximum four information units, where one information unit is a sequence of symbols and words related to each other and which make a connection.
Criticism to influencing the traffic by variable traffic information signs is (Balz, 2003): • Security risk through information overload of the road-users.
• Deviation from the philosophy of traffic influencing, leading to road-user overload.
• Risk of use for other purposes than traffic.
• Until now (2003), there is no general valid legislation.
• Information is also given through radio and navigation systems in the car, which means that road located informative signs could be contradictory.
8.1
The Nordic Countries
A status report for 1999 on transport informatics in the Nordic Countries was published in 2000 (Nordiska Vägtekniska Förbundet). One of the applications that was considered important for the function of the transport system in the future, was variable message signs.
In Sweden, variable message signs are controlled in different ways in different road administration regions throughout the country (Transek AB, 2006). Transek has accomplished a study on the use of VMS in the Swedish Road Administration