Study the performance limits of IEEE 802.11 WLANs
49
0
0
Full text
(2) Study the Performance Limits of IEEE 802.11 Wirelesses LANs. Master of Science in Computer Science and Engineering. Mohammad-Reza Akhavan. Supervisor: Dr. Kaustubh S. Phanse Department of Computer Science and Electrical Engineering Luleå University of Technology, Sweden May 31, 2006.
(3) Abstract While it is commonly understood that 802.11a / 802.11g as 54Mbps WLANs; and 802.11b as 11Mbps WLAN, the actual achievable throughput for these standards is much lower. This thesis is focused on the evaluation of the theoretical performance of IEEE 802.11a/b/g wireless technologies. By using the exact formulas, the theoretical maximum throughput for different MSDU sizes, MAC schemes and spectrum technologies under ideal conditions is calculated. The results demonstrate that RTS/CTS scheme has considerable impact on the throughput and bandwidth efficiency of the various IEEE 802.11 systems. In addition, CTS-to-self and RTS/CTS legacy protection mechanisms influence the throughput of 802.11b and 802.11g in hybrid b/g mode. For realistic channel conditions in harsh environments that pose a challenge to the performance of the IEEE 802.11 wireless networks, the experimental measurements are obtained from a group of students in sms048 course. They made the measurements from operating an 802.11g based wireless network in the LKAB underground iron ore mine in Sweden. By comparing experimental data with theoretical calculations, the path loss exponent for in the mine has been estimated.. i.
(4) To those from whom I learned, and To those I love.. ii.
(5) Table of Contents. Abstract........................................................................................................................................ i List of Figures ............................................................................................................................ v List of Tables ............................................................................................................................vii 1 Thesis Introduction ................................................................................................................ 1 1.1 Wireless Networks ............................................................................................................ 1 1.2 Motivation for Study the Performance Limits ................................................................ 1 1.3 Outline of the Thesis ......................................................................................................... 2 1.4 Abbreviations .................................................................................................................... 3 2 IEEE 802.11 Wireless Networks .......................................................................................... 4 2.1 Introduction ....................................................................................................................... 4 2.2 IEEE 802.11 Architecture ................................................................................................ 4 2.3 Medium Access................................................................................................................. 5 2.4 IEEE 802.11 sublayers...................................................................................................... 6 2.5 Frame Formats .................................................................................................................. 6 2.5.1 Data Frames............................................................................................................ 6 2.5.2 Control Frames ....................................................................................................... 7 2.6 Hidden Terminal Problem ................................................................................................ 8 2.6.1 Request to send (RTS/CTS) Mechanism................................................................. 9 2.7 IEEE 802.11b/g mode....................................................................................................... 9 2.7.1 Protection Mechanisms........................................................................................... 9. iii.
(6) 3 Throughput and Delay Calculations .................................................................................11 3.1 Introduction ..................................................................................................................... 11 3.1.1 Delay...................................................................................................................... 11 3.1.2 Throughput ............................................................................................................ 12 3.2 IEEE 802.11b Throughput and Channel Efficiency ..................................................... 13 3.2.1 IEEE 802.11b Frame Format............................................................................... 13 3.2.2 Effect of Packet Size and Data Rate..................................................................... 14 3.2.3 Effect of RTS/CTS.................................................................................................. 16 3.3 IEEE 802.11a Throughput and Channel Efficiency ..................................................... 18 3.3.1 IEEE 802.11a Frame Format............................................................................... 18 3.3.2 Effect of Packet Size and Data Rate..................................................................... 19 3.3.3 Effect of RTS/CTS.................................................................................................. 21 3.4 IEEE 802.11g Throughput and Channel Efficiency ..................................................... 23 3.4.1 IEEE 802.11g Frame Format............................................................................... 23 3.4.2 Effect of Packet Size and Data Rate..................................................................... 23 3.4.3 Effect of RTS/CTS.................................................................................................. 25 3.5 Hybrid 802.11b and 802.11g Throughput and Channel Efficiency............................. 27 3.5.1 Effect of CTS-to-self protection............................................................................ 27 3.5.2 Effect of RTS/CTS protection................................................................................ 29 3.5.3 Effect of an active 802.11b station....................................................................... 32 4. Study free space path loss of 802.11g...............................................................................34 4.1 Introduction ..................................................................................................................... 34 4.2 Free Space Path Loss ...................................................................................................... 34 4.3 Cross-validation of theoretical and experimental performance of 802.11g ................ 34 6 Conclusions............................................................................................................................37 6.1 Results.............................................................................................................................. 37 6.2 Future works.................................................................................................................... 37 7 References..............................................................................................................................38. iv.
(7) List of Figures. Figure 2.1: IEEE 802.11 WLAN architecture........................................................................... 5 Figure 2.2: Timing diagram of successful data transmission for CSMA/CA.......................... 5 Figure 2.3: Overhead at different sublayers of the IEEE 802.11 ............................................ 6 Figure 2.4: The IEEE 802.11 Frame Format............................................................................ 7 Figure 2.5: RTS Frame Format.................................................................................................. 7 Figure 2.6: CTS Frame Format ................................................................................................. 8 Figure 2.7: ACK Frame Format ................................................................................................ 8 Figure 2.8: Hidden Terminal Problem ...................................................................................... 8 Figure 2.9: Timing diagram of successful data transmission for RTS/CTS............................ 9 Figure 2.10: Basic overview of CTS-to-self protection mechanism....................................... 10 Figure 2.11: Basic overview of RTS/CTS protection mechanism .......................................... 10 Figure 3.1: IEEE 802.11b Frame Format............................................................................... 13 Figure 3.2: Max. MAC Throughput of 802.11b ...................................................................... 15 Figure 3.3: BW efficiency of 802.11b ...................................................................................... 16 Figure 3.4: Max. MAC Throughput of 802.11b - RTS/CTS.................................................... 17 Figure 3.5: BW efficiency of 802.11b - RTS/CTS.................................................................... 18 Figure 3.6: IEEE 802.11a Frame Format............................................................................... 18 Figure 3.7: Max. MAC Throughput of 802.11a ...................................................................... 20 Figure 3.8: BW efficiency of 802.11a ...................................................................................... 21 Figure 3.9: Max. MAC Throughput of 802.11a - RTS/CTS.................................................... 22 Figure 3.10: BW efficiency of 802.11a - RTS/CTS ................................................................. 22 Figure 3.11: IEEE 802.11g (ERP-OFDM PLCP) Frame Format......................................... 23. v.
(8) Figure 3.12: Max. MAC Throughput of 802.11g, g-only mode ............................................. 24 Figure 3.13: BW efficiency of 802.11g, g-only mode ............................................................. 25 Figure 3.14: Max. MAC Throughput of 802.11g, RTS/CTS................................................... 26 Figure 3.15: BW efficiency of 802.11g, RTS/CTS................................................................... 26 Figure 3.16: IEEE 802.11g (ERP PLCP ) Frame Format - Long Preamble ........................ 27 Figure 3.17: Max. MAC Throughput of 802.11g - CTS-to-self protection............................ 28 Figure 3.18: BW efficiency of 802.11g - CTS-to-self protection............................................ 29 Figure 3.19: Max. MAC Throughput of 802.11g - RTS/CTS protection ............................... 30 Figure 3.20: Max. MAC Throughput of 802.11g,CTS-to-self and RTS/CTS protections.... 31 Figure 3.21: BW efficiency of 802.11g - RTS/CTS protection ............................................... 31 Figure 3.22: Effect of an active 802.11b station on the throughput of 802.11g and 802.11b in b/g mixed mode...................................................................................................................... 33 Figure 4.1: SNR as a function of distance from AP in mine................................................... 35 Figure 4.2: Free Space Pass Loss of IEEE 802.11g............................................................... 36. vi.
(9) List of Tables. Table 2.1: IEEE 802.11 Standards characteristics................................................................... 4 Table 3.1: IEEE 802.11b Parameters...................................................................................... 14 Table 3.2: Transmission time for the payload and MMT parameters for IEEE 802.11b..... 14 Table 3.3: Transmission time for the payload and MMT parameters for IEEE 802.11b RTS/CTS..................................................................................................................................... 17 Table 3.4: Data Rate – T NDBPS mapping.................................................................................. 19 Table 3.5: IEEE 802.11a Parameters...................................................................................... 19 Table 3.6: Transmission time for the payload and MMT parameters for IEEE 802.11a..... 20 Table 3.7: Transmission time for the payload and MMT parameters for IEEE 802.11a RTS/CTS..................................................................................................................................... 21 Table 3.8: IEEE 802.11g Parameters..................................................................................... 23 Table 3.9: Transmission time for the payload and MMT parameters for IEEE 802.11g..... 24 Table 3.10: Transmission time for the payload and MMT parameters for IEEE 802.11g – RTS/CTS..................................................................................................................................... 25 Table 3.11: IEEE 802.11g and CTS-to-self Protection Parameters...................................... 27 Table 3.12: Transmission time for the payload and MMT parameters for IEEE 802.11g with CTS-to-self protection....................................................................................................... 28 Table 3.13: Transmission time for the payload and MMT parameters for IEEE 802.11g with RTS/CTS protection........................................................................................................... 30 Table 3.14: Max. MAC Throughput parameters of IEEE 802.11g and IEEE 802.11b in b/g mixed mode................................................................................................................................ 32. vii.
(10) 1 Thesis Introduction 1.1 Wireless Networks Wireless Networks, by eliminating the wires used in network components, increase the mobility and provide access to the data networks in a user-friendly manner. Today’s wireless networks are deployed in home, office, restaurants, airports, university camps, streets and are known as one of the main access technologies to the Internet. While writing this thesis, a news agency reported that a BT project aims to fix tin can-sized antennas to streetlights, bus stops, phone boxes and park benches to make the wireless net access available across broad swathes of the 12 cities in the UK [25]. Internet Service Providers (ISPs), realising significant cost savings that wireless links offer when compared to classical access techniques (cable and xDSL), embraced the technology as an alternative providing broadband Internet access [6]. The 802.11 technology is accepted as a dominant wireless solution. The popularity of 802.11-based WLAN is due to some characteristics such as low cost, high-speed data rate and easy deployment. The scope of this study is limited to the IEEE 802.11a/b/g standards [1-3]. The initial IEEE 802.11 standard [4] and the HiperLAN1/2 standards will not be discussed.. 1.2 Motivation for Study the Performance Limits One of the challenges in today’s wireless networks is to provide appropriate throughput for dramatically growing demand from the side of the applications. Performance limit of a wireless network in terms of a maximum theoretical throughput is a key issue in network management and control traffic tasks. Banchs et al. [21] and Radimirsch et al. [22] proposed some protocols for throughput guarantee in wireless networks. These protocols are in need of the knowledge of maximum throughput to determine the bandwidth allocation. Bandwidth efficiency is important since the overall bandwidth is limited. Although it may use for low cost data transmission, its major role is to minimize the delay for voice and video applications because it can provide a clue to design jitter tolerant applications. An optimal WLAN should promise an appropriate throughput for data and multimedia applications, contrary to the common belief that considers a WLAN with vast coverage area as an efficient WLAN. Interestingly, by using two APs in close distance from each other, the overall throughput will significantly decrease due to unnecessarily hand-offs [23][24]. It is good to remember the sum of the throughputs cannot exceed the Theoretical Maximum Throughput of the network. Many papers have studied the performance of 802.11 WLALs by using simulation [35]. Markov chains approach [15] [19] [32], models the complex behaviour of 802.11 better, but usually gives complex results or requires numerical resolution [34]. This thesis, by using. 1.
(11) simple calculation methods, presents clear results to analyse the impact of different factors on throughput of different versions of 802.11 in different scenarios. It examines the challenges involved in throughput performance of the 802.11-based networks. These include various slot-times, CTS-to-self and Request-to-Send/Clear-to-Send (RTS/CTS) protection mechanisms for 802.11b/g mixed mode.. 1.3 Outline of the Thesis The thesis is organized as follows: Chapter 1 gives a short overview over the thesis introduction, the motivation and abbreviations. You have probably already read some part of it. Chapter 2 provides the background information for the next chapter. A brief introduction to the IEEE 802.11 architecture and sublayers and the shared medium access control protocol, which is used in 802.11 wireless technologies, are included in this section. It is followed by more detailed explanations of frame formats that are standardized for 802.11 and in the end, it describes hidden terminal problem and RTS/CTS mechanism. Chapter 3 is the main part of the thesis that examines the throughput of the IEEE 802.11 wireless LAN standards in different scenarios and in some depth, it will say a few words about Bandwidth efficiency. Chapters 4 and 5 will address channel model and channel noise issues with a crossvalidation of theoretical and experimental performance of 802.11g. Finally, the conclusion will be given in chapter 6.. 2.
(12) 1.4 Abbreviations. ACK AP BER BPSK BSS CRS CSMA/CA CTS CW DCF DIFS DS DSSS ERP ESS FCS HIPERLAN HR-DSSS IEEE IR LAN LLC MAC MMT MSDU NAV OFDM PCF PDU PHY PLCP PMD QAM QoS QPSK RF RTS SDU SIFS SNR TCP UDP WAN WiFi. acknowledgment (packet) access point bit error rate binary phase shift keying basic service set cyclic redundancy check carrier-sense multiple access/collision avoidance clear to send (packet) contention window size distributed coordination function distributed inter-frame space direct sequence direct-sequence spread spectrum extended-rate PHY extended service set frame check sequence high-performance radio LAN high rate DSSS Institute of Electrical and Electronics Engineers infrared local area network logical link layer medium access control theoretical maximum MAC throughput MAC service data unit network allocation vector orthogonal frequency division multiplexing point coordination function protocol data unit physical layer physical layer convergence protocol physical medium dependent quadrature amplitude modulation quality of service quadrature phase shift keying radio frequency request to send (packet) service data unit short inter-frame space signal-to-noise ratio transmission control protocol user datagram protocol wide area network wireless fidelity. 3.
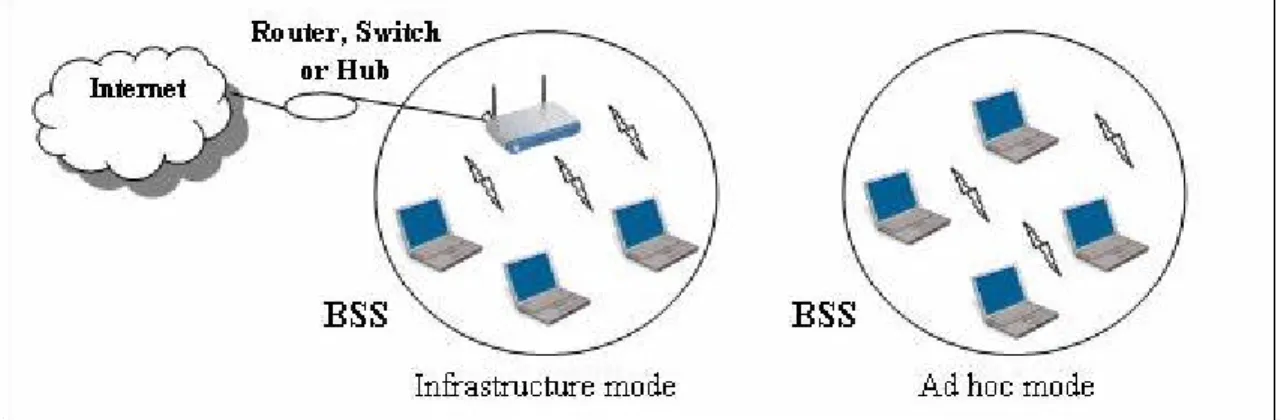
(13) 2 IEEE 802.11 Wireless Networks. 2.1 Introduction IEEE 802.11 technology is mostly deployed for WLAN application. The IEEE 802.11 wireless LAN, also known as WiFi [5], has been classified into several standards including 802.11b, 802.11a, and 802.11g. The 802.11b and 802.11g are working in the 2.4 GHz Industrial-Scientific-Medical (ISM) band. The 802.11a operates at 5 GHz Unlicensed National Information Infrastructure U-NII/ISM bands in the US, and license-free 5 GHz bands elsewhere. Unlicensed frequency band of 2.4 - 2.485 GHz is an increasingly cluttered zone with interferences from microwave ovens, cordless phones, wireless cameras, Bluetooth and other RF solutions. The 802.11g WLAN has a data rate up to 54 Mbps like 802.11a but in lower frequency. Although 802.11a version enjoys more available channel for frequency, it suffers from multi-path propagation. In other words, with a certain power level, 802.11a has a shorter transmission distance, in comparison to 802.11g. Table 2.1 summarizes the key characteristics of these standards.. Standard Frequency Range. 802.11b 2.4 – 2.485 GHz. Data Rate. 1, 2, 5.5, 11. 802.11a 5.1 – 5.8 GHz 6, 9, 12, 18, 24, 36, 48, 54. 802.11g 2.4 – 2.485 GHz 1, 2, 5.5, 11, 6, 9, 12, 18, 24, 36, 48, 54. Table 2.1: IEEE 802.11 Standards characteristics. Beside the differences at physical layer, it must be pointed out that all three standards use the same media access protocol known as CSMA/CA. The three standards use link adaptation strategy to improve the system throughput by adapting the transmission rate for longer distances. All three versions have the capability of operating in both “infrastructure” and “ad-hoc mode”.. 2.2 IEEE 802.11 Architecture Figure 2.1 shows the principal components of a typical architecture in which users have access to a wired network and services on the network over an IEEE 802.11 wireless LAN. One or more wireless nodes along the central node, Access Point (AP), make a Basic Service Set (BSS). A BSS can have an AP (infrastructure mode), or run without AP (ad hoc mode). Most often wireless nodes in infrastructure are connected to wired backbones. An ad hoc network is a network with no central control and no connections to the Internet.. 4.
(14) Figure 2.1: IEEE 802.11 WLAN architecture. 2.3 Medium Access Once a wireless station is associated with an Access Point (AP), it can start sending and receiving data to other wireless stations. If multiple stations attempt to transmit data at the same time on the same channel, a protocol is needed to coordinate the transmissions and prevent collision. The appropriate protocol in 802.11 wireless networks for this purpose is Carrier Sense Multiple Access with Collision Avoidance (CSMA/CA). According to the automatic medium sharing, before a station starts transmission, it senses the channel to determine if it is idle or not. Figure 2.2 illustrates the data frame exchange sequence. If the channel appears to be idle; the station transmits its data frame after a short period of time known as the Distributed Inter-Frame Space (DIFS); else, the station chooses a random Backoff value and counts down this value while the channel sensed idle. When the medium sensed busy, the counter value remains frozen. When the counter reaches zero (in this case the medium is sensed idle), the station will start to send its data frame and wait for an acknowledgment. Short Inter-Frame Spacing (SIFS), which is smaller than DIFS, is the time interval between reception of the data frame and transmission of its ACK frame by destination station. If the acknowledgment is received, the source station will assume that its data frame has been correctly received at the destination station.. Figure 2.2: Timing diagram of successful data transmission for CSMA/CA. 5.
(15) 2.4 IEEE 802.11 sublayers In this section, we will take a close look at different sublayer of 802.11. The IEEE 802.11 protocol defines MAC layer (the lower part of the Data-Link layer), and Physical layer (layer 1 on the OSI reference model [12]). The physical layer itself consists of two separate components. The Physical Layer Convergence Procedure (PLCP) performs some additional PHY-dependent framing before transmission, while the Physical Medium Dependent (PMD) layer is responsible for the actual transmission of frames [26]. A service data unit (SDU) is defined as the payload that that layer and protocol data unit (PDU) is the sum of the SDU and the layer overhead. Figure 2.3 shows the type of overheads added at different sublayers when an MSDU is transmitted through an 802.11 interface. [6]. Figure 2.3: Overhead at different sublayers of the IEEE 802.11. 2.5 Frame Formats This section presents the basic frame structure in two separate subsections and provides general information of data and control frames. More detailed information can be obtained from [25]. 2.5.1 Data Frames Figure 2.4 illustrates the basic format of IEEE 802.11 packets passed to PHY layer from MAC layer with the following components: Frame Control: Frame control including many subfields may affect the interpretation of other fields in the MAC header. For instance, some bits used to distinguish the association, RTS, CTS, ACK and data frames. Duration: It contains the value of NAV and represents the time period in which medium will not be free. (NAV is a timer that indicates the amount of time the medium will be reserved, in milliseconds) Address Fields: Address1 is used for MAC address of the receiver, Address2 is the MAC address of the transmitter, and Address 3 contains the MAC address of the router interface that connects BSS subnet to other subnets.. 6.
(16) Sequence Control: This field is used for discarding duplicate frames and for defragmentation. Payload: Payload or Data field moves the higher-layer payload from source to destination. CRS: Cyclic Redundancy Check (CRC) or Frame Check Sequence (FCS) allows stations to check the reliability of received frames.. Frame control (2B). Duration (2B). Address1 (6B). Address2 (6B). Address3 (6B). Seq. control (2B). Address4 (6B). Payload (02312B). CRC (4B). Figure 2.4: The IEEE 802.11 Frame Format. 2.5.2 Control Frames Control frames provide reliability functions of the data transmissions over MAC layer and administrator access to the wireless medium. Control frames are all header. No data transmitted in the body, and FCS follows the header. The impacts of control frames on the throughput of the different 802.11 standards will assess in Chapter 4. The most notably Control Frames are:. Request to Send (RTS) RTS frame is used to reserve the medium for the transmission of unicast frames. A control packet used by a station to indicate that it has data to send. MAC header. Frame Control (2B). Duration (2B). Receiver Address (6B). Transmitter Address (6B). FCS (4B). Figure 2.5: RTS Frame Format. Clear to Send (CTS) Initially, CTS frames were used as a response for RTS. In this case, it always follows the RTS. The new function of CTS frame is for protection purposes in 802.11b and 802.11g mixed mode. Protection mechanism will be discussed in section 2.7.1.. 7.
(17) MAC header. Frame Control (2B). Duration (2B). Received Address (6B). FCS (4B). Figure 2.6: CTS Frame Format. Acknowledgment (ACK) As the name suggests, it is used to send the positive acknowledgment required by the MAC.. MAC header. Frame Control (2B). Duration (2B). Received Address (6B). FCS (4B). Figure 2.7: ACK Frame Format. 2.6 Hidden Terminal Problem Figure 2.8 illustrates two examples that hidden terminal problem may occur. In b), hidden terminal occurred because stations B and C separated by obstacle while in a) they are out of the range of each other. Thus each one is hidden from the other although, neither is hidden from AP. The reason that defines hidden terminal as a problem is that since stations B and C are not aware of each other, they may assume that the medium is free and send their frames to the AP at the same time and resulting in a collision and consequently, channel will be wasted during B’s or C’s transmission period. The next section will address how IEEE 802.11 MAC protocol deals with hidden terminal problem.. a). C. b) B. AP. C B AP. Figure 2.8: Hidden Terminal Problem. 8.
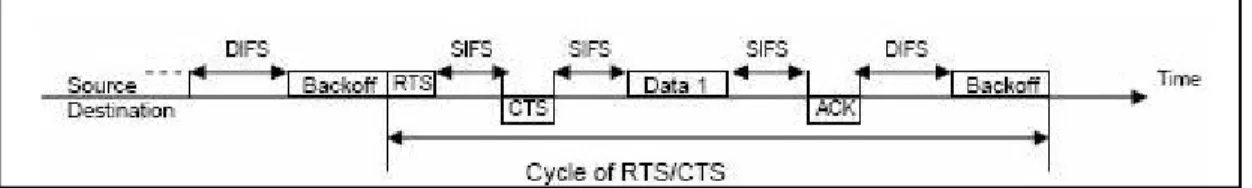
(18) 2.6.1 Request to send (RTS/CTS) Mechanism As AP can see both B and C stations, AP via RTS/CTS mechanism can coordinate the transmission of the hidden stations (B and C) to help avoiding concurrent transmission. The RTS/CTS mechanism function works in this way: When a station wants to send a frame, it should first send a short request to send (RTS) frame to AP, which will specify the total required time for data and its acknowledgment (ACK) frame. Then AP will broadcast a clear to send (CTS) frame to all the stations in its range. In fact, CTS frames reserve the access to the media to the sender and also inform other station how long the media will be busy. The Four-Way RTS/CTS handshake has been depicted in Figure 2.9.. Figure 2.9: Timing diagram of successful data transmission for RTS/CTS. 2.7 IEEE 802.11b/g mode This section begins with a discussion of coexistence of 802.11b and 802.11g stations in a WLAN. It will draw a distinction between the challenges posted in hybrid b/g mode and pure 802.11g mode. Making this important distinction, will allow us to better isolate, identify, and master the key concepts in throughput of an 802.11g network. Since the IEEE 802.11b is very prevalent, the backward compatibility is known as one of the most important characteristics of new standards. The 802.11g has higher data transmission than 802.11b and is comparable with 802.11a with its main characteristic, which is backwards compatibility, encourages wireless network engineers to choose 802.11g as their first choice. The 802.11b devices implement two different specifications: the original, slow direct sequence (DSSS) from the initial 802.11 standard and the high-rate complementary code keying (CCK) PHY. 802.11b and 802.11g stations must be able to hear not only the older stations but the other 802.11g stations [26]. To study the impact of an 802.11b user on the performance of a wireless network based on 802.11g, the first step should be examining the mechanisms that make this coexistence possible.. 2.7.1 Protection Mechanisms The modulation scheme of 802.11g is different from that of 802.11b. Therefore, 802.11g will be in need of a mechanism to solve the problem of correspondence with 802.11b. If an 802.11g station transmits a frame in the rate of 802.11b, e.g. not more than 11Mbps, it aims 9.
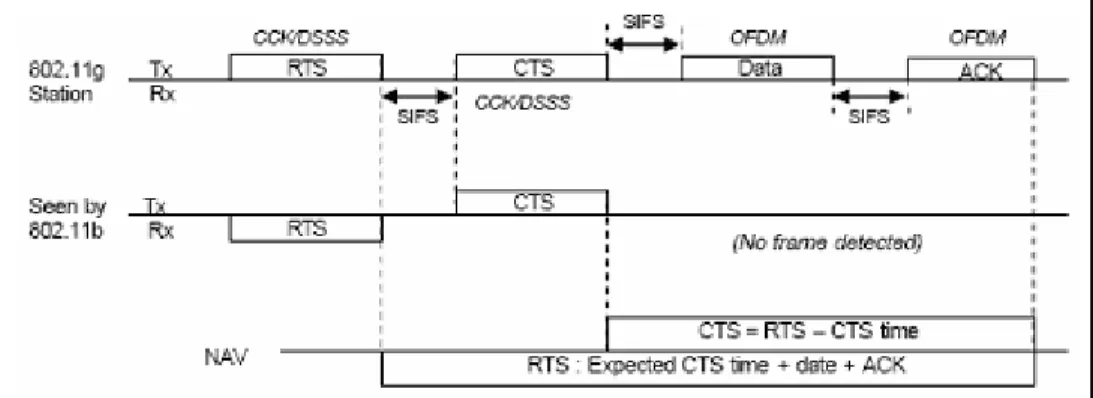
(19) to solve the big part of the problem. Based on this approach, an AP can send Beacon frames in lower data rates to provide support for 802.11b and 802.11g stations. A technique requires to coordinate the transmission of 802.11b and 802.11g stations over the shared medium. This technique is called Protection and as the name suggests, it protect 802.11b station from interference. Let’s investigate this scheme in the context of Figure 2.10 that depicts the CTS-to-self protection mechanism used in 802.11 b/g mixed mode. Since 802.11b is not able to receive and decode the OFDM frames, 802.11g station should send the CTS and RTS control frames in a slower rate to update the NAV. In fact, by means of protection mechanisms, 802.11b station will be aware of 802.11g station even when it is sending data and acknowledgment frames in OFDM. In the more common CTS-to-self protection, 802.11g station sends a CTS frame and set its own MAC address in the received address of the frame. Although the source and destination of the CTS frame is the same station, all other stations in the BSS will update the NAV and will stop sending packet in expected OFDM frames (data and its acknowledgment).. Figure 2.10: Basic overview of CTS-to-self protection mechanism. Figure 2.11: Basic overview of RTS/CTS protection mechanism The second protection type, RTS/CTS, is demonstrated in Figure 2.11. This protection type is more robust against hidden terminal. In section 3.5.2, the significant impact of this fourway protection method on the throughput of 802.11g would be investigated.. 10.
(20) 3 Throughput and Delay Calculations. 3.1 Introduction Different literatures used various different statistics in measuring the performance of wireless networks. In this section the aim is to purify some concepts related to the throughput as they will be used throughout this document.. 3.1.1 Delay The term delay in this document will used to describe this concept: The time spent while a packet travels from one node to another. It is the sum of the different inter-frame spaces, back off time and transmission time of all control frames. However, care must be used in the use of the term since it is not always clear whether delay refers to the concept above, or the round trip time RTT of a network which is the time required sending a packet and receiving an acknowledgment, or some other delays. Delay typically is measured in microseconds. Notations are defined as follows and will be used throughout this thesis:. TSLOT TSIFS TDIFS CWMIN TPr eamble L ACK T ACK LDATA TDATA LRTS TRTS LCTS TCTS T NDBPS T EX TPLCPheader TSYM η. slot time in µs SIFS time in µs DIFS time in µs Minimum contention window size in slot time Transmission time of the physical preamble in µs ACK size in bytes, i.e., 14 bytes ACK transmission time in µs Payload size in bytes Transmission time for the payload in µs RTS size in bytes RTS transmission time in µs CTS size in bytes CTS transmission time in µs number of data bits per OFDM symbol signal extension in µs transmission time of PLCP header in µs Transmission time for a symbol in µs Bandwidth efficiency in percent. Recall from sections 2.3 and 2.6.1 that show the timing diagram of a successful packet transmission for different MAC schemes, the delay per MSDU can be calculated as below:. 11.
(21) Delay per MSDU (CSMA / CA cycle ) = (TDATA + TSIFS + TACK + TDIFS + TBO ) Delay per MSDU ( RTS / CTS cycle ) = (TRTS + TSIFS + TCTS + TSIFS + TDATA + TSIFS + T ACK + TDIFS + TBO ). (3.1). (3.2). Where. CWMIN × TSLOT 2 = 2 × TSLOT + TSIFS. TBO =. (3.3). TDIFS. (3.4). Some coefficients have been used to calculate the total delay as a function of MSDU size and for each scenario ‘a’ and ‘b’ can be obtained from equation (5).. Delay per MSDU = a × (MSDU size) + b. (3.5). 3.1.2 Throughput * Throughput refers to the amount of data (in bits) transferred successfully from one node to another in a specified amount of time. The objective is to calculate the maximum throughput of IEEE 802.11 technologies in the medium access control (MAC) layer for different parameters such as data rate, packet size. The maximum throughput in higher layers i.e. application layer, will be lower due to additional overhead at each layer. Overhead due to protocol headers and checksums are not included in the calculation of throughput as it is defined in this thesis. References [29-31] provide probabilistic approximations to calculate the throughput of a homogeneous 802.11 protocol. Several studies such as [15] and [32] have used Markov chain model for throughput of an 802.11 WLAN. For simplicity, the common assumptions have been made. No management frames like beacon, probe request/response and di/re/association frames have been taken into account. The condition is ideal thus; there is no retransmission of packet loss, interference or collision. Buffers in sender and receiver could not result in overflow or underflow since there are sufficient frames to be transferred continuously. The medium access method is distributed coordination function (DCF). Fragmentation is not used in MAC layer and the propagation delay is not considered.. * For the sake of completeness, some theoretical results which were already presented in other publications i.e. [6] have been repeated.. 12.
(22) From the above definition of throughput, it is now possible to express the throughput as a function of packet payload length. Throughput is typically quoted in megabits per second 20 (Mbps), where mega- is 10 6 (contrary to often use of 2 for data sizes in megabytes). Some manufacturers may also use packets or frames per second (pps / fps) to measure throughput.. Theoretical Maximum MAC Throughput of 802.11 in MAC layer =. MMTMAC =. Payload Delay. 8 × MSDU size × 10 6 bps (a × (MSDU size) + b). (3.6). 3.1.3 Channel Data Rate Data bandwidth or channel data rate is the maximum available data that can flow over a channel. Similar to throughput, channel data rate also have been measured in bits per second. Channel data rate, unlike throughput, is the theoretical maximum rate at which data including the protocol overhead and checksums can be transmitted if the protocol is fully efficient. Therefore the channel data rate of a network is always greater than the throughput. For example, later in this thesis, an IEEE 802.11g WLAN with 54 Mbps channel data rate have been measured to have throughput of 17 Mbps.. Bandwidth Efficiency Spectral efficiency or bandwidth efficiency is defined as the ratio of Theoretical Maximum MAC Throughput to channel bandwidth.. η=. MMTMAC BW. (3.7). 3.2 IEEE 802.11b Throughput and Channel Efficiency. 3.2.1 IEEE 802.11b Frame Format Figure 3.1 presents the 802.11b frame format with transmission rate of different parts.. @1Mbps. @1Mbps. PLCP Preamble (18B). PLCP header (6B). 8×(30+4+MSDU) bits @ data rate PSDU (MAC header) (30B). MSDU (variable). CRC (4B). Figure 3.1: IEEE 802.11b Frame Format. 13.
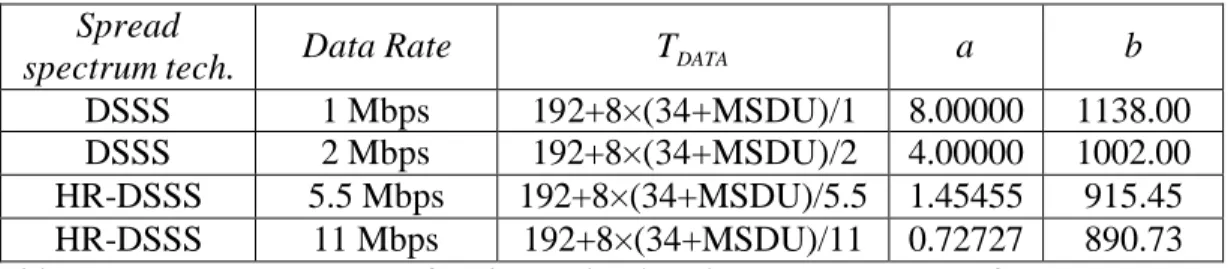
(23) 3.2.2 Effect of Packet Size and Data Rate The parameters value for throughput calculation is listed in table 3.1. The values have been taken from the IEEE 802.11b standard [1].. Parameters TSLIFS. 802.11b 10 µs. TDIFS. 50 µs. TSLOT. 20 µs. TPLCPheader. 48 µs. TPr eamble LMAC. 144 µs 34 bytes. L ACK 14 bytes TBO 310 µs CW 31 ~ 1023 Table 3.1: IEEE 802.11b Parameters With considering frame format, the transmission times for ACK and DATA frames can be calculated as follows:. T ACK = TPr eamble + TPLCPheader +. 8L ACK = 304 µs ACK rate. (3.8). TDATA = TPr eamble + TPLCPheader +. 8(L MAC + MSDU ) Data Rate. (3.9). Table 3.2 includes required parameters that have been used to plot throughput curves in Figures 3.2 and 3.3.. Spread Data Rate TDATA a b spectrum tech. DSSS 1 Mbps 192+8×(34+MSDU)/1 8.00000 1138.00 DSSS 2 Mbps 192+8×(34+MSDU)/2 4.00000 1002.00 HR-DSSS 5.5 Mbps 192+8×(34+MSDU)/5.5 1.45455 915.45 HR-DSSS 11 Mbps 192+8×(34+MSDU)/11 0.72727 890.73 Table 3.2: Transmission time for the payload and MMT parameters for IEEE 802.11b. 14.
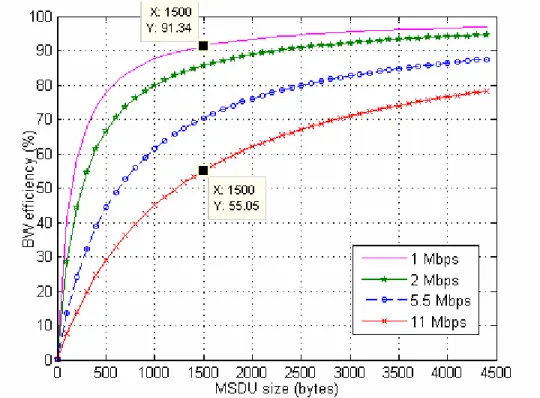
(24) Figure 3.2 shows the throughput versus MSDU sizes with respect to different transmission rates. It shows that for a typical Ethernet-sized packet with 54 Mbps data rate the Maximum MAC Throughput can not go beyond 6.1 Mbps and the BW efficiency in this case, according to Figure 3.3, would be about 55%.. Figure 3.2: Max. MAC Throughput of 802.11b. 15.
(25) Figure 3.3: BW efficiency of 802.11b. In Figure 3.2, one can see that for great MSDU sizes, the throughput tend to be relatively constant and reaches to a saturation throughput. The saturation throughput has been broadly studied in reference literatures [10, 12-18]. 3.2.3 Effect of RTS/CTS As indicated in section 2.7, RTS/CTS mechanism will change the timing diagram of successful data transmission and new parameters can be obtained as below.. TSLIFS = 10 ×3 = 30 µs TDIFS = 50 µs TRTS = 20 bytes L ACK = LCTS ⇒ TRTS. T ACK = TCTS 8L RTS = TPr eamble + TPLCPheader + = 352 µs RTS rate. (3.11). 16.
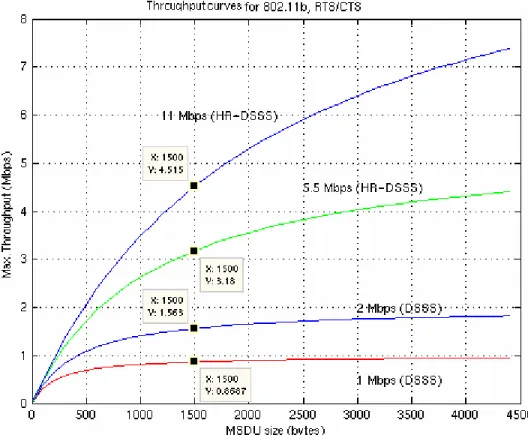
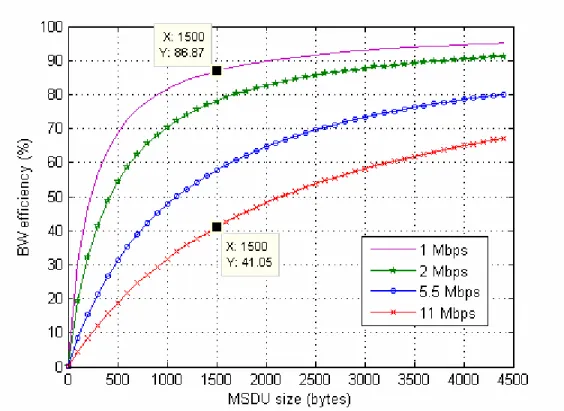
(26) Spread Data Rate TDATA a b spectrum tech. DSSS 1 Mbps 192+8×(34+MSDU)/1 8.00000 1814.00 DSSS 2 Mbps 192+8×(34+MSDU)/2 4.00000 1678.00 HR-DSSS 5.5 Mbps 192+8×(34+MSDU)/5.5 1.45455 1591.45 HR-DSSS 11 Mbps 192+8×(34+MSDU)/11 0.72727 1566.73 Table 3.3: Transmission time for the payload and MMT parameters for IEEE 802.11b RTS/CTS The relevant MMT and BW efficiency graphs of 802.11b with RTS/CTS mechanism have been plotted in Figure 3.4 and Figure 3.5 respectively. Throughput curves have experienced degradation. The impact of extra frame exchange in the throughput is more noticeable in higher data rates. As can be seen by comparing Figures 3.3 and 3.5, bandwidth efficiency is only 41% when the data rate is 11 Mbps and RTS/CTS is used, and it is 55% when CSMA/CA is used. CSMA/CA performs better than RTS/CTS since it uses less control frames.. Figure 3.4: Max. MAC Throughput of 802.11b - RTS/CTS. 17.
(27) Figure 3.5: BW efficiency of 802.11b - RTS/CTS. 3.3 IEEE 802.11a Throughput and Channel Efficiency 3.3.1 IEEE 802.11a Frame Format The frame structure of 802.11a has been depicted in Figure 3.6.. 16 µs. 4 µs. Data Rate. Figure 3.6: IEEE 802.11a Frame Format. 18.
(28) 3.3.2 Effect of Packet Size and Data Rate The similar method will be used to generate the necessary graphs. For different modulations that have been used in 802.11a, the Table 3.4 will provide the mapping between data rate and T NDBPS . Jun et al. [6] stated that in the worst case there is about 2% approximation error while calculating ‘a’ and ‘b’ coefficients in MMT formula for OFDM technology, since the total delay per MSDU is assumed continues. However it is not the case and ceiling function do not provide continues values.* Data Rate Modulation T NDBPS 6 BPSK 24 9 BPSK 36 12 QPSK 48 18 QPSK 72 24 16-QAM 96 36 16-QAM 144 48 64-QAM 192 54 64-QAM 216 Table 3.4: Data Rate – T NDBPS mapping Table 3.5 lists the parameters that are related to our calculations. They have been taken from IEEE standard [2]. Parameters TSLOT. 802.11a 9 µs. TSLIFS. 16 µs. TDIFS TBO. 34 µs 67.5 µs. TPr eamble TSignal. 16 µs. TSYM. 4 µs. LTail LService. 6 bits. 4 µs. 16 bits. L ACK 14 bytes LMAC 34 bytes CW 15 ~ 1023 Table 3.5: IEEE 802.11a Parameters. *. The ceiling function (+ +) gives the smallest integer greater than the fractional number on which it acts. For instance, ceiling of 1/3 is 1 and of 7/5 is 2.. 19.
(29) Finally, to calculate T ACK and TDATA :. TDATA. Spread spectrum tech. OFDM. L + LTail + 8L ACK T ACK = TPr eamble + TSignal + TSYM × Service N DBPS L + LTail + 8 × ( LMAC + MSDU ) = TPr eamble + TSignal + TSYM × Service N DATA . (3.12) (3.13). Data Rate (Mbps). TDATA. a. b. 6. 16+4+4× (16 + 6 + 8 × (34 + MSDU )) / 24 . 1.33333. 230.17. 0.66667. 194.00. 0.33333. 177.67. OFDM. 12. OFDM. 24. 16+4+4× (16 + 6 + 8 × (34 + MSDU )) / 38 16+4+4× (16 + 6 + 8 × (34 + MSDU )) / 96. 16+4+4× (16 + 6 + 8 × (34 + MSDU )) / 216 0.14815 167.00 OFDM 54 Table 3.6: Transmission time for the payload and MMT parameters for IEEE 802.11a. Figure 3.7: Max. MAC Throughput of 802.11a. 20.
(30) Figure 3.8: BW efficiency of 802.11a. 3.3.3 Effect of RTS/CTS. L ACK = LCTS = 14 bytes. ⇒. TACK = TCTS. L + LTail + 8 LRTS TRTS = TPr eamble + TSignal + TSYM + Service N DBPS . Spread TDATA spectrum TRTS TCTS T ACK tech.-D.R. OFDM-6 52 44 44 16+4+4× (16 + 6 + 8 × (34 + MSDU )) / 24 OFDM-12 36 32 32 16+4+4× (16 + 6 + 8 × (34 + MSDU )) / 38 OFDM-24 28. 28. 28. 16+4+4× (16 + 6 + 8 × (34 + MSDU )) / 96. (3.14). a. b. 1.33333 358.17 0.66667 294.00 0.33333 265.67. OFDM-54 24 24 24 16+4+4× (16 + 6 + 8 × (34 + MSDU )) / 216 0.14815 247.00 Table 3.7: Transmission time for the payload and MMT parameters for IEEE 802.11a RTS/CTS. 21.
(31) Figure 3.9: Max. MAC Throughput of 802.11a - RTS/CTS. Figure 3.10: BW efficiency of 802.11a - RTS/CTS. 22.
(32) 3.4 IEEE 802.11g Throughput and Channel Efficiency. 3.4.1 IEEE 802.11g Frame Format The frame format of the 802.11g in a wireless LAN with only 802.11g stations has been shown in Figure 3.11.. Figure 3.11: IEEE 802.11g (ERP-OFDM PLCP) Frame Format. 3.4.2 Effect of Packet Size and Data Rate The appropriate parameters for 802.11g, which have been extracted from [3], have been shown in Table 3.8.. Parameters TSLOT. 802.11g 9 µs. TSLIFS. 10 µs. TDIFS TBO. 28 µs 67.5 µs. TPr eamble TSYM. 16 µs. TSignal. 4 µs. TEX LService. 6 µs 16 bits. LTail. 6 bits. 4 µs. L ACK 14 bytes LMAC 34 bytes CW 15 ~ 1023 Table 3.8: IEEE 802.11g Parameters. 23.
(33) Considering the ACK, CTS and DATA frames, he required factors can be obtained from the following formulas.. L ACK = LCTS. ⇒ T ACK = TCTS. L + LTail + 8L ACK T ACK = TPr eamble + TSignal + TSYM × Service N DBPS . + TEX . Spread spectrum T TDATA tech.- Data Rate ACK OFDM-6 50 16+4+4× (16 + 6 + 8 × (34 + MSDU )) / 24 + 6 OFDM-12 38 16+4+4× (16 + 6 + 8 × (34 + MSDU )) / 38 +6 OFDM-24. 32. 16+4+4× (16 + 6 + 8 × (34 + MSDU )) / 96 +6. (3.15). a. b. 1.33333 230.17 0.66667 194.00 0.33333 177.67. OFDM-54 30 16+4+4× (16 + 6 + 8 × (34 + MSDU )) / 216 +6 0.14815 167.00 Table 3.9: Transmission time for the payload and MMT parameters for IEEE 802.11g. Figure 3.12: Max. MAC Throughput of 802.11g, g-only mode. 24.
(34) Figure 3.13: BW efficiency of 802.11g, g-only mode. 3.4.3 Effect of RTS/CTS The purpose of RTS/CTS in this case is only for hidden terminal problem not for protection. L + LTail + 8L RTS TRTS = TPr eamble + TSignal + TSYM × Service N DBPS . (3.16). Spread TDATA a b spectrum TRTS TCTS T ACK tech.-R.D. OFDM-6 58 50 50 16+4+4× (16 + 6 + 8 × (34 + MSDU )) / 24 + 6 1.33333 258.17 OFDM-12 42 38 38 16+4+4× (16 + 6 + 8 × (34 + MSDU )) / 38 +6 0.66667 294.00 OFDM-24 34 32 32 16+4+4× (16 + 6 + 8 × (34 + MSDU )) / 96 +6 0.33333 265.67 OFDM-54 30 30 30 16+4+4× (16 + 6 + 8 × (34 + MSDU )) / 216 +6 0.14815 247.00 Table 3.10: Transmission time for the payload and MMT parameters for IEEE 802.11g – RTS/CTS. 25.
(35) Figure 3.14: Max. MAC Throughput of 802.11g, RTS/CTS. Figure 3.15: BW efficiency of 802.11g, RTS/CTS Numerical values from computations based on our theoretical approach that have been presented in sections 3.3 and 3.4, it is easy to see that, the performance of 802.11a in terms of throughput and BW efficiency is exactly the same as 802.11g in g-only mode. Although these two standards have different frame formats, the OFDM-based spread spectrum technology lead to such a result. 26.
(36) 3.5 Hybrid 802.11b and 802.11g Throughput and Channel Efficiency The 802.11g devices with backwards compatibility to legacy 802.11b clients face numerous challenges that reduce the throughput of the g-only network. These include not only because of long overhead to support 802.11b devices, but various contention windows that create an unbalanced medium access by different standards. On the other hand, CTS-to-self or RTS/CTS protection mechanisms for b/g mixed mode can affect the throughput. In this section the impact of these factors on the throughput and in different scenarios will be studied. In 4.5.1 and 4.5.2 subsections the effects of protection on the throughput of 802.11g station when 802.11b station is present but not transmit any traffic, have been investigated. [28] provides detailed performance analysis b/g mixed mode by using simulation when the 802.11b user is idle.. Figure 3.16: IEEE 802.11g (ERP PLCP ) Frame Format - Long Preamble 3.5.1 Effect of CTS-to-self protection In this scenario, there is an 802.11g station that operates in CTS-to-self protection mode and one 802.11b station, which is idle and is not going to transmit any packets. To calculate the throughput of the 802.11g station the necessary parameters are as follows: Parameters. 802.11g, CTS-to-self. TSLOT. 20 µs. TSLIFS TDIFS. 10 µs. TBO TPr eamble (ACK). 150 µs. TPr eamble (CTS) TSYM. 144 µs. 50 µs 16 µs 4 µs. TSignal. 4 µs. TEX LService. 6 µs 16 bits. LTail L ACK. 6 bits 14 bytes. LMAC 34 bytes CW 15 ~ 1023 Table 3.11: IEEE 802.11g and CTS-to-self Protection Parameters. 27.
(37) TCTS = TPr eamble + TPLCPheader +. 8 LCTS 8 × 14 = 144 + 48 + = 202 .18 µs CTS rate 11 ⇒ T ACK ≠ TCTS. L + LTail + 8L ACK T ACK = TPr eamble + TSignal + TSYM × Service + TEX N DBPS . According to [13], CTS frame will be transmitted at the highest rate understood by all stations attached to the access point, which will be at most 11 Mbps. Since CTS frame is being transmitted on HR-DSSS spread spectrum, it has long preamble. Recall from Figure 2.9, the necessary components for MMT calculation may compose the table below. Maximum MAC parameters (‘a’ and ‘b’) have been obtained with respect to Figure 2.10 timing diagram. DATA-ACK CTS TCTS T ACK TDATA a b HROFDM-6 203 50 16+4+4× (16 + 6 + 8 × (34 + MSDU )) / 24 + 6 1.33333 538.00 DSSS HROFDM-12 203 38 16+4+4× (16 + 6 + 8 × (34 + MSDU )) / 38 +6 0.66667 501.15 DSSS HROFDM-24 203 32 16+4+4× (16 + 6 + 8 × (34 + MSDU )) / 96 +6 0.33333 483.25 DSSS HROFDM-54 203 30 16+4+4× (16 + 6 + 8 × (34 + MSDU )) / 216 +6 0.14815 474.44 DSSS Table 3.12: Transmission time for the payload and MMT parameters for IEEE 802.11g with CTS-to-self protection. Figure 3.17: Max. MAC Throughput of 802.11g - CTS-to-self protection. 28.
(38) Figure 3.18: BW efficiency of 802.11g - CTS-to-self protection. The graph shows that a typical Ethernet-sized packet in 802.11g station will experience about 44 percent drop in throughput. In other words even when 802.11b station is idle, CTS-to-self protection degrades the throughput considerably. Interestingly, the protection more affects the small packet sizes for lower data rates and as MSDU sizes increase the curves will reach to saturation but with bigger time constant.. 3.5.2 Effect of RTS/CTS protection In this scenario, RTS/CTS protection is enabled. It is expected that four-way protection method will waste more network resource and throughput will decrease although it will play the role of the hidden node protection. The parameters are similar to previous discussion and Figure 2.9 has been used to calculate ‘a’ and ‘b’.. TRTS = TPr eamble + TPLCPheader +. 8 LRTS 8 × 20 = 144 + 48 + = 325 µs RTS rate 11. 29.
(39) DATA, ACK. CTS, T T T TDATA a b RTS RTS CTS ACK HROFDM-6 58 50 50 16+4+4× (16 + 6 + 8 × (34 + MSDU )) / 24 + 6 1.33333 258.17 DSSS HROFDM-12 42 38 38 16+4+4× (16 + 6 + 8 × (34 + MSDU )) / 38 +6 0.66667 294.00 DSSS HROFDM-24 34 32 32 16+4+4× (16 + 6 + 8 × (34 + MSDU )) / 96 +6 0.33333 265.67 DSSS HROFDM-54 30 30 30 16+4+4× (16 + 6 + 8 × (34 + MSDU )) / 216 +6 0.14815 247.00 DSSS Table 3.13: Transmission time for the payload and MMT parameters for IEEE 802.11g with RTS/CTS protection. Figure 3.19: Max. MAC Throughput of 802.11g - RTS/CTS protection. 30.
(40) Figure 3.20: Max. MAC Throughput of 802.11g,CTS-to-self and RTS/CTS protections Figure 3.19 illustrates that if an Ethernet-size packet with 54 Mbps data rates use RTS/CTS protection, it will experience throughput degradation about 57% with respect to g-only mode.. Figure 3.21: BW efficiency of 802.11g - RTS/CTS protection. 31.
(41) 3.5.3 Effect of an active 802.11b station In this section, the wireless network consists of an 802.11g station and an 802.11b station which is no longer silent and competes with the 802.11g station to transmit the data over the shared medium. The assumption is that 802.11g and 802.11b are operating at their maximum data rates and the common CTS-to-self protection is used. Since the Contention Windows in 802.11g standard is 15 timeslots and that of 802.11b is 30 timeslots, an 802.11g station will have twice the chance to win the medium contention. Referenced publications [7-11], investigate the analysis of contention window size on the performance of the IEEE 802.11 standards. To avoid complex mathematics, a simplified method is employed: MAC Throughput of 802 . 11 g station in b / g mixed network = 2 × payload 2 × Delay of 802 . 11 g packet in CTS protection + Delay of 802 .11b packet. (3.16). MAC Throughput of 802 . 11b station in b / g mixed network = payload 2 × Delay of 802 . 11 g packet in CTS protection + Delay of 802 .11b packet. (3.17). By replacing the parameters to the above formulas, the results for ‘a’ and ‘b’ coefficients will be according to the following table:. a b Station type/rate 802.11g – 54 0.51178 919.805 802.11b – 11 1.02357 1839.61 Table 3.14: Max. MAC Throughput parameters of IEEE 802.11g and IEEE 802.11b in b/g mixed mode. The throughput comparison of 802.11g and 802.11b stations in this scenario is presented in Figure 3.22. Two additional curves can be noticed in the figure, one is the throughput of an 802.11g station in a network with two 802.11g stations operating in CTS-to-self protection mode and the next one is the throughput of an 802.11b station in b-only network with two 802.11b user.. 32.
(42) Figure 3.22: Effect of an active 802.11b station on the throughput of 802.11g and 802.11b in b/g mixed mode. While comparing the relevant curves in three scenarios, several interesting point are made: The active 802.11b station degrades the throughput of 802.11g station. The penalty of an active 802.11b station on the throughput of the 802.11g station for a typical Ethernet-sized packet can be as high as 17% of the throughput of 802.11g station in hybrid network with idle 802.11b station. The gradation is not only because of the protection mechanisms, but especially because of occupying the shared media by the lower rate 802.11b device that keeps the 802.11g station waiting even longer than transmitting two 802.11g frames. It is clear that this reduction will increase as packet size increases since 802.11b user will waste more time to transmit the packet and will penalize the throughput of the 802.11g station. More interestingly and more pleasant to make attention is that, the simultaneous b/g user coordination gain greater throughput on 802.11b station. The cause would be a shorter queue time that 802.11b station experience in comparison with b-only environment. The authors of [34] have published a paper on the “Performance Anomaly of 802.11b”. They have observed that when one station uses lower bit rates than the others; the performance of all the hosts is considerably degraded and it will be equal to the throughput of the station with lower bit rate.. 33.
(43) 4. Study free space path loss of 802.11g. 4.1 Introduction Since data transmission in wireless networks is broadcast in nature, there are some challenges to be addressed, which do not arise in wired case. In addition to noise, which is the random electromagnetic waves, interference from other wireless nodes that are using the same frequency band is the another issue that should take into consideration. More importantly, time variation of these hurdles over the communication channel as a result of user mobility and environment changes affects the received signal in unpredictable fashion. This chapter focuses on the variation in received signal power over distance due to path loss in an IEEE 802.11g network LAN.. 4.2 Free Space Path Loss Path loss is caused by dissipation of the power radiated by the transmitter as well as by effects of the propagation channel [37]. Free-space path loss is very simplified model for signal propagation. In this model no obstacle between the transmitter and receiver is considered in other words the model for the channel is line-of-sight (LOS). The presence of an obstacle between the transmitted and receiver causes Shadowing effects on the received signal which are reflection, scattering and diffraction.. 4.3 Cross-validation of theoretical and experimental performance of 802.11g Nyberg et al. [36] have done a measurement-based study of IEEE 802.11b/g wireless network in an underground mine. Figure 4.1 shows the measured SNR as a function of distance from AP in one of the tunnels in LKAB iron ore mine in Kiruna, Sweden. In this section the aim is to characterize this graph based on theoretical computations. The system under consideration is in an IEEE 802.11g WLAN with only one transmitter and one receiver. Without loss of generality it can be assumed that the interference and collision can be ignored. For simplicity fading is not considered. The literatures [19] and [20] have been considered the use of CSMA/CA for wireless networks in presence of interference and fading channels. Let’s consider Pt as the transmitter power, Gt and G r , the transmitter and receiver antenna gains, Ploss the path loss, N power the receiver noise power and I m the implementation margin. The signal-to-noise in dB ignoring fading is given by [38]:. ~ SNR = Pt + Gt + G r − Ploss − N power − I m. (4.1). 34.
(44) Figure 4.1: SNR as a function of distance from AP in mine. According to the IEEE 802.11g standard [3], the maximum transmit power is 100 milliwatts for WLANs and I m is defined 5 dB. Let’s assume Gt = Gr = 0 to be in the safe side.. Pt = 100 mW = −10 dB I m = 5 dB Equation (4.2) is used to calculate N power :. N power = 10 log( K .T .B) + NF. (4.2). where NF is noise figure, K is Boltzman constant, T is temperature in Kelvin and B is the bandwidth. The temperature in the tunnel was about 7 ο C ( 280 ο K ). NF and B are also specified in the standard as below: NF = 100 dB B = 20 MHz. N power = −121 .117 dB. T = 280 ο K K = 1.3807 × 10 −23. To analyze the present measurement data, we are going to use the common empirical model. Power Law model, the loss is assumes to be a power function of distance. Since all measurements were taken on a single floor this model is given by the following expression:. 35.
(45) Ploss = PL (d 0 ) + 10 n log(. d ) d0. (4.3). This equation predicts the path loss, Ploss at distance d. Where d 0 is some reference distance,. PL (d 0 ) is the path loss at d 0 and n is path loss exponent. The path loss exponent for free space loss is equal to 2. To calculate PL (d 0 ) in dB, Friis Equation [39] has been used: 4π d 0 2 PL (d 0 ) = 10 log λ . (4.4). With d 0 = 1 m and f 802.11g = 2.4 × 10 9 Hz ⇒ λ = 0.125 m ~ The path loss and SNR at the reference distance would be:. ~ PL (1) = 40 dB ⇒ SNR (1m) = 66.117 dB (n = 2) ~ Substituting these values back into equation (4.1) gives the SNR as a function of d. Figure 4.2 illustrates the result for n=2 and n=1.5.. Figure 4.2: Free Space Pass Loss of IEEE 802.11g. Comparing Figures 4.1 with Figure 4.2, leads us to this point that the path loss behavior of IEEE 802.11g signal in the mine, in terms of path loss exponent can be bounded between n=2 and n=1.5.. 36.
(46) 6 Conclusions 6.1 Results The performance limits of different IEEE 802.11 Wireless LANs in terms of Maximum MAC Throughput and Bandwidth Efficiency have been discussed in this document. It examines the effects of variety of variables including MSDU size, data rate, overheads, modulation schemes and control frame exchange on throughput. It is evident that in all the scenarios, maximum MAC throughput and bandwidth efficiency improved as the MSDU size increased and they follow the similar trend. Moreover, the high and fixed throughput guarantee is only achievable over very large MSDU sizes and throughput saturation will happen much later when the data rates increases. Maximum throughput and BW efficiency for typical Ethernet-size data frames are quite smaller than the nominal channel data rate. Since the analysis was done in MAC layer, for more realistic operations, it is expected to have higher throughput degradation because of more overheads. Through the series of graphs, it is demonstrated how throughput suffers a significant hit from hidden terminal problem due to RTS/CTS mechanism. Although in practice 802.11g has significantly different throughput in comparison with that of 802.11a, both system have exactly the same theoretical throughput curves in MAC layer, it is due to the fact that similar physical layer specification have been used in 802.11a and 802.11g. The presence of 802.11b station in 802.11g networks has been investigated. The 802.11g station will experience throughput degradation in presence of an idle 802.11b station as a result of protection frame exchanges. The active 802.11b station in a hybrid 802.11b/g network, by occupying the shared medium considerably penalizes the throughput of 802.11g station. However, unbalance opportunities and transmission cycle duration in such a network gain greater throughput on 802.11b station compared with the b-only network. The behavior of an 802.11g performance in terms of path loss has been studies in brief. By combining the relevant graphs from the measurements of SNR in an underground mine and theoretical calculation, the path loss exponent has been obtained.. 6.2 Future works Due to limited time, this thesis focused the performance limits of IEEE 802.11 in an ideal channel condition based on some assumptions. However, many issues could be subjects to future studies. This thesis considered Distributed Coordination Function (DCF) for media access method. An interesting subject in the future work could be study the performance limits, with Point Coordination Function (PCF) media access method. Another aspect that needs to be studied is to take the Bit Error Rate (BER) and Fading to the consideration. This will help us to determine appropriate patterns for the performance of IEEE 802.11 WLAN in more realistic channel conditions. In addition, the author suggests including the distance from access point (Range) in throughput studies.. 37.
(47) 7 References. [1] Wireless LAN medium access control (MAC) and physical layer (PHY) specification: High-speed physical layer extension in the 2.4 GHz band, IEEE Standard 802.11, Sept. 1999. [2] Wireless LAN medium access control (MAC) and physical layer (PHY) specification: High-speed physical layer in the 5 GHz band, IEEE Standard 802.11, Sept. 1999. [3] Wireless LAN medium access control (MAC) and physical layer (PHY) specification: High-speed physical layer extension to IEEE 802.11b, 2003. [4] Wireless LAN medium access control (MAC) and physical layer (PHY) specification, IEEE Standard 802.11, June 1999. [5] WiFi Alliance, URL: http://www.wi-fi.org/ [6] J. Jun, P. Peddabachagari, and M. L. Sichitiu, Theoretical maximum throughput of IEEE 802.11 and its applications, In Proceedings of the 2nd IEEE International Symposium on Network Computing and Applications (NCA’03), pages 249–256, 2003. [7] Y. Xiao and J. Rosdahl, Throughput and delay limits of IEEE 802.11, IEEE Communications Letters, Vol. 6, no. 8, pp. 355-357, Aug. 2002. [8] B. Bing, Measured performance of the IEEE 802.11 wireless LAN, in Local Computer Networks – LCN’99, 1999, pp. 34-42. [9] F. Cali, M. Conti, and E. Gregori, IEEE 802.11 wireless LAN: Capacity analysis and protocol enhancement, in Proc. Of INFOCOM’ 98, Seventeenth Annual Joint Conference of the IEEE Computer and Communications Societies; vol. 1, 1998, pp. 142-149. [10] Y. Tay and K. C. Chua, A capacity analysis for the IEEE 802.11 MAC protocol, Wireless Networks, vol. 7, pp. 159-171, 2001. [11] J. C. Chen and J. M. Gilbert, Measured performance of 5-GHz 802.11a wireless LAN systems, http://www.cse.iitb.ac.in/~varsha/allpapers/wireless/AtherosRangeCapacityPaper.pdf. [12] Andrew S. Tanenbaum, Computer Networks, fourth edition Printice-Hall, 2002. [13] Matthew. Gast, When is 54 Not Equal to 54? A Look at 802.11a, b, and g Throughput, http://www.oreilly.com/pub/a/wireless/2003/08/08/wireless_throughput.html. [14] G. Bianchi, IEEE 802.11-Saturation throughput analysis, IEEE Communications Letters, Vol. 2, No. 12, Dec. 1998, pp. 318-320.. 38.
(48) [15] G. Bianchi, Performance Analysis of the IEEE 802.11Distributed Coordination Function, IEEE Journal on Selected Areas in Communications, Vol. 18, No. 3, Mar. 2000. [16] F. Cali, M. Conti, and E. Gregori, Dynamic Tuning of the IEEE 802.11 Protocol to Achieve a Theoretical Throughput Limit, IEEE/ACM Trans. on Networking, Vol. 8, No. 6, Dec. 2000, pp. 785-799. [17] H. S. Chayya and S. Gupta, Performance modelling of asynchronous data transfer methods of IEEE 802.11MAC protocol, Wireless Networks, Vol 3, 1997, pp. 217-234. [18] Haitao Wu, Yong Peng, Keping Long, and Shiduan Cheng and Jian Ma, Performance of Reliable Transport Protocol over IEEE 802.11 Wireless LAN: Analysis And Enhancement, INFOCOM 2002. [19] A. De Simone, S. Nanda, Wireless Data: Systems, Standards, Services, Wireless Networks, Vol. 1, No. 3, February 1996, pp. 241-254. [20] K. C. Chen, Medium Access Control of Wireless LANs for Mobile Computing, IEEE Networks, September/October 1994, pp. 50-63. [21] A. Banchs and X. Perez, Providing throughput guarantees in IEEE 802.11 wireless LAN, Proc. of IEEE Wireless Communications and Networking Conference - WCNC2002, vol. 1, 2002, pp. 130–138. [22] A. Banchs, M. Radimirsch, and X. Perez, Assured and expedited forwarding extensions for IEEE 802.11 wireless LAN, Proc. of the Tenth IEEE International Workshop on Quality of Service, 2002, pp. 237 – 246. [23] D. Kotz and K. Essien, Analysis of a campus-wide wireless network, in Proceedings of Mobicom, Sep. 2003 [24] A. Balachandran, G. M. Voelker, P. Bahl, and P. V. Rangan, Characterizing user behavior and network performance in a public wireless LAN, in Proceedings of ACM SIGMETRICS, Vol. 30, No. 1, June 2002. [25] Wireless boost for British cities, http://news.bbc.co.uk/2/hi/technology/4993038.stm, 18 May 2006. [26] Matthew S. Gast, 802.11 Wireless Networks: The Definitive Guide, second edition O’Reilly, April 2005. [27] A. Doufexi, S. Armour, B. –S. Lee, A Nix and D Bull, An Evalution of the Performance of IEEE 802.11a and 802.11g Wireless Local Area Network in a Corporate Office Environment, ICC 2003. [28] M-J. HO, J. Wang, K. Shelby and H. Haisch, IEEE 802.11g OFDM WLAN throughput performance, VTC 2003-Fall.. 39.
(49) [29] Y. C. Tay and K. C. Chua, A capacity analysis for the IEEE 802.11 MAC protocol, Wireless Networks, Vol. 7, 1997. [30] K. C. Huang and K. C. Chen, Interference Analysis of Non-persistent CSMA with Hidden Terminals in Multi-cell Wireless Data Networks’ IEEE PIMRC 1995. [31] H. S. Chhaya and S. Gupta, Performance modelling of asynchronous data transfer methods of IEEE 802.11 MAC protocol, Wireless Networks, Vol. 3, pp. 217-234, 1997. [32] H. Wu1, Y. Peng, K. Long, S. Cheng, J. Ma, Performance of Reliable Transport Protocol over IEEE 802.11 Wireless LAN: Analysis and Enhancement, INFOCOM 2002. [33] J.P. Pavon, S. Choi, Link adaptation strategy for IEEE 802.11 WLAN via received signal strength measurement, IEEE ICC 2003, pp.1108-1113, May 2003. [34] M. Heusse, F. Rousseau, G. Berger-Sabbatel and A. Duda, Performance Anomaly of 802.11b, INFOCOM 2003. [35] B. P. Crow, I. Widjaja, J. G. Kim, and P. Sakai, Investigation of the IEEE 802.11 Medium Access Control (MAC), in Proceedings of INFOCOM 1997, 1997. [36] V. Nyberg, T. Renström, and E. Rosenius, SMS 048 signal processing project, measurement-based and evaluation of IEEE 802.11b/g wireless communication network in underground mines, 2005, Evaluation of IEEE 802.11 b/g on the physical layer. [37] Andrea Goldsmith, Wireless Communications, Cambridge University Press, 2005 [38] O. Awoniyi and F. A. Tobagi, Effect of Fading on the Performance of VoIP in IEEE 802.11a WLANs, in Proceedings of the IEEE International Conference on Communications, vol. 6, June 20-24, 2004, pp. 3712-3717. [39] T. S. Rappaport, Wireless Communications, Principals and Practice, 7th edition, Upper Saddle River, NJ: Prentice-Hall, 1996.¨ [40] J. Medbo, J.-E. Berg, Simple and Accurate Path Loss Modeling at 5 GHz in Indoor Environments with Corridors, Source: Ericsson Research Sweden, European Cooperation in the field of science and technical research, 2002. 40.
(50)
Figure

+7

![Table 3.5 lists the parameters that are related to our calculations. They have been taken from IEEE standard [2]](https://thumb-eu.123doks.com/thumbv2/5dokorg/5469200.142277/28.918.354.618.593.966/table-lists-parameters-related-calculations-taken-ieee-standard.webp)
Related documents
Alternating Current Automatic Repeat Request Broadband Home Networks Binary Phase-Shift Keying Carrier Sense Multiple Access/Collision Avoidance Carrier Sense Multiple
Automatic Gain Control Active Link Protection Asynchronous Transfer Mode Bit Error Rate Code Division Multiple Access High Data Rates CDMA Carrier Sense Multiple Access
– en kartläggning av rekrytering, examination
having heard of the importance of quickly seeking medical care and calling for an ambu- lance when experiencing chest pain, an abrupt onset of symptoms with more severe
The aim of our study is to obtain ZnO 1-х S х thin films over the entire range of compositions by reactive rf magnetron sputtering of ZnS target and study
A significant clinical improvement was obtained in 75% of patients with a multimodality therapy; Table 3 Summary of studies using extracorporeal photopheresis as monotherapy or
Improving the Efficiency of Control Signaling in Wireless Multiple Access Systems..
The results show that Posit32, the 32-bit variant of Posit, performs equally or better than Float, the corresponding bit-size of IEEE 754.For the tests done in this paper we found
