I
Acknowledgements
This master thesis was written at IKEA of Sweden in Älmhult, during late 2009 and early 2010. In this period we had the opportunity to meet many experienced and professional people within different parts of the organization. We would like thank our supervisor at IKEA, Paul Björnsson, for giving us the chance to conduct this project and for all his help along the way.
There are several individuals that have been of great assistance and contributed with their knowledge, making it possible to fulfill the purpose of this master thesis. We would especially like to thank Pernilla Holmstedt who helped us constructing the process maps.
Finally, we would like to thank Stig-Arne Mattsson, our supervisor at Lund University, Faculty of Engineering. His guidance, feedback and motivation helped us throughout the project and have been valuable for the outcome, our master thesis.
Lund, January 2010
Christian Lycke Bladh Fredrik Starling
III
Abstract
IKEA is currently in the progress of integrating Business Process Management (BPM) into the current functional organization. In order to investigate how to increase the accuracy of the capacity planning, IKEA saw a need of examining the processes connected to Plan & Secure Capacity, a sub process to the main process Supplying.
The purpose of this master thesis is to by using Network Planning map existing timelines for activities within the process Plan & Secure Capacity as well as for processes connected to it. In cases where information regarding processes is inadequate an “as is” description of the flow is to be mapped. Furthermore the planning cycle within Plan & Secure is to be reviewed and recommendations of how to make it quicker, leaner and simpler shall be given.
A descriptive and normative methodology approach was chosen in order to primarily explain and examine how the current situation is, and secondarily to suggest future recommendations. Information gathering was done in an inductive way combined with qualitative methods. Primary data was gathered mostly via interviews and in order to sustain a high level of reliability validation protocols were sent out. Secondary data was mostly used to form the theoretical framework and has been gathered from research reports and literature originating from well established universities or organizations.
The theory in the master thesis focuses on Network planning in order to determine possible time savings and to illustrate connections and critical paths via timelines and precedence relations. In order to create and understand process maps in a proper way the theoretical framework also includes Process Management.
The Capacity planning and the processes connected to it represents a complex context with a lot of factors influencing the outcome. The mapping of processes connected to Plan & Secure Capacity has shown that the outcome of a planning cycle has no further connection to the next planning cycle taking place. This enables some possible changes in the timelines and these can be further studied in Conclusions and Recommendations together with highlighted problems and suggested solutions.
V
Table of Contents
1 INTRODUCTION ... 1 1.1BACKGROUND ... 1 1.2PROBLEM DISCUSSION ... 2 1.3PURPOSE ... 21.4FOCUS AND DELIMITATIONS ... 3
1.5TARGET GROUP ... 3 1.6COMPANY DESCRIPTION ... 4 2 METHODOLOGY ... 5 2.1RESEARCH METHODOLOGY ... 5 2.1.1 Induction ... 6 2.1.2 Deduction ... 6 2.1.3 Abduction ... 7
2.2QUANTITATIVE AND QUALITATIVE STUDIES ... 7
2.3DATA GATHERING ... 8
2.3.1 Primary and secondary data ... 8
2.3.2 Interviews ... 8 2.3.3 Literature studies ... 10 2.3.4 Questionnaires ... 11 2.3.5 Observations ... 11 2.4VALIDITY ... 12 2.5RELIABILITY ... 12 2.6OBJECTIVITY ... 13
2.7METHODOLOGY CRITICISM AND CREDIBILITY OF SOURCES ... 13
3 THEORETICAL FRAMEWORK ... 15
3.1NETWORK PLANNING ... 15
3.1.1 Construction of network diagrams ... 16
3.1.1.1 Activity on arrow (AoA) ... 16
3.1.1.2 Activity on node (AoN) ... 17
3.1.2 Network diagrams calculations ... 19
3.1.2.1 Earliest start times for activities (ES) ... 19
3.1.2.2 Latest finish times for activities (LF) ... 20
3.1.2.3 Latest start times for activities (LS) ... 20
3.1.2.4 Earliest finish times for activities (EF) ... 20
3.1.2.5 Float ... 20
3.1.2.6 Critical path ... 21
3.1.3 Network Planning example ... 21
VI 3.3PROCESS MANAGEMENT ... 26 3.3.1 Processes ... 26 3.3.2 Process orientation ... 26 3.3.3 Process identification ... 27 3.3.4 Process documentation ... 27 3.3.4.1 Process mapping ... 28 3.3.5 Measuring Processes ... 33 4 EMPIRICAL STUDY ... 35
4.1IKEA PROCESS STRUCTURE ... 35
4.2YEAR CYCLE ... 38
4.3MID TERM PLANNING ... 39
4.4FLOWS CONNECTED TO CAPACITY PLANNING ... 40
4.4.1 Assumptions when mapping timelines ... 43
4.4.2 Create Group Sales Forecast ... 44
4.4.3 Set CAPP frame ... 45
4.4.4 Capacity planning Retail ... 46
4.4.5 Aggregated Capacity Planning ... 48
4.4.5.1 Sales Development ... 48
4.4.5.2 Supply Development ... 49
4.4.5.3 Stock Development ... 50
4.4.5.4 Purchase Development ... 51
4.4.5.5 Plan Aggregated Capacity ... 53
4.4.6 Detailed planning - Distribution Service Capacity ... 54
4.4.7 Detailed planning – Transport Capacity ... 55
4.4.8 Bimonthly reporting ... 56
4.4.9 Pricing ... 57
4.4.10 Set Cost Goal ... 59
4.4.11 Group Management review... 60
5 ANALYSIS ... 63
5.1PLANNING CYCLE DRIVERS ... 63
5.2FLOW CONNECTED TO CAPACITY PLANNING ... 65
5.3TOTAL DURATION OF THE PLANNING CYCLES ... 69
5.4ACTUAL FINISH VERSUS DEADLINE FLOW PLANNING YEAR CYCLE FY10 ... 71
5.5FLOAT WITHIN THE PLANNING CYCLES... 72
5.5.1 Float related to Sales Forecasts already carried out ... 74
5.5.2 Float related to Sales Forecasts not yet carried out ... 77
5.5.3 Effects of Float and Critical Path... 79
VII
6.1CONCLUSIONS ... 81 6.2RECOMMENDATIONS ... 84 REFERENCES ... 87 APPENDIX A - INTERVIEW GUIDE ... I APPENDIX B – PROCESS MAPS ... IV
1
1
Introduction
This chapter provides the background of the master thesis and a problem discussion is clarified. Further on the purpose of the master thesis is defined, followed by a description of focus and delimitations. In this chapter the intended target groups are also presented.
1.1 Background
In the current business world companies face constant challenges to modify and streamline their operations. This because of factors such as market globalization, more intense competition and technological evolution.1 The need of flexibility and communication is today essential in order to survive and therefore many companies are moving from the traditional function oriented organization towards process orientation.2
To facilitate cooperation within the organization in order to increase customer satisfaction a decision was taken within IKEA to integrate Business Process Management (BPM) into the current functional organization. The project for this implementation is called “One IKEA” and focus is on “togetherness” in order to increase business results. Three main processes were declared:3
Creating the home furnishing offer
Supplying
Communicating & Selling
Within the Supplying process the overall goals are to make the IKEA product range available for the customers. This by buying, producing and distributing the goods at the highest possible customer experienced quality, under good social and environmental conditions at the lowest total cost.4
1
(Dicken, 2003)
2 (Ljungberg & Larsson, 2001), p.21 3 (Supplying, 2009), p.16
4
2
1.2 Problem discussion
One purpose of ”One IKEA” within Supplying is to optimize the whole supply chain by integrating processes with current functions. This creates an organization where processes link functions together and increases communication between them. Even though this is leading to greater possibilities of crossing boarders and working more together there are still cases where parallel working methods and routines occur. Occasionally this leads to sub-optimization between functions, high operational costs and unnecessary overlaps.5
To secure awareness of milestones, deadlines and responsibilities IKEA has developed a concept called Year Cycle. The way a Year Cycle is constructed has a major impact on how work is planned and executed within the processes. Events in the IKEA Supply Planning Year Cycle work as triggers and start a chain of processes within Supplying. There are many objects and a lot of information that needs to be processed in time for the next event in the Year Cycle. A problem has been that it is hard to know how long time it takes to process different objects and how well the processes are coordinated time wise. Without this knowledge it can be difficult to distribute available time between different parts of the company that are affected by the Year Cycle. This also affects the possibility to secure quality in the planning process since the quality of the outcome decreases with increased time span.6
1.3 Purpose
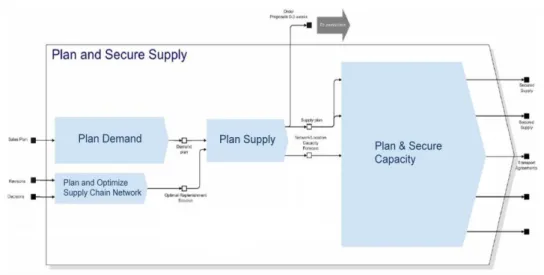
As a consequence of the discussion mentioned above IKEA saw a need of examining current processes affected by the IKEA Year Cycle connected to the Supplying process in general and one of its core processes, Plan & Secure Supply, in particular. Within Plan & Secure Supply the sub process Plan & Secure Capacity will be used as a starting point for the investigation. The purpose of this master thesis is accordingly to:
1. a) By using Network Planning map existing timelines for activities within the sub process Plan & Secure Capacity as well as for processes within
5 (Supplying, 2009), p.15 6
3
the frame, from creating Group Sales Forecast until the financial reporting to IKEA Group.
b) In cases where information regarding processes or activities within the frame is inadequate, an “as is” description of the flow is to be mapped.
2. Review and develop the planning cycle within Plan & Secure Capacity. 3. Suggest recommendations of how to make the planning cycle within
Plan & Secure Capacity quicker, leaner and simpler.
1.4 Focus and delimitations
Within the main process Supplying there are four core processes, two within planning and two within execution. Because of time and capacity restraints the focus on this master thesis is on the planning process Plan & Secure Supply. The other two main processes are not included in this project. When mapping the timelines and flow connected to Plan & Secure Capacity, some processes outside the Supplying process are included in order to cover both downstream and upstream flow. Regarding the downstream flow, the focus is on the financial reporting. The following review, development and recommendations primarily consider the planning process Plan & Secure Capacity.
1.5 Target group
The primary target group for this master thesis is IKEA personnel within the main process Supplying in general and the core process Plan & Secure Supply in particular. The secondary target group for this master thesis is engineering students focusing on supply chain management and process orientation, and lecturers as well as professors at Lund University, Faculty of Engineering (LTH), within the Department of Industrial Management and Logistics. Since the target groups are well familiar with the nomenclature, concept and words that these groups are expected to know will not be explained.
4
1.6 Company description
IKEA is a Swedish world leading Company within the home furnishing business. The company develops, manufactures and market its products in most parts of the world, operating in over 39 countries with 123000 co-workers and a net turnover of 21.5 billion euro.7 IKEA is divided into three different groups, The IKEA Group, The Inter IKEA Group and the IKANO Group. The IKEA Group is what most people refer to when thinking about IKEA and encompasses all operations from raw material to finished and delivered products. The Inter IKEA Group owns everything that has to do with the concept and trademarks and The IKANO Group primarily deals with financial services.8
IKEA was founded in 1943 by Ingvar Kamprad in a small Swedish town called Agunnaryd. In 1951 the company moved to Älmhult, which is seen as the heart of IKEA and where IKEA of Sweden (IoS) has its headquarter. Since 1982, The IKEA Group has been owned by a foundation because Ingvar Kamprad wanted to create an organization that stands for independence and a long-term approach.9 IKEA’s vision is: “To create a better everyday life for the many people”. This statement is supported by their business idea: “We shall offer a wide range of well-designed, functional home furnishing products at prices so low that as many people as possible will be able to afford them”.10 Since September 1st, 2009 Michael Olsson is the new Group CEO, replacing Anders Dahlvig who resigns after 10 years of presidency.11
7 (IKEA webpage, 2009) 8 (Peterson, 2009) 9 (IKEA webpage, 2009) 10 Ibid 11 Ibid
5
2
Methodology
This chapter describes methodology and methods that can be used in order to fulfill the purpose. The procedures used in this master thesis are presented and motivated. Different ways of data gathering are presented and the validity, reliability and objectivity of the master thesis are discussed.
2.1 Research Methodology
Methodology is the fundamental working method that sets frames and principles for how a study is conducted. The purpose of methodology is not to describe the exact procedure but to step by step help getting in the right direction towards fulfilling the purpose. Depending on the purpose of the study different methodological approaches can be used and the amount of knowledge within a research area can be of significance when deciding on type of study.12 There are four types of studies with distinct differences and each of them represents a certain way of work.
Exploratory studies - Used when there is little knowledge of the
research area and basic understanding of a problem and its context is to be attained.13
Descriptive studies - Used when there is basic knowledge and
understanding of the research area. The purpose of the study is to find out and describe how something works or is executed.14
Explanatory studies - Used when deeper knowledge and understanding
of a research area is sought. In this type of study the goal is to describe, explain and find cause-effects aspects of the problem.15
Normative studies – Used when there is basic knowledge and
understanding of the research area. The purpose of the study is to give guidance or recommendations for future operations.16
12
(Höst, Regnell, & Runeson, 2006), p.29
13 Ibid
14 (Björklund & Paulsson, 2003), p.58 15
6
This master thesis is best seen as a mix of a descriptive and normative study. A descriptive study was used in order to map existing timelines for activities within the sub process Plan & Secure Capacity. In cases where processes connected to this cycle were not already mapped by IKEA they were described as well. In order to suggest recommendations of how to make the planning year cycle within Plan & Secure Capacity more lean and simple the use of a normative study was needed.
The relationship between the theoretical framework and empirical data, and the perception of the two, has a major impact on how research is conducted. There are three methodology approaches when researching and each of them represents a certain way of working.
2.1.1 Induction
When using the inductive approach a subject can be studied without first having looked at existing theory regarding the research area. The starting point is the gathering of empirical data and based upon that material, theoretical as well as general conclusions are drawn. An inductive approach is often needed when performing an exploratory study and a condition when gathering empirical data is that this should be done in an impartial way.17
2.1.2 Deduction
When using a deductive approach the foundation of the research lies in existing theories. From the theoretical framework predictions of the empirics are made which are then compared with the gathered empirical data. From the comparison conclusions are made based on existing theories.18 The most known deductive approach is hypothetic-deductive where a hypothesis is derived from theory in order to be tested empirically. An ideal way to perform this test is to systematically vary influencing factors and simultaneously measure the effects.19
16
(Björklund & Paulsson, 2003), p.58
17 (Wallén, 1996), p.47
18 (Björklund & Paulsson, 2003), p.62 19
7
2.1.3 Abduction
When trying to draw conclusions or find causes to observations abduction can be used. Unlike deduction, where factors are varied and effects measured, the cause to an effect is sought without having the possibility to manipulate influencing factors. This implies vast knowledge within the research area or experience of similar cases to be able come to a reasonable result. In order to make the conclusions drawn while using abduction logically valid further investigation in form of practical experiments is needed.20
In this master thesis an inductive approach was chosen. The collection of empirical data laid the foundation and the theoretical framework was only used as a tool in order to structure and present the empirical findings.
2.2 Quantitative and qualitative studies
A quantitative study encompasses information which can be measured or numerically valued. Methods to be most suited for quantitative studies are questionnaires, mathematical models and statistical analysis. Everything cannot be measured quantitative though, which sets boundaries for the amount of possible gathered information.21
Qualitative studies are used when trying to attain a deeper understanding for a specific subject, event or situation. In comparison to quantitative studies, the possibilities for generalizations are less with qualitative studies. Which study being used primarily depends on what the purpose is of the study. Observations and interviews are in general better suited for qualitative studies, though it is the practical procedure that determines what kind of information to be gathered.22
In this master thesis qualitative studies, mostly in form of interviews, have been used for gathering empirical data. Although some of the information gathered has been of numerical value this data has not been sufficient for statistical analysis.
20 Ibid
21 (Björklund & Paulsson, 2003), p.63 22
8
2.3 Data Gathering
There are many methods that can be used to collect and process data. In connection with choosing method it can also be appropriate to consider what kind of data that is of interest.23 In this chapter different kinds of data and some of the most common studies and methods for collecting it are described.
2.3.1 Primary and secondary data
Primary data is data gathered in purpose to be used in a specific study. The data does not exist prior to the study and is usually gathered through interviews, questionnaires and case studies.24
Secondary data is often originally based on another purpose than in current study. It has been gathered prior to the study and is generally presented in literature or electronic format. When gathering secondary data it is important to be aware of that the information could be biased or not comprehensive.25 Aspects to be considered critical are immediacy, objectivity and reliable sources.26
Primary data in this master thesis has mostly been gathered through interviews but some information has also been given after sending out interview protocols for validation. Empirical secondary data originates mainly from internal IKEA documents while the theoretical secondary data has been gathered from literature relevant for the master thesis.
2.3.2 Interviews
Interviews can be structured in different levels, structured, semi-structured or
unstructured. The structured one is more or less an oral questionnaire with
confined answers to fixed questions. Advantages with this are the opportunity to explain uncertainties and the risks for missing information decreases. It is way more time consuming than doing a written questionnaires though.
The contrary unstructured interview is based upon an interview guide with different question areas. With this technique, questions can be formulated in different ways and in different types of order. To assure that all areas get
23
(Björklund & Paulsson, 2003), p.66
24 (Björklund & Paulsson, 2003), p.68 25 Ibid
26
9
covered and somewhat equally distributed time wise, it could be a good idea to dispose time limits per area. The open character of an unstructured interview could mean that information about totally different areas than suspected becomes included and the interview should therefore be recorded.
A semi-structured interview is a combination of an unstructured and structured interview where open questions are mixed with fixed questions. It is important that the fixed questions with fixed answering alternatives are formulated in the same way and asked in the same order, to not risk affecting the interview person in different ways.27
Qualitative interviews are used to get perceptions as a result of the interviewed persons own understanding. Standardized question forms are therefore not used since this would steer the interview too much. The investigator has a certain understanding about important factors and has written a manual or guide for the interview. This guide does not necessarily need to be followed precisely but it is of importance that the interview encompasses all areas within it. While doing the interview, new ideas and understandings often appear that might replace or deepen matters in the interview guide. This has to be considered during the interview.28
The selection of survey units is of great importance for the survey. Wrong persons in the selection could lead to a completely valueless survey in relation to the original purpose. This means that the selection is not done randomly (statistically), but systematically out of known formulated criteria, theoretically and strategically defined. To obtain as big information content about the area as possible, biggest possible variation width needs to be ensured as well as select interview persons with abundant knowledge about the examined area. The latter embraces persons more aware of the situation than others or persons that usually reflect over it. There is a problem though, these persons could also bias the reality and give convincing, but distorted explanations. The character of a qualitative interviewing process is often very private which affect the interviewed person’s willingness to attend in the survey as well as their ability to express themselves. When selecting these methods can be combined but regardless from selection method it is important to ensure that the
27 (Höst, Regnell, & Runeson, 2006), p. 90-91 28
10
selection fits the survey.29 A recording device should always be used but it is important to inform the person being interviewed of this in advance.30
Doing qualitative interviews is a very time consuming and demanding way of gathering information. Information gathering and analysis often slide over each other and qualitative interviews therefore usually switch between information gathering and analyzing it.31
In this master thesis a number of interviews were held with 21 interviewees within different functions and processes at IKEA. These persons possessed relevant knowledge regarding the supplying planning process and year cycles and were in advance informed about the purpose of the interview. Some of the interviews were conducted via an internet meeting, where files and desktops could be shared while communicating through a conference telephone. The reason of this was that a few interview respondents were located abroad. Most of the interviews were held face to face at IKEA of Sweden in Älmhult. An interview guide was prepared to facilitate the conducting of interviews. The interview guide was constructed in a semi-structured way but during interviews the authors realized that this was not appropriate. Instead it became more of a discussion where the purpose of the interview guide was more to secure that all areas were covered. The interview guide is presented in Appendix A. All interviews were recorded and the most relevant information was compiled in an interview protocol which was sent out for validation. In cases were process maps were created by the authors, information from the interviews were used as a base for creating preliminary maps. These were then validated by the interviewees. The maps were converted into IKEA format with the help of a mapping consultant.
2.3.3 Literature studies
Literature studies have the advantage of gathering a great share of information within a short amount of time and with little economical recourses. It is a valuable source to get a hold of existing knowledge and theories concerning a specific area. The disadvantage with literature studies is the fact that it is
29 (Holme & Krohn Solvang, 1997), p.101-105 30 Ibid
31
11
secondary data and therefore the purpose and methods for collecting this information is not always clear.32
In this master thesis literature studies were the main source for creating the theoretical framework and a complementary source for collecting empirical data. It was also used to give the authors more extensive knowledge in Business Process Management and network planning. The literature utilized consists of factual study books and articles and internal IKEA documents.
2.3.4 Questionnaires
Questionnaires consist of a number of questions and answering alternatives which have been standardized and decided in advance. The answering alternatives could be of different character with either defined options or given the possibility to answer more open and descriptive. The way of choosing respondent selection can be varied along with what is hold conveniently to find an answer on the placed questions.33
The advantage with questionnaires is that a big amount of primary data can be collected with help of a relatively small work effort. Contrary it is difficult to get a good picture of the respondent and his function. Body language cannot be read and risks for misunderstanding is in general bigger compared to interviews. It should also be taken into consideration that compared to interviews questionnaires might give briefer answers and bigger internal and external falling off.34
2.3.5 Observations
Observations can be done in many different ways, for example attending or observing. The person being observed could be informed in advance or ”sneaked up on” and a range of different tools can be used, like a timekeeper or just subjective approximations. This data gathering method is often very time consuming but in some cases it results in more objective information.35
32
(Björklund & Paulsson, 2003), p.67, 69
33 (Björklund & Paulsson, 2003), p.68 34 (Björklund & Paulsson, 2003), p.70 35
12
2.4 Validity
Validity can be defined as to what extent measurements measure what they are intended to measure36. Validity can be seen from two different aspects. On one hand there is the theoretical aspect regarding defining and delimiting what is to be measured and the relationship between this and the variables used in the study. On the other hand there is an empirical aspect regarding to be able to prognosticate expected values from one series of measurement. If a study has high validity this means that the measuring instrument shall not generate any systematic errors. This can be obtained by having clear definitions of concepts, knowing what factors that could affect the result and by understanding cause-effects relations.37
The validity of a study can be increased by using several perspectives for achieving the same purpose, for instance measuring the same phenomenon with help from different methods. When using interviews in a study the validity can be increased by asking not biased, explicit questions.38
2.5 Reliability
Reliability can be defined as to what extent a measuring device shows the same results when measuring an object several times39. Repetition of measurement can be replaced by statistical methods that are able to compute the reliability from one series of measurement. When it comes to conducting interviews, afterwards presenting collected data to the respondent in a compiled way can secure that the interviewer has interpreted the data in a right way. When it comes to humans it can be hard to repeat measuring an object because of altered conditions in case of influences and knowledge.40
The reliability of a study can be increased by carefully collecting data and displaying methods of work. When using interviews in a study reliability can be
36 (Höst, Regnell, & Runeson, 2006), p.41 37
(Wallén, 1996), p.66
38 (Björklund & Paulsson, 2003), p.60 39 (Björklund & Paulsson, 2003), p.59 40
13
increased by asking control questions, meaning that the same phenomenon is being measured but in another way.41
The relationship between validity and reliability is described in Figure 1. In the picture to the left both validity and reliability are poor. The picture in the middle illustrates high reliability but low validity and the picture to the right illustrates both high validity and reliability.
Figure 1. The relationship between validity and reliability.42
2.6 Objectivity
Objectivity can be defined as to what extent values of the persons involved in a study affect the results. The objectivity of a study can be increased by illustrating and motivating what choices are being made during a study. In that way the reader is given an opportunity to make up an own opinion about the results and therefore the objectivity of the study increases.43
2.7 Methodology criticism and credibility of sources
According to the authors the purpose of the master thesis and the demands from IKEA enforced the choice of methodological study to be a mix of descriptive and normative. In accordance to this an inductive approach was the most suitable methodological approach. If another study or approach would have been chosen this might had changed the outcome of the master thesis and considering the purpose and time frame also limit the value for IKEA.
41
(Björklund & Paulsson, 2003), p.60
42 Ibid
14
The choice of mostly using qualitative studies when gathering empirical data was considered necessary to be able to fulfill the purpose. Most of the information used needed to be gathered through interviews since the outcome would not have been as fruitful otherwise. To select another technique for data collection was seen as inefficient. Questionnaires were believed to be time consuming and might not had been shown the same interest as interviews. Furthermore questionnaires were considered to create more room for misinterpretation, especially being sent out to different nationalities. The choice of mostly using information gathered through interviews can also be motivated by the fact that it is primary data in contrary to for instance literature studies where information can be biased or not supposed to be used for the same purpose.
The information gathered through interviews was interpreted by the authors. These interpretations were subjective and related with uncertainties. To decrease the risk of possible misunderstandings the interviews were recorded and information was compiled in an interview protocol and sent out for validation. To further validate the answers from the interviews some of the information used was confirmed by other sources independent of each other. This implied that the collected information was of high reliability. The authors cannot guarantee the objectivity of information given even though it was provided by people responsible for the areas being of interest in the master thesis. In spite of this the answers given contained both positive and negative aspects and were believed to present IKEA in a representative way. Considering the secondary empirical data gathered through internal IKEA documents these documents were believed to be of high validity and reliability. This assumption was based on the fact that the company itself uses this information as guidance and as templates for working methods.
The sources used to create the theoretical framework were considered to be of high validity. This because most sources are from factual study books written by researchers or academics with vast knowledge within the concerned areas. The reliability and objectivity were also considered to be high since the different sources contained similar information.
15
3
Theoretical framework
This chapter describes the theories relevant for the master thesis. To be able to grasp parts of the analysis an introduction to Network planning is given and theory regarding processes and the mapping of them is provided to understand parts of the empirics.
3.1 Network planning
The process of project planning is greatly aided by a set of techniques that handles the complexity of the time aspect of the planning.44 These are used for developing a schedule for sequentially interdependent activities and can be useful for both internal and external oriented scheduling. The common name of these techniques is network analysis and the name for using them is network planning. Network planning can be used for bigger projects as well as in smaller assignments.45
The elementary steps in network planning are listed below:
1. Construct a network diagram containing all necessary activities and their precedence relations. A predecessor activity is defined as an activity that immediately precedes another activity without any other activities intervening.
2. Determine the duration of each activity and insert the times into the network.
3. Perform network calculations to establish the aggregated duration and to what degree the activities are critical.
4. If the aggregated completion date is later then necessary, consider modifying the duration so that the actual completion date may be within the required time frame.46
44 (Slack, Chambers, Harland, Harrison, & Johnston, 1998), p.612 45 (Wild, 2000), p356
46
16
3.1.1 Construction of network diagrams
As project complexity increases it becomes more and more necessary to in a logical way visualize the precedence relations of activities needed to complete the project. There are two ways of representing activities with help of network diagrams; Activity on arrow (AoA) and Activity on node (AoN).47 AoN is used as a tool in this master thesis and therefore this method is described more thoroughly but since it is based on AoA both methods are explained.
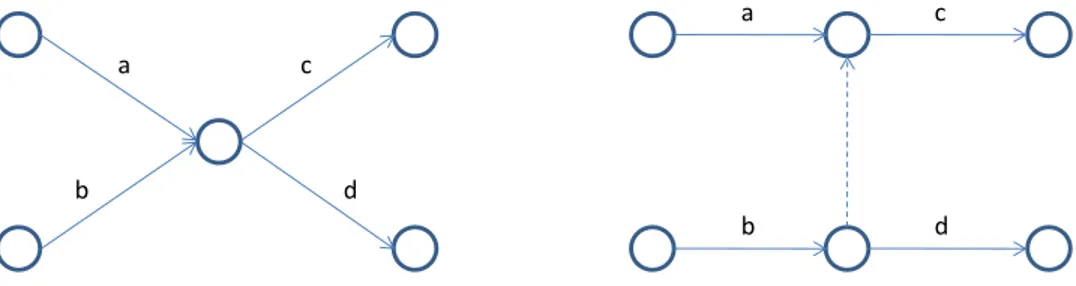
3.1.1.1 Activity on arrow (AoA)
Activity on arrow is the most widely used method for constructing network diagrams and consists of two basic elements: activities and events. An activity is a time consuming task represented by an arrow or line and an event marks the beginning or end of an activity. An event is not time consuming and is represented by a circle. A sequence of events is referred to as a path where the activities are sequential and dependent of each other. Activities occurring in parallel on different paths are independent. A visual representation of an AoA network diagram is shown in Figure 2.
Figure 2. Activity on arrow network diagram.48
It is custom to let time flow from left to right in the diagrams and the event numbers follow the same logic where events with smaller numbers occur before events to the right, containing increasing numbers. Even though time
47 (Slack, Chambers, Harland, Harrison, & Johnston, 1998), p. 614-617 48 Based on (Wild, 2000), p.358 0 3 8 2 d b 1 7 6 5 4 c e a f i h g
17
flows from left to right and precedence relations is shown, the length of the arrows are not related to the actual duration of the activities.49
Three rules for constructing an activity on arrow diagram is presented below: 1. An event cannot be reached until all activities leading to it are
completed.
2. No activity can start until its tail event is reached.
3. No two activities can have the same head and tail events.50
To be able to avoid two activities having the same head and tail event dummy activities can be introduced. These are non time consuming activities whose only purpose is to maintain the logic in the network diagrams. Dummy activities are usually represented by dotted arrows or lines. As an example of how dummy activities are used one can study the four activities seen in Figure 3. The precedence relations for these activities are that c should be preceded by a and
b while d only have to be preceded by b. If a dummy activity is not used the
picture to the left in Figure 3 shows that d must be preceded by both a and b.51 The correct way to construct a network diagram and maintain the logic is seen in the picture to the right in Figure 3.
Figure 3. To the left: Network diagram with incorrect construction. To the right: Network
diagram constructed in the correct way with help of a dummy activity.52
3.1.1.2 Activity on node (AoN)
This method has recently gained popularity because of project management software tools moving away from activity on arrow representations towards
49
(Wild, 2000), p. 356-357
50 (Slack, Chambers, Harland, Harrison, & Johnston, 1998), p.615 51 (Axsäter, 1976), p.29 52 (Axsäter, 1976), p. 30 a c d b a c d b
18
standardized activity on node networks.53 The networks consist of two basic elements: activities and arrows. An activity is a time consuming task represented by a node, often in shape of a box or oval. Arrows are used to connect the activities and define the precedence relations between them. It is custom to let time flow from left to right with the activities occurring first furthest to the left.54
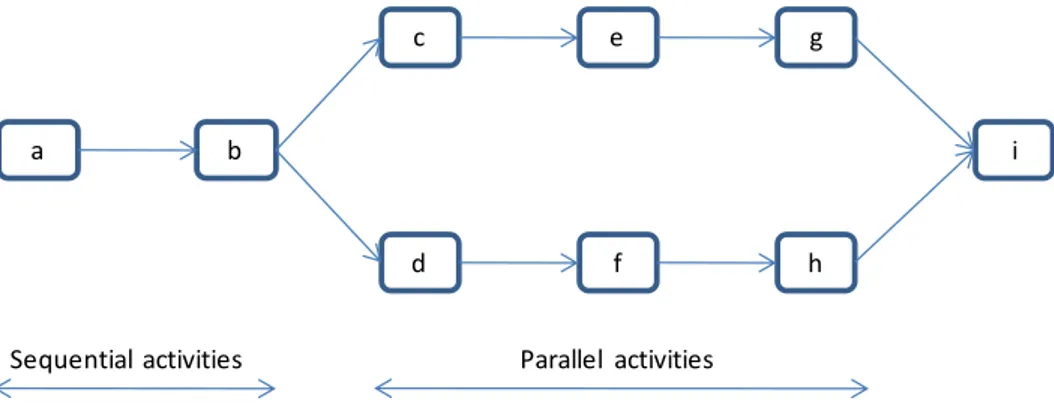
In Figure 4 the activity named a is drawn first because of no predecessor activities. B is to be preceded by a and therefore an arrow is drawn from a, connecting the two activities showing that a must be completed before b can start. Next, both c and d have b as a predecessor activity. This is why their nodes are drawn with arrows coming from b meaning that b must be finished before they can start. At the end of the network diagram activity i has to be preceded by both g and h. The arrows drawn from these to i mean that i cannot begin until both g and h are completed. AoN network diagrams follow the same logic as AoA when it comes to activities and their dependencies.55 In Figure 4 the difference between sequential and parallel activities is presented.
Figure 4. Activity on node network diagram.56
An advantage of using AoN when constructing a network diagram could be that it is often easier to move from the basic logic of a project’s relationships to a network diagram using AoN compared to using AoA. Another advantage is that
53
(Dawson & Dawson, 1995)
54 (Slack, Chambers, Harland, Harrison, & Johnston, 1998), p.617 55 (Wild, 2000), p.357-358 56 Based on (Wild, 2000), p.358 a b c d e f g h i
19
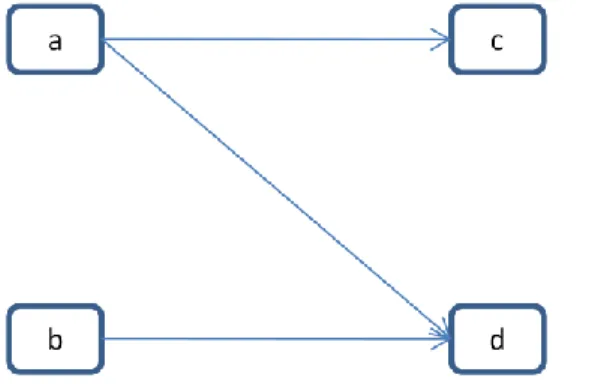
dummy activities are not needed to maintain the logic in the network.57 A visualization of this is shown in Figure 5 where the precedence relations for the activities are that c should be preceded by a and b while d only has to be preceded by b.
Figure 5. To the left: Activity on node Network diagram. To the right: Activity on arrow network
diagram.58
3.1.2 Network diagrams calculations
Network diagrams calculations are primarily used for determining the overall duration for a project so that a completion date can be set or to see what alterations can be made in order to complete in time for a preset finish date.59 Network diagrams calculations for AoA and AoN are performed in much the same way and give the same results.60 Since the activity on node is used as a tool in this master thesis that method is applied when describing the calculations.
3.1.2.1 Earliest start times for activities (ES)
The earliest start time for an activity, i, can be defined as the shortest time from when a project starts till the activity starts.61 Where several activities lead into one activity the succeeding activity cannot start until all preceding activities, k, are completed. This means that the one of these activities that finishes last determines the ES for the succeeding activity.62
𝐸𝑆𝑖 = 𝑚𝑎𝑥𝑘<𝑖 𝐸𝑆𝑘+ 𝑑𝑘 (3.1)
57
(Slack, Chambers, Harland, Harrison, & Johnston, 1998), p.615
58 Based on (Wild, 2000), p.400 59 (Wild, 2000), p.361 60 (Wild, 2000), p.400 61 (Axsäter, 1976), p.31 62 (Wild, 2000), p.361 a c d b b a d c
20
3.1.2.2 Latest finish times for activities (LF)
The latest finish time for an activity, i, can be defined as the time a project finishes minus the durations of all activities succeeding activity i. Where this activity precedes more than one activity, the succeeding activity, k, with the earliest start time will determine the LF for activity i.63
𝐿𝐹𝑖 = 𝑚𝑖𝑛𝑘>𝑖 𝐿𝐹𝑘− 𝑑𝑘 (3.2) When the finish date for a project is not preset the LF for the project is usually set as the earliest start time for the last activity plus its duration. This because a project’s LF should be as early as possible.64
3.1.2.3 Latest start times for activities (LS)
The latest start time for an activity, i, can be defined as its latest finish time minus its duration.65
𝐿𝑆𝑖 = 𝐿𝐹𝑖− 𝑑𝑖 (3.3)
3.1.2.4 Earliest finish times for activities (EF)
The earliest finish time for an activity, i, can be defined as its earliest start time plus its duration.66
𝐸𝐹𝑖 = 𝐸𝑆𝑖+ 𝑑𝑖 (3.4)
3.1.2.5 Float
The earliest finish time for a project is determined by the longest path in the network. As a consequence there are paths in the network where activities have more available time than they require. The difference between available and required time for any activity is called float.
3.1.2.5.1 Total Float
Total Float for an activity, i, can be defined as latest finish time minus the earliest start time, representing the available time, minus the duration of the
63 Ibid 64 (Axsäter, 1976), p.34 65 (Wild, 2000), p.363 66 Ibid
21
activity, representing the required time. This float shows how much an activity can be delayed without delaying the finish time of the project.67
𝑇𝑜𝑡𝑎𝑙 𝐹𝑙𝑜𝑎𝑡𝑖 = 𝐿𝐹𝑖− 𝐸𝑆𝑖− 𝑑𝑖 (3.5)
3.1.2.5.2 Free Float
Free Float for an activity, i, can be defined as earliest start time of succeeding activities, k, minus earliest start time minus the duration of the activity i. This float shows how much an activity can be delayed without delaying a succeeding activity.68
𝐹𝑟𝑒𝑒 𝐹𝑙𝑜𝑎𝑡𝑖 = 𝑚𝑖𝑛𝑘>𝑖 𝐸𝑆𝑘 − 𝐸𝑆𝑖− 𝑑𝑖 (3.6)
3.1.2.6 Critical path
The critical path can be defined as the path in the network where the activities take the longest to complete. The float of these activities is zero and therefore these activities are called critical. Any delay in the activities on the critical path will delay the completion time for the project while activities on other paths at first consume some of the available float, not affecting the completion time of the project.69 Every network has at least one critical path and this path indicates which activities should be supervised more carefully.70
3.1.3 Network Planning example
In Table 1 a list of activities which together represents a small project is presented. The table also shows the precedence relations and the duration of each activity. With help of this information the earliest finish time for the project and ES, LF, LS, EF and float for each activity can be calculated.
Table 1. List of activities which together represent a small project.
Activity Predecessors Duration (days)
a - 6 b - 4 c a 3 d a, b 7 67 (Axsäter, 1976), p.32
68 (Microsoft Office Project Help, 2009) 69 (Wild, 2000), p.364
70
22
The first step is to construct an activity on node network diagram to represent the project. This representation can be seen in Figure 6.
Figure 6. Representation of the project described in Table 1 in form of an activity on node network diagram.
The next step is to calculate the ES for each activity in order to determine the finish time for the project. The project starts at t=0, for instance on the 6th of November. Since a and b have no predecessors their ES is t=0. The ES calculations for c and d follow below.
𝐸𝑆𝑎 = 0 𝐸𝑆𝑏= 0
𝐸𝑆𝑐= 𝐸𝑆𝑎+ 𝑑𝑎 = 0 + 6 = 6
𝐸𝑆𝑑 = 𝑚𝑎𝑥 𝐸𝑆𝑎+ 𝑑𝑎; 𝐸𝑆𝑏+ 𝑑𝑏 = 𝑚𝑎𝑥 0 + 6; 0 + 4 = 6
The ES for the project will then be 𝐸𝑆𝑑+ 𝑑𝑑 = 6 + 7 = 13. Since the completion time for the project should be as early as possible this time is set as the LF for the project. After determining the LF for the project the LF for each activity can be calculated. The LF calculations follow below.
𝐿𝐹𝑑 = 13 𝐿𝐹𝑐 = 13
𝐿𝐹𝑏 = 𝐿𝐹𝑑− 𝑑𝑑 = 13 − 7 = 6
𝐿𝐹𝑎 = 𝑚𝑖𝑛 𝐿𝐹𝑐− 𝑑𝑐; 𝐿𝐹𝑑 − 𝑑𝑑 = 𝑚𝑖𝑛 13 − 3; 13 − 7 = 6
Once the LF for each activity has been determined the total float for each activity can be calculated. The total float calculations follow below.
23 𝐹𝑙𝑜𝑎𝑡𝑎 = 𝐿𝐹𝑎− 𝐸𝑆𝑎 − 𝑑𝑎 = 6 − 0 − 6 = 0 𝐹𝑙𝑜𝑎𝑡𝑏 = 𝐿𝐹𝑏− 𝐸𝑆𝑏− 𝑑𝑏 = 6 − 0 − 4 = 2 𝐹𝑙𝑜𝑎𝑡𝑐 = 𝐿𝐹𝑐− 𝐸𝑆𝑐− 𝑑𝑐= 13 − 6 − 3 = 4 𝐹𝑙𝑜𝑎𝑡𝑑 = 𝐿𝐹𝑑− 𝐸𝑆𝑑 − 𝑑𝑑 = 13 − 6 − 7 = 0
The LS and EF for activities are not needed to calculate float but can be determined by using the following formulas.
𝐿𝑆𝑖 = 𝐿𝐹𝑖− 𝑑𝑖 𝐸𝐹𝑖 = 𝐸𝑆𝑖+ 𝑑𝑖
By itself the activity on node network diagram shown in Figure 6 only shows the precedence relations of the activities. However the nodes can be expanded to display all the information calculated above. The way the information is structured in a node is shown in Figure 7 and a network diagram presenting the additional information is shown in Figure 8. The critical path is represented by the red color and the dates presented are calculated as from the 6th of November. Since Saturday and Sunday are non working days these are excluded in the calculations.
Figure 7. Template for network planning node.71
71
24
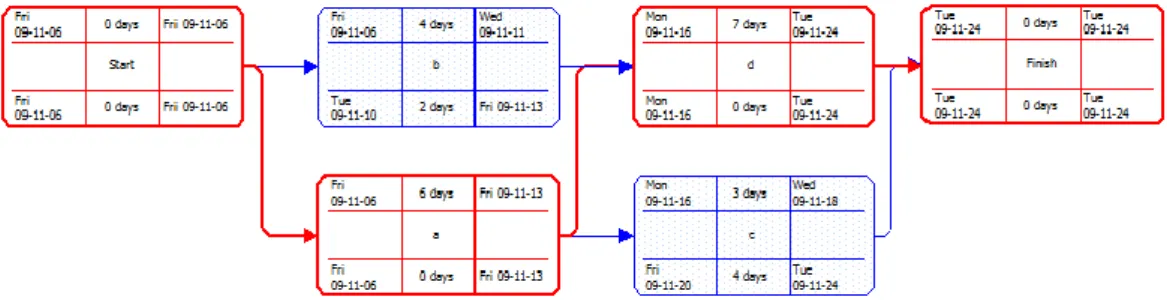
Figure 8. Example of activity on node diagram in Microsoft Project.
In activity on node network diagrams there is often no single point on the network representing start or finish. This can create some confusion, for instance regarding latest finish times for ending activities not critical for the finish time for the project. To facilitate the visual appearance of when a project starts and finishes nodes called start and finish can be introduced.72 An example of this can be seen in Figure 9, otherwise showing the same information as Figure 8.
Figure 9. Example of activity on node diagram in Microsoft Project.
72
25
3.2 Gantt charts
When developing a network diagram it can often be useful to present the activities of a project against a time scale.73 A network diagram in has no timescale but it is possible to come around this problem using a Gantt chart. This technique was first introduced by H.L. Gantt in 1917 and is today one of the most commonly used method for scheduling. Each activity is represented by a bar and the length of a bar is directly proportional to the calendar time, which indicates the duration of each activity.74 The use of Gantt charts to represent activities when using network techniques can be appropriate when developing schedules that need to be communicated to others and visually displayed. The charts can for instance show earliest start date of activities, precedence relations, slack and uses color coding which can be useful to illustrate the critical path. An illustration of a Gantt chart describing activity name, start date, finish date, duration and precedence relations is shown in Figure 10.
Figure 10. Gantt chart of example seen in Figure 9.
Gantt charts are not to be used as an optimizing tool but they provide a simple visual presentation.75 There are two techniques for using Gantt charts as a tool when scheduling; reverse scheduling and forward scheduling. In reverse scheduling the duration of activities required for completing a project are determined by scheduling in reverse from a predefined completion date. In opposite, forward scheduling means that the duration of activities are scheduled from a predefined start date in order to achieve a completion date.76
73
(Wild, 2000), p.384
74 (Slack, Chambers, Harland, Harrison, & Johnston, 1998), p.613 75 (Slack, Chambers, Harland, Harrison, & Johnston, 1998), p.376 76
26
3.3 Process Management
3.3.1 Processes
“A process is a repetitively used network of in order linked activities which uses information and resources to transform object in to object out, from identification to satisfaction of customer need.”77
Apart from shorter definitions it describes what the process consists of and how it is related to the surrounding world. With network thinking it corresponds better to reality than with a strict sequencing view and it has a distinct start and end, starting with customer need to satisfaction of it. The definition also illustrates the importance of adding information and resources to make the transformation possible, creating value. An organization’s choice of definition is critical because it is steering the view upon process work, what is included and what is excluded, what methods are being used and outermost what results are achieved.78
3.3.2 Process orientation
Process orientation aims to change the function orientated viewpoint on the organization. This means shifting to a process perspective on organizational form, systems, structures as well as attitudes, valuations and organization culture. If a business discovers and appreciates the process concept, a work of change usually takes place with the purpose to adapt the business to a new paradigm. Process orientation then implies processes as a benchmark for the way of seeing, designing, prosecute and develop the business. Many organizations though, have with awareness chosen not to see process orientation as something that demands a paradigm shift. The work of change might then influence a process orientated approach and the way of working but within a remaining unaffected structure.79
The view upon the business is very important because it is first when process orientation is fully used it can benefit from all new perspectives and advantages within it. The business is then acknowledging and utilizing processes as the structure creating customer value. Functions power to lead and develop the
77 (Ljungberg & Larsson, 2001), p.44 78 Ibid
79
27
business has been bereaved but their status is at least as high as before because they have transformed into competence- and resource centers.80 Building and managing the organization’s knowledge assets are key components to create value and to help sustain competitive advantage.81
3.3.3 Process identification
A condition to be able to control and develop the processes of an organization is to be able to identify and understand different types of processes. There are mainly three types of processes that are crucial to be identified in order to describe an organization in a proper way. These are core processes, support processes and steering processes. Core processes describe the most important value creating parts on a general level and give an overview of the organization. Supporting processes are not value creating themselves but are needed in order to support and make the core processes work as good as possible. Steering processes are needed to steer and coordinate the core and support processes.
3.3.4 Process documentation
To secure that work in the process is performed in a uniform and agreed way process documentation is important. This documentation consists of a number of various documents with different purposes. It includes process maps, working methods and other documentation which offer a broad picture of the process and how value is created. Good process documentation is useful in different situations for different persons and is the foundation for guiding the work in processes, educate and create understanding for the process and to analyze and improve the process.82
Something to be aware of regarding process documentation is that there is a difference between understanding the documentation and implementing it. Therefore, when documenting processes, it helps to consider who needs to review the process information, and for what purpose. People who need to implement them need to know what is supposed to take place and for what
80 Ibid
81 (Weinrach, 2006) 82
28
reason. Another reason for process documentation is to not forget about the processes when distracted by other challenges.83
It is also important that the people responsible for the process documentation are knowledgeable about two types of knowledge that they acquire. There is a distinction between information and know-how and if it is tacit or explicit knowledge. Tacit knowledge is subconsciously understood and applied, difficult to articulate and developed from direct experience and action. It is usually shared through highly interactive conversation, storytelling, and shared experience. Tacit knowledge may hinder efforts of documenting a process, but it can be converted to explicit knowledge which is more precisely and formally expressed.84
3.3.4.1 Process mapping
Process maps are graphical illustrations, representing the events and sequences of activities of a process. Main reasons are to detect value adding and non-value adding activities and to simplify work. It is a tool for studying or analyzing a process or parts of a process. Process mapping is not a solution in itself but identification of how a process or current system operates is essential for identifying improvement opportunities.85
The purpose of process maps are most commonly process improvement and any process can be improved whether it has problems or not. The documentation gives a clear picture of the process which helps the analyst to easier identify problems and improvement alternatives. Complicated processes, defective output, unnecessary inspections, waiting and duplication of effort are some problems that can be detected by process documentation. This is why processes must be mapped and documented. If critical measures of performance such as cost, quality, service, job satisfaction and speed are in need of dramatic improvements, process documents are needed for reengineering purpose. This is a fundamental rethinking and radical design of business processes.86 Current status, “As Is”, of a process must be well
83
(Weinrach, 2006)
84 (Ungan, 2006)
85 (Savory & Olson, 2001) 86
29
understood before improvement areas can be identified and redesigned, developing a “To Be” map.87
The level of detail in mapping can vary depending on the purpose of documentation. Different segments may need different level of detail in maps and analysis depending on standardization purpose (very detailed), reengineering purpose (detailed) or how well a segment is working or not (more detailed if not). Sufficient level of detail is needed in problem areas to identify root causes of process problems. The level of detail will determine the type of knowledge to be acquired. When creating a detailed map, tacit knowledge is more likely to be acquired which will require a team. If only an overview of the process is needed, the map should not be detailed and an interview will be enough to document it.88
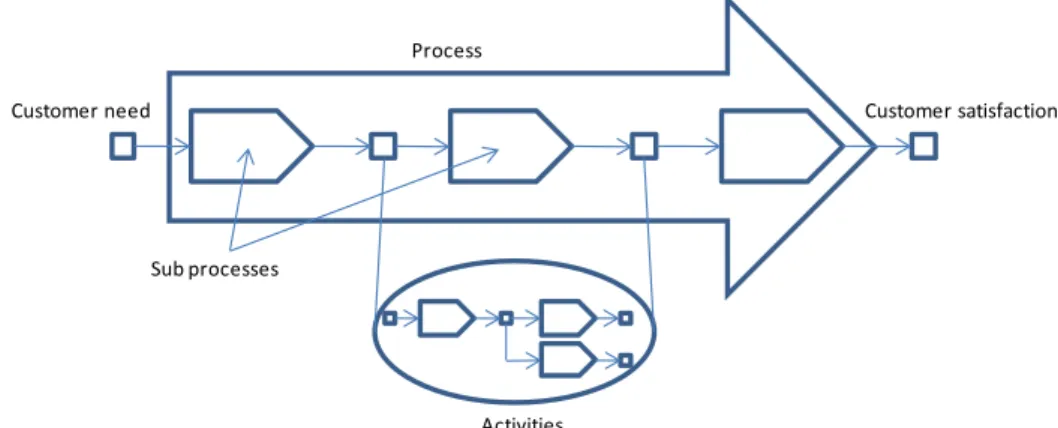
Processes are like all other systems related to other processes and can be named differently regarding to level of detail. A process is built up by parts of processes which in their turn are built up by activities. Sub processes are then inferior to processes and activities are inferior to sub processes as can be seen Figure 11.89
Figure 11. Process, sub processes and activities.90
87
(Savory & Olson, 2001)
88 (Ungan, 2006)
89 (Ljungberg & Larsson, 2001), p. 193 90
Based on (Ljungberg & Larsson, 2001), p.193
Sub processes
Process Customer need
Activities
30
Recommended definition of a process contains five key words or “process components” which are object in, activities, resources, information and object
out. The concepts and relations between them are explained below and can be
seen Figure 12.91
Figure 12. Process components.92
Object in – Starts the process and in the ideal case value is added to this
while the process runs. Object in comes out of the closest preceding activity or process, an internal or external supplier and represents a more or less expressed need. Activities within the process will not be able to initiate without object in, or objects in if many. Object in “triggers” the process.
Activities – A sequence of actions that refines object in or other input.
Resources – What is needed to perform the activity.
Information – Supports and/or steers the process. Information
facilitates to execute the process and have an effect on the performance. Information is normally not obtained from closest preceding activity in the process but from supporting processes.
Object out – The result of an activity’s transformation that takes place
when an activity meets resources. Object in or other input in form of information are transformed into an object out. Object out becomes object in for the closest succeeding activity or sub process. The process
91 (Ljungberg & Larsson, 2001), p.194 92
Based on (Ljungberg & Larsson, 2001), p.194
Activity
InformationResources Transformation
31
is built up by a network of activities where the last activity’s object out is the same as for the superior process. Resources like persons, equipment, facilities etc. are fixed to activities and sub processes and do not follow the objects through the process. Activities as well as resources affect the quality of an object out to a large extent.93
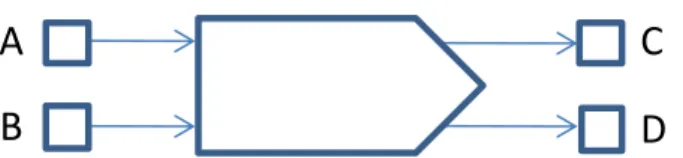
An activity can be connected to many different objects, both to start the process and the outcome of it. Some examples are illustrated in Figure 13 and Figure 14.94
Figure 13. Both object A and B needs to start the process. Both object C and D come out of the
process.95
Figure 14. Either object A or B needs to start the process. Either object C or D comes out of the
process.96
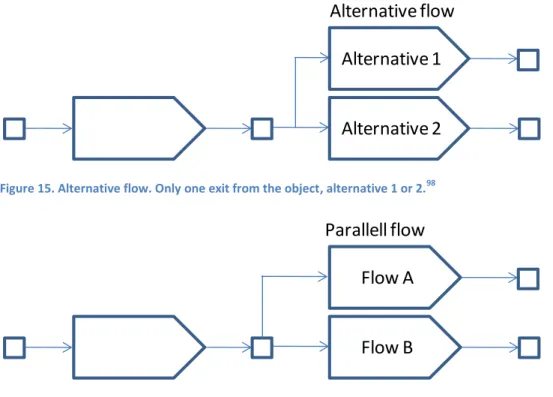
These types of connections can be applied on different types of flows within the process as well. Some examples are illustrated in Figure 15 and Figure 16.97
93 (Ljungberg & Larsson, 2001), p.195 94
(Ljungberg & Larsson, 2001), p.210-211
95 Based on (Ljungberg & Larsson, 2001), p.210-211 96 Based on (Ljungberg & Larsson, 2001), p.210 97
(Ljungberg & Larsson, 2001), p.211
A
B
C
D
A
B
C
D
32
Figure 15. Alternative flow. Only one exit from the object, alternative 1 or 2.98
Figure 16. Parallel flow. Two exits from the object, both flow A and B.99
A process map needs to be honest and reflect the reality as it is in order to be useful for steering and developing the process. It should be easy to understand and include the most important components. A balance between user friendliness, content of information and to present the information in a right way is to be obtained. Objects and activities should have suitable names and as few symbols as possible should be used. Processes should be presented from left to right and the map should also be logical, with hierarchic relations between various levels of detail so that start and end point are the same no matter level of detail.100
To describe the difference between a project and a process a road could be used as a metaphor for the processes. It is a structure that is used over and over while a project could be seen as a specific journey on that road. Working project oriented does not mean working process oriented though. There are organizations working in projects who do not take care of their processes and
98 Based on (Ljungberg & Larsson, 2001), p.211 99 Ibid
100
(Ljungberg & Larsson, 2001), p.212-214
Alternative 1
Alternative 2
Alternative flow
Flow A
Flow B
Parallell flow
33
this makes the purpose to improve a process as a whole difficult. The improvement implies to obtain a road as straight as possible and most of all make it to start and end in the right place.101
3.3.5 Measuring Processes
The purpose of measuring processes is to create knowledge which creates understanding and understanding is an important condition for development and improvement. Conducting a measuring system should pay big attention to chose and decide what to be measured as well as measuring it in the right way. To be able to do this it is also important to know why to measure it. To create the foundation of a process measuring system an inventory of the stakeholders’ needs is therefore essential, measurable or not. These needs are established by external customers, the process in itself, internal strategy and organizational objectives. First then, needs are expressed in measurable terms and where no possible figures are available it is better to measure something that co-varies with intended measuring object. This to give some information even if it is not that precise. It is better to be approximately right than exactly wrong. Work with identifying and deciding measures favorably starts on main process level and continues to its parts of processes and should be started from the end of the process working towards the process beginning.102 When effective process measures are established, findings that subtracting rather than adding measures can actually improve the process.103
When process mapping is in progress two sets of measures regarding to process performance can be collected. One set is broad in scope and applicable to all processes including cycle time, cost and quality. The other set includes effectiveness, efficiency and adaptability. Effectiveness measures how well objectives for the current process are achieved while efficiency express the amount of effort and resources needed to achieve the objectives. Adaptability indicates how quickly and easily the current process can be changed in order to meet various objectives.104
101
(Ljungberg & Larsson, 2001), p.47, 51
102 (Ljungberg & Larsson, 2001), p.215-259 103 (Weinrach, 2006)
104
35
4
Empirical study
This chapter describes the process structure at IKEA and the activities connected to the mid term capacity planning. The time aspects and precedence relations between activities are also explained in order to provide the full picture and to facilitate the analysis. The empirical study is mainly based on information given by the interviewees and statements in this chapter are taken from this information.
4.1 IKEA process structure
IKEA has three main processes and their shared aim is to transform customer need into customer success with help of their individual missions. The three main processes are described below and can be seen in Figure 17.
Creating the home furnishing offer – The mission is to create and
develop a product range that improves the everyday life at home. This with help of good function, design and customer experienced product quality at a low price.
Supplying – The mission is to make IKEA product range available for the
customers. This by buying, producing and distributing the goods at the highest possible customer experienced quality, under good social and environmental conditions at the lowest total cost.
Communicating & Selling – The mission is to in an inspiring way help
customers prepare, select and buy from the product range in store catalogue or other media.