Research
Monte Carlo patient-specific
pre-treatment QA system for
volumetric modulated arc therapy
2017:13
Authors R. Chakarova R. Cronholm P. Andersson M. Krantz
SSM perspective
Background
The clinical use of volumetric modulated arc therapy (VMAT) has aug-mented rapidly since it became commercially available. As a result, the need for comprehensive quality assurance (QA) has increased.
Current practices in Sweden normally compare the delivered dose with the planned dose based on measurements with different methods, for instance: portal dosimetry, point dose verification and/or dose distribu-tion verificadistribu-tion performed in a homogenous phantom.
One drawback is the difficulty to interpret deviations between predicted and measured doses, if the deviation is caused by failures of the acceler-ator performance or the theoretical patient dose distributions. Another weakness is that the recalculations are performed for a homogenous phantom and not for the real patient. Furthermore, there are a resolu-tion limitaresolu-tions caused by the distance between the detectors in dose verification phantoms.
Objectives
The project objective was to develop a Monte Carlo (MC) patient-spe-cific pre-treatment QA system for VMAT technology. The system ought to be able to evaluate dose-planning distributions in the patient geometry. Objectives in the system include the establishing of tools for MC calcu-lations of VMAT dose distributions in patient geometries, the develop-ing of tools for quantitative analysis and the performdevelop-ing of retrospective calculations and analysis.
The Swedish Radiation Safety Authority’s intention with the project is to contribute to a safer radiotherapy. Furthermore, the authority would gain knowledge and support for formulation of regulations and supervi-sion. This project result in new methods for quality assurance for these kinds of patient treatments.
Results
The project developed a MC patient-specific pre-treatment QA system. The system allows the calculation and evaluation of dose distributions for VMAT plans in patient geometry based on CT images. The QA system was tested by performing retrospective analysis of radiation therapy plans created for treatment of cancer.
An advanced software tool was developed for generation of MC compli-ant voxel phcompli-antoms from patient DICOM data.
A stand-alone analysis module was also developed to perform quantita-tive calculation of deviations between planned and MC dose distribu-tion. Gamma evaluation is implemented as well as the more advanced normalized dose difference method.
Project information
Contact person at SSM: Mauricio Alvarez Reference: SSM2015-412
2017:13
Authors: R. Chakarova 1,2), R. Cronholm 3), P. Andersson1), M. Krantz 1)
1) Department of Medical Physics and Biomedical Engineering,
Sahlgrenska University Hospital, Gothenburg
2) Department of Radiation Physics, Sahlgrenska Academy at the
University of Gothenburg
1) Department of Radiation Physics, Skåne University Hospital, Lund
Monte Carlo patient-specific
pre-treatment QA system for
volumetric modulated arc therapy
This report concerns a study which has been conducted for the Swedish Radiation Safety Authority, SSM. The conclusions and view-points presented in the report are those of the author/authors and do not necessarily coincide with those of the SSM.
Sammanfattning
Intensitetsmodulerad rotationsbehandling, (VMAT), är en behandlingsteknik där strål-ningen levereras av en linjäraccelerator med kontinuerligt roterande gantry i kombination med varierande dosrat och dynamisk kollimatorrörelse som genererar oregelbundna öpp-ningar. Patientspecifika kontroller, som syftar till att testa de planerade tekniska paramet-rarna och att verifiera den teoretiska dosfördelningen, måste utföras inför varje behand-ling. Enligt dagens tillgängliga metoder är dessa moment omfattande och brister vad gäller analys av tredimensionell dosfördelning i patientgeometri.
Inom ramen av detta projekt har ett kvalitetssäkringssystem för dynamiska rotationsbe-handlingar utvecklats med hjälp av Monte Carlo-simuleringar (MC). MC anses gälla som referensmetod vad gäller simulering av strålningens växelverkan. En oberoende kontroll av den planerade dosfördelningen utförs på patientens CT-underlag för den aktuella be-handlingsplanen. Kvalitetssäkringssystemet testades genom att utföra retrospektiv analys av patientplaner som använts för behandling av cancer i prostata, cervix, uterus samt huvud-hals-området.
Implementering av MC baseras på ett programpaket, EGSnrc/BEAMnrc, som är världs-ledande inom sitt fält. Modeller av Varians acceleratorer; Clinac iX och TrueBeam, vali-derades för två typer av flerbladskollimatorer; Millennium 120 MLC och HD MLC. Pati-entmodellen vidareutvecklades att hantera bl.a. olika orienteringar och behandlingsbord. MC dosfördelningar resulterar i absorberad dos till medium och absorberad dos till vat-ten, formaterade som DICOM-objekt som kan återimporteras till dosplaneringssystemet för visuell granskning och jämförelse av dos-volym-histogram. En separat stand-alone-modul har även utvecklats som utför en mer avancerad analys baserad på gammameto-den och på gammameto-den s.k. Normalized Dose Difference-metogammameto-den. Modulen har ett användarvän-ligt gränssnitt som visualiserar vilken dosfördelning som dominerar och i vilka områden skillnaden överskrider toleranserna. Resultaten kompletteras med en statistisk analys (passing rate).
Arbetet fortsätter med insamling av kliniskt relevant data som ska analyseras för eventu-ella skillnader inom de olika diagnosgrupperna. Analysen ska sedan ligga till grund för utarbetning av toleranskriterier och därmed kvalitetssäkring av de kliniska planerna.
Content
Sammanfattning ... 1
Abbreviations and notations ... 3
1. Background ... 4
2. Project objective ... 5
3. Material and methods ... 6
3.1. Validation of the accelerator models ... 6
3.1.1. Open fields ... 6
3.1.2. Absolute dose calibration ... 7
3.1.3. Multileaf collimators ... 7
3. 2. Patient modelling ... 9
3. 3. Dose calculations in patient geometry ... 9
3. 4. Dose distribution comparison, analysis ... 10
3. 5. Clinical material ... 11
4. Results and discussion ... 12
4.1. Validation of accelerator models ... 12
4.1.1. Open fields ... 12
4.1.2. Absolute dose calibration ... 12
4.1.3. Multileaf collimator ... 13
4.2. Monte Carlo QA Workflow ... 14
4.3. Evaluation of MC and clinical dose distributions in the TPS ... 16
4.4. Evaluation of MC and clinical dose distributions in the analysis module ... 17
5. Summary ... 20
6. References ... 21
Appendix A: Detailed result for validation of open field profiles for TB accelerator ... 23
Abbreviations and notations
AAA – anisotropic analytical algorithm
AXB – Acuros XB
CAX – central axis
CCC – collapsed cone convolution
CT – computed tomography
DVH – dose volume histogram
EPID – electronic portal imaging device
HD MLC – high definition multileaf collimator
MADD – maximum allowed dose difference
MC – Monte Carlo
MLC – multileaf collimator
MU – monitor unit
NDD – normalized dose difference
PHSP – phase space file
QA – quality assurance
SCD – source collimator distance
SSD – source surface distance
TB – TrueBeam
TPS – treatment planning system
VMAT - volumetric modulated arc therapy
1. Background
The clinical use of volumetric modulated arc therapy (VMAT) has increased rapidly since it became commercially available. Consequently, the need for comprehensive quality assurance (QA), covering different aspects of this technique, has increased. Machine QA procedures are introduced to test and to monitor the technical precision of gantry rotational speed, dose rate variation and the field shape modulation by complex dynamic movement of a multileaf collimator (MLC). Other aspects reflect dosimetry related issues. VMAT plans encompass highly irregular small beamlets, e.g. small MLC openings and single MLC leaves sticking out into the beam. The non-reference dosimetry conditions require thorough validation of the calculated dose distributions for each patient plan.
Different approaches for patient specific pre-treatment QA can be implemented. The current practice at Sahlgrenska University Hospital is based entirely on measure-ments. The protocol comprises three distinct procedures; a portal dosimetry (elec-tronic portal imaging device, EPID) verification of the fluence (i), a point dose veri-fication (ii) and dose distribution veriveri-fication (iii). In (ii), VMAT plans are recalcu-lated on a cylindrical plastic phantom followed by point measurements by farmer ionization chamber. In (iii), calculations and measurements are performed on a Del-ta4-phantom (ScandiDos AB), equipped by two slantwise-coupled diode matrices.
The response is processed by the Delta4 software producing quasi-3D dose
tion in the phantom, which can be further compared with the corresponding distribu-tion calculated by the treatment planning system (TPS). One apparent drawback of such an approach is the difficulty to interpret potential deviations between predicted and measured dose, i.e. to identify whether deviations are caused by failures of the accelerator performance causing inconsistency in the machine parameters, or the de-viations are reflecting uncertainties in the theoretical dose distributions. Furthermore, there are resolution limitations. For example, the diodes in the Delta4-phantom are placed 5 mm apart. Another weakness is the fact that recalculations are carried out for a homogeneous phantom, which greatly simplifies the result and obscures the evaluation of clinical effects.
The dosimetric reliability of the QA procedure can be considerably improved by em-ploying an independent dose calculation system, capable to verify the planned dose distribution in the patient geometry. The Monte Carlo (MC) method has been widely used as a reference method for evaluation of the accuracy of algorithms in the TPS. Recent development of the EGSnrc/BEAMnrc software [1, 2], dedicated to radiation treatment applications, enables computation of dose distributions due to a continu-ously variable beam configuration, as in the VMAT case [3]. This opens possibilities to move from pre-treatment phantom measurement QA for each patient plan, towards 3D dose recalculation in patient geometry using a MC method for each VMAT plan. Enhanced machine control and in vivo monitoring of machine log files, reflecting the technical parameters of the dynamic motion may complement the QA procedure. Ex-tensive clinical record with over 2500 VMAT patient plans verified by the MC method is reported in the literature [4]. In this reference, the Swedish experience is cited, in particular, the MC validation of 100 clinical VMAT plans at Skåne Univer-sity Hospital.
2. Project objective
The overall objective is to develop a Monte Carlo patient-specific pre-treatment QA system for volumetric modulated arc therapy capable to evaluate planned dose distri-bution in the patient geometry based on CT images.
Interim objective includes:
Developing modules for MC calculation of VMAT dose distribution in the patient geometry
Developing of tools for quantitative analysis and validation of the dose distribution obtained by the clinical dose calculation algorithms with the MC dose as a reference.
Performing retrospective calculations and analysis by the MCQA system and preparation for prospective clinical implementation.
3. Material and methods
The work is focused on the Varian implementation of VMAT (Varian Medical Sys-tems, Palo Alto, USA). Treatment delivery by Clinac iX as well as TrueBeam (TB) accelerators is considered. These accelerators are equipped with Millennium 120 MLC or Millennium High Definition MLC (HD MLC). VMAT treatment plans are regarded, involving 6 MV flattened photon beams, generated in Eclipse TPS version 11.0.
The MC code package EGSnrc (v4-2.4.0, March 2013) [1] is utilized for particle transport. Specific codes dedicated to external radiotherapy based on EGSnrc are im-plemented as follows. Particle transport in the accelerator head is conducted within BEAMnrc code [2], while calculations of dose deposition in patient/phantom are per-formed using DOSXYZnrc code [5]. Phase space files (PHSP) are employed, pro-duced by BEAMnrc, containing full information (charge, energy, position and direc-tion) about the particles crossing a virtual scoring plane perpendicular to the beam central-axis. Unless explicitly stated otherwise, DOSXYZnrc calculations are carried out using source number 20 [6]. The scheme described above will simply be referred to as MC simulation. Different simulation steps and their validation are described be-low.
3.1. Validation of the accelerator models
A MC model of a 6 MV Clinac iX accelerator head aiming at non-MLC shaped fields has been developed earlier at Sahlgrenska Hospital when following technical specifications supplied by the vendor [7, 8]. Based on the model, a PHSP is produced at a plane above the secondary collimators (i.e. above the jaws). For the TB, the ven-dor supplies a PHSP scored above the secondary collimators, rather than any tech-nical specifications for the linear accelerator head. These phase space files, hereafter referred as phspiX
aboveJaw and phspTBaboveJaw, respectively, constitute the starting point
for all subsequent MC simulations.
3.1.1. Open fields
MC results for open fields are validated against measurements in water obtained ear-lier at accelerator commissioning or for configuration of TPS. The measurements were conducted using a CC13 ionization chamber (IBA dosimetry GmbH, Schwarzenbruck, Germany) placed in a Blue Phantom2 (IBA dosimetry GmbH, Schwarzenbruck, Germany) while the data control and acquisition were handled by OmniPro Advance (IBA dosimetry GmbH, Schwarzenbruck, Germany).
The MC simulations replicate the measurement geometry in terms of water phantom, field size, source surface distance (SSD), depths etc. Rather than simulating the actu-al detector, dose is scored in water voxels of 0.25x0.25x0.25 cm3 size. The number
of histories is chosen so that the statistical uncertainty remains below 0.5% for the largest depth at which lateral profiles are evaluated. Measurements and simulations are normalized to 100% at 10 cm depth using a second degree polynomial fit of the
depth dose curve in the range [5, 20] cm. Lateral profiles are fit to a second degree polynomial in the range [-10%, 10%] of the particular field size. They are normal-ized by the respective value along the beam central axis (CAX) as taken from the depth dose curve. MC data are compared to measurements using local dose deviation as well as gamma evaluations. Two criteria are used in the gamma evaluation; 1%/1 mm (super strict) and 2%/1 mm (strict). A lower cut off is implemented at 25% of the maximum dose for the profile under investigation.
3.1.2. Absolute dose calibration
The dose obtained in the MC simulations is in units gray (Gy) per incident particle. Conversion to absolute dose, i.e. Gy per monitor unit (MU), is performed by follow-ing the protocol in [9]. A calibration factor is determined relatfollow-ing simulated, DselMC,
to measured doses, Dselmeas , in selected geometries:
KMC = DselMC/ Dselmeas
Three depths along the CAX for three different field sizes are considered and KMC is
computed as the average ratio for these nine data points. Each depth dose curve is fit-ted to a second degree polynomial approximation in the range [5, 20] cm in order to reduce the noise effects. The voxel size is set to 0.5x0.5x0.25 cm3. The number of
histories is chosen so that the statistical uncertainty is below 0.25% for the largest depth.
The absolute dose for the Clinac iX accelerators is further corrected for backscattered dose to the monitor chamber using an experimentally derived expression for the backscattered factor (BSF) [8]. For TB accelerators, BSF is set to unity for all field sizes, as suggested by [10]. Finally, the Monte Carlo dose in Gy per incident particle, DMC, is converted to dose in Gy, DMC,abs, for a beam with number of MU equal to U,
by the following expression:
DMC,abs = DMC *KMC *U *BSF
3.1.3. Multileaf collimators
The commissioning of the MLC components is especially important when simulation VMAT treatment plans will be carried out, since the beams consist of heavily modu-lated MLC segments.
Models of two different MLC types are developed and validated in this work; Mille-nium 120 MLC for Clinac iX, (denoted as MLCiX), and HD 120 MLC for TB accel-erators, (denoted as HDMLC). The BEAMnrc component modules SYNCVMLC and SYNCHDMLC are utilized for MLCiX and HDMLC, respectively. The tech-nical specifications from the vendor are followed when designing the MLC.
The exact composition of the MLC material is not specified by the vendor beyond the relative fraction of tungsten. According to [11] the composition of MLCiX is 90.0% tungsten, 6.0% nickel, 2.5% copper and 1.5% iron. This is in contradiction
with the tungsten fraction given by the vendor [12, 13]. The MLC materials are de-fined in our work by accepting the fraction of tungsten as specified by the vendor and assigning for the remaining fraction the same relative distribution of the balance materials as suggested by [11]. Furthermore, the vendor specifies the density for HDMLC, while a range of possible densities is given for MLCiX.
Thus, the following parameters need to be adjusted in order to completely describe the MLC components: i) MLC bank offset (i.e. the physical position of the first MLC leaf pair, ii) the density for MLCiX and the thickness for HDMLC and iii) the posi-tion along the beam axis (i.e. the source collimaposi-tion distance, SCD).
In order to determine the MLC bank offset, profiles perpendicular to the MLC mo-tion are simulated for a MLC shaped field where only the two central leaf pairs are open. Different positions of the first MLC leaf are assumed and the parameter chosen corresponds to the case where the geometrical center of the profile is perfectly aligned with the beam CAX. The procedure, in the case of HDMLC, is illustrated in Fig. B1 Appendix B
The MLCiX density and HDMLC thickness are determined by adjusting the theoret-ical transmission/leakage dose to the measured values obtained during accelerator commissioning. The dose is calculated for a field completely blocked by MLC,
Dyblocked , and for a field with MLC fully retracted, DCAXopen. The dose for MLC
blocked field is estimated as the average dose for range [-2.0, +2.0] cm perpendicular to the MLC travel direction. The average transmission/leakage is obtained by
The simulations reproduce the measurement geometry except for scoring dose to the phantom rather than to the detector material. The voxel size is set to 1.00x0.05x1.00 cm3, where the small axis was perpendicular to the MLC travel direction. The
num-ber of histories is chosen so that statistical uncertainty below 0.5% within the colli-mator shaped field is obtained. Simulated transmission/leakage profile for MLCiX is shown in Fig. 2 Appendix B and the procedure for determination of MLCiX density and HDMLC thickness is illustrated in Fig. B3, Appendix B.
The SCD for the MLC is determined by simulation of dynamic fields consisting of a number of sliding leaf openings of various widths, (the narrowest being 9 mm), al-ternated by fully closed leaf pairs (Varian MLC sequence known as Aida). The SCD is adjusted by comparison of the MC simulated profile with the TPS calculated pro-file and with measurements.
Film measurements in Gammamex 457CTG solid water at 5 cm depth and SSD 95 cm are performed using Gafchromic EBT3© film (Ashland, Covington, USA) using a dual exposure method developed at Sahlgrenska Hospital [14]. Pre-irradiation with a known homogeneous dose is applied to extract information about film sensitivity on a pixel level. The film is scanned before exposure, after pre-irradiation and after irradiation with the dose pattern of interest. An Epson Expression 1680pro flatbed scanner (Seiko Epson, Suwa, Japan) is used. Calibration curve specific for the film batch is applied to convert optical density to dose based on nine dose levels up to 3 Gy. The scan information is processed in a MatLab® (Mathworks, Natick, USA)
based analysis module and further evaluated in RIT113© software (Radiological Im-aging Technology, Colorado, USA).
The MLC models are validated also by a number of static and dynamic MLC fields, e.g. sliding windows with different gap widths, dynamic MLC movement forming chair pattern, etc.
An alternative approach for simulation of MLCiX and dynamic motion, known as particleDMLC, is also studied as suggested by [15]. It is implemented as dynamical-ly shared library [6]. MLC geometrical details in particleDMLC are considered with great accuracy, whereas the particle transport through the MLC component is simpli-fied considering first order Compton scattering only, in order to speed up the calcula-tions. Several parameters in particleDMLC configuration are tuned in the present work in order to reproduce the accelerator specific inter- and intra-leaf leakage and MLC calibration. Results from transmission measurements at accelerator commis-sioning are used to determine the MLC density parameters. Additional measurements are performed by Semiflex ionization chamber (PTW, Freiburg, Germany) at select-ed points in solid water phantom for closselect-ed MLC as well as for 5 mm and 10 mm MLC slot moving across a static jaw field in order to obtain the parameters Physi-calLeafOffset and tipDistance.
3. 2. Patient modelling
Correct tissue segmentation and interpretation of the mass density is an important step in the MC dose calculations. The formalism described in [16, 17] is accepted here. Patients were scanned on Toshiba Aquilion LB (Toshiba Medical Systems, To-kyo, Japan). The particular CT calibration curve (HU versus mass density) is taken into account in the patient modeling. Nine tissues are included in the segmentation: air, lung, adipose and muscle tissues, as well as five bone tissues obtained by inter-polation of bone mass density and composition between trabecular and cortical bone. The software, CTC_auto, generating Monte Carlo compliant voxel phantoms from DICOM data is developed. CTC_auto is based on CTC_ask [16], with the fundamen-tal differences that it is written in python, is interaction-free, has ability to handle any patient orientation as well as to include treatment couch, if the couch is defined as a structure in the DICOM RT Struct file. Inclusion of the treatment couch and the abil-ity to handle any possible patient orientation are both unprecedented features of a code converting DICOM data to Monte Carlo compliant phantoms. The phantom resolution, (i. e. voxel sizes), is based on the dose calculation grid information from the TPS as stored in the DICOM RT Dose files.
3. 3. Dose calculations in patient
geome-try
The dose distribution obtained by DOSXYZnrc represents dose to medium, i.e. to the tissue material assigned to the particular voxel. Some TPS algorithms (e.g. AAA) re-port dose to water, i.e. dose to a small water volume inserted in the tissue of interest, while others report dose to medium (e.g. collapsed cone convolution (CCC)). There
is no consensus in the literature which presentation of the dose that is the correct one. Some TPS algorithms, e.g. Acuros XB, can be configured to report dose either to medium and water.
It has been demonstrated that Spencer-Attix mass restriction stopping-power ratios, denoted as Sw,m, can be applied as conversion factors between the two quantities
[18]. Furthermore, a single correction factor can be applied for each particular medi-um for a given photon beam energy. In this work, mass restriction stopping-power ratios are calculated by the EGSnrc code SPRRZnrc for all the materials used in the MC tissue segmentation (Table 1). The data obtained are further implemented for each voxel of the dose distributions in the patient geometries. Thus, the MC QA sys-tem developed here has the possibility to report both, dose to medium and dose to water. Python based code is developed to convert the DOSXYZnrc 3ddose format to DICOM format to enable import in the TPS.
Medium Sw,m Medium Sw,m Medium Sw,m
Air 1,1166 Muscle 1,0097 Bone 3 1,0953
Lung 0,9980 Bone 1 1,0363 Bone 4 1,1304
Adipose 0,9810 Bone 2 1,0664 Bone 5 1,1493
Table 1. Calculated Spencer-Attix mass restriction stopping-power ratios for the ma-terials used in the MC tissue segmentation.
3. 4. Dose distribution comparison,
anal-ysis
The clinical dose calculation algorithms currently available in Eclipse TPS at Sahlgrenska Hospital are AAA v. 11.0.31 and AXB v. 11.0.31. VMAT plans are de-signed by AAA, whereas AXB has been recently introduced and its clinical imple-mentation is under preparation. Thus, the dose distributions obtained by MC simula-tions are further compared with AAA and Acuros ones. Two strategies are imple-mented; comparison within the TPS as well as evaluation in a separate analysis mod-ule developed in this work.
In the first case, the MC dose distributions in DICOM format are imported to Eclipse where tools like visual inspection, isodose lines and DVH comparisons for target and risk organs are available.
More sophisticated quantitative comparison can be performed by the gamma evalua-tion method introduced by [19, 20]. Dose values are compared in both dose and spa-tial domains. Dose difference and distance-to-agreement criteria are applied to gen-erate pass/fail maps with passing rate defined by a gamma factor. When the gamma factor has a value ≤ 1, agreement within the criteria is found. Gamma evaluation is applied e.g. in the Delta4 software for estimation of deviations between measured and
calculated data or in the Portal Dosimetry module of Eclipse TPS for verification of planned fluence map with EPID measurements. Although a commonly used tool in the clinical practice [21, 22, 23], the gamma evaluation of two calculated dose
distri-butions is not available in the TPS and the usage of third party software (e.g. CERR) is not straightforward. Various in-house approaches have been implemented to re-spond to the need [24].
In this work, focus is on the implementation of the normalized dose difference (NDD) method for quantitative comparison of MC- and TPS dose distributions. NDD is considered to be an extension of the gamma evaluation concept including lo-cally defined, spatially varying normalization factors. A maximum allowed dose dif-ference (MADD) is calculated at each point, which is larger in high dose gradient re-gions than in low dose gradient rere-gions. The NDD value at a certain point of interest is obtained by scaling of the dose difference at that point by the ratio of MADD to the predetermined dose acceptance tolerance. The mathematical formalism of the conventional gamma evaluation is intended for continuous environment and artefacts have been observed related to the discrete nature of the dose grid distributions, i.e. the gamma method may give different results for different dose resolutions. The NDD method, however, is reported to be insensitive to the dose grid size. Also, it shows which dose distribution has a higher value at the comparison point (has a sign). In this work, the NDD formalism is applied in Matlab® (Mathworks, Natick, USA) as described in [25]. Within the formalism, voxels for which the NDD abso-lute value is smaller than the predetermined dose tolerance are considered to pass the criteria.
3. 5. Clinical material
The functionality of the MC QA system is tested by performing MC simulations with subsequent analysis retrospectively for 13 patients: seven of these were treated for prostate cancer, three for gynaecological cancer and three for cancer in head and neck region. Treatment of a single target region as well as treatment of anatomical regions with simultaneous multiple targets with different levels of the prescribed dose is included in the test. Patient plans were generated in Eclipse TPS. Five of them involved one arc and the others - two arcs. Clinical dose distributions calculat-ed by AAA as well as by AXB algorithms are investigatcalculat-ed.
4. Results and discussion
4.1. Validation of accelerator models
4.1.1. Open fields
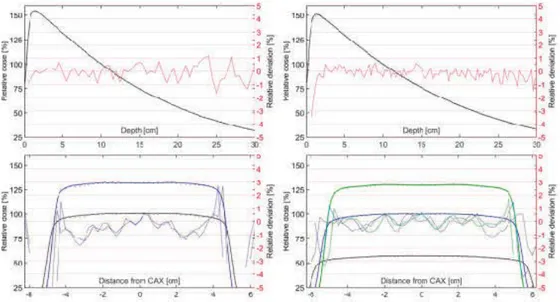
In Fig. 1 representative results from the comparison between measured and simulated profiles for open fields defined by accelerator jaws are shown. Detailed results of the gamma evaluations are presented in Appendix A. The pass rates for the Clinac iX are 93.7% and 99.3% for the super strict and strict criteria, respectively. The pass rates for the TB are 97.3% and 99.7% for the super strict and strict criteria respectively. In general, the agreement for lateral profiles are least favourable for the shallowest depths.
Fig. 1: Measured profiles are shown as solid lines, simulated profiles as dots and rel-ative deviation as dashed lines. All deviations are computed as the local relrel-ative de-viation. For the lateral profiles all curves for a specific depth are displayed using the same color. Top left: Clinac iX depth dose profile. Top Right: TB depth dose profile. Bottom left: Clinac iX crossline dose profiles for the following depths; 5 cm (blue) and 10 cm (black). Bottom right: TB crossline dose profiles for the following depths; 5 cm (green), 10 cm (blue) and 20 cm (blue).
4.1.2. Absolute dose calibration
The values used to compute KMC are specified in table 2. The standard deviation of
KMC is found to be 0.57% and 0.41% for Clinac iX and TB respectively. It is im-portant to note that KMC is unique for each phase space and the calibration process needs to be repeated if a new phspaboveJaw is generated.
Field size [cm2]
Depth [cm] 5x5 10x10 20x20 Clinac iX
5 3.1220E-12 3.1323E-12 3.1731E-12 10 3.1313E-12 3.1478E-12 3.1692E-12 20 3.1629E-12 3.1415E-12 3.1712E-12
TrueBeam 5 3.8181E-12 3.8217E-12 3.8367E-12 10 3.8112E-12 3.8286E-12 3.8463E-12 20 3.8161E-12 3.8405E-12 3.8632E-12 Table 2: Ratios between simulated and measured reference doses
4.1.3. Multileaf collimator
Validation of MLC models by complex dynamic MLC fields is illustrated in the case of Aida field for HDMLC (Fig. 2a). A good agreement is seen between calculated and experimental crossline profile from the film measurement (Fig. 2b).
(a)
(b)
Fig. 2a. Frontal dose distribution for alternating open/closed (Aida) HDMLC se-quence. The dashed line indicates measured/simulated profile location. Fig. 2b Com-parison between calculated (red line) and measured (black line) profile by Gaf-Chromic film; right scale: relative deviations in % (red dotted line)
In the case of particleDMLC approach for simulation of dynamic MLCiX motion, the following parameter values are obtained: MLC density = 17.85 g/cm3;
se-quences are carried out using both, particleDMLC and SYNCVMLC. Profile com-parisons show good agreement between the results. In Fig. 3 profiles for MLC fence pattern are presented as an example. Our conclusion is that both approaches can be applied for simulation of dynamic MLCiX movement. However, particleDMLC does not include HDMLC and therefore is not applied further in the work.
Fig. 3. Profiles for MLC fence pattern for 10x10 cm2 jaw field at 10 cm depth in
wa-ter calculated by the two MLC models, particleDMLC and SYNCVMLC. The insert illustrates the fence pattern.
4.2. Monte Carlo QA Workflow
The workflow of the MCQA system developed is illustrated in Fig. 4. It consists of a number of modules (Table 3) that all are exclusively written in python. The modules are sequentially connected and can be configured to be executed without user inter-action.
Fig. 4. MC workflow concept Modul Brief description
I Generates BEAMnrc/DOSXYZnrc input files replicating all plan specific parameters (e.g. beam aperture, gantry, couch and collimator angles, MU). Initiates module II if CT data and RT Structure Set were exported from the TPS.
II Builds a voxalized phantom based on the CT data and
information form the RT Structure Set. The module is based on CTC-ask [2]. The distinct differences being that it is written in python, automated and includes patient support structures. Media selection rules are predefined by the user and can be differentiated for various structure types.
III Initiates treatment specific BEAMnrc simulation starting from a previously generated phase space scored above collimating devices.
IV Concatenates phase spaces files (if parallel simulation). Computes number of histories required in order to achieve a fixed level of uncertainty. Initiates DOSXYZnrc simulations using source 20 [3].
V Converts to absolute dose. Writes DICOM objects using the exported files as templates.
Table 3. Function of the modules in the MCQA system
The technical platform is organized as an internal network at Sahlgrenska University Hospital. Three high-performance (Haswell i7) computers were installed as inde-pendent simulation servers along with the Linux based operating system Fedora 21. The user manual for the MC simulation system is available at request.
4.3. Evaluation of MC and clinical dose
distributions in the TPS
The MC dose distributions obtained for patient VMAT plans are imported into Eclipse TPS and related to clinical data obtained by AAA- and AXB algorithms. Comparisons are performed both in dose to medium and dose to water. In Table 4 and 5, the analysis of the DVHs is presented for five patients treated for prostate can-cer. The choice of parameters is based on recommended dose-volume objectives and constrains to target volumes and organs at risk. Estimates such as D95% (dose to 95%
of the PTV ≥ 95% of prescribed dose) and V90% (the volume receiving 90% of the
prescribed dose) are used in the comparison.
Table 4. Comparison of DVHs derived from dose to medium distributions calculated by MC and Acuros XB (AXB) for patients treated for prostate cancer
Pat Dmean CTV [%] D95% PTV [%] V90% Rektum [%]
MC AAA AXB MC AAA AXB MC AAA AXB 1 99,0 100,0 99,8 94,7 98,6 97,8 26,0 27,6 27,2 2 99,4 100,0 100,1 97,2 99,2 98,8 13,9 14,7 14,5 3 98,1 99,9 99,8 90,8 98,2 97,5 10,0 11,0 10,9 4 98,7 100,0 99,9 95,4 97,8 99,2 19,0 17,4 20,3 5 99,0 101,0 100,5 90,3 95,1 94,0 19,1 21,0 20,7 Table 5. Comparison of DVHs derived from dose to water distributions calculated by MC, AAA and Acuros XB (AXB) for patients treated for prostate cancer.
In general, larger differences are seen between the MC and the clinical algorithms es-timates than between AAA- and AXB data. The deviations vary for e.g. less than 1% for Dmean CTV to more than 4% for D95% PTV (Table 4). Choice of parameters to be
followed and elaboration of clinically acceptable differences is not a trivial task and will be addressed in our future work.
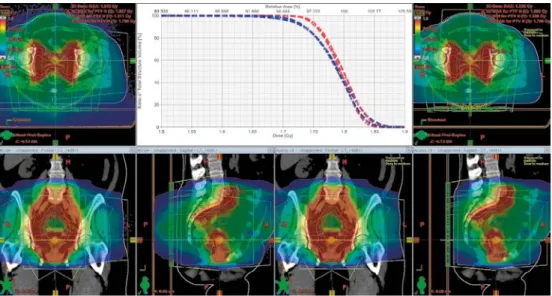
In Fig.5 the comparison of MC- and AXB distributions is visualised for a VMAT plan resulting in two high-dose areas in the pelvic anatomical region. The DVH his-tograms for target (PTV and GTV) are in good agreement. Larger deviations are ob-served for treatment plans for cancer in head and neck region. Visual inspection of dose distributions reveals that the deviations are primarily located in air cavities in-cluded in the target volume or caused by high density artefacts in the patient CT im-age.
Pat Dmin CTV [%] Dmean CTV [%] D95% PTV [%] V90% Rektum
[%] V75% [%] Rektum MC AXB MC AXB MC AXB MC AXB MC AXB 1 92,8 95,2 98,3 98,5 94,0 96,7 25,2 26,0 40,2 40,8 2 92,8 94,8 98,3 98,3 95,9 97,4 13,4 13,8 24,5 24,5 3 88,6 92,4 98,6 98,0 89,9 95,3 10,0 10,6 16,5 16,8 4 93,3 97,1 98,3 99,9 95,1 99,2 19,0 20,3 27,2 28,2 5 95,0 97,5 99,8 100,5 89,8 94,0 19,2 20,7 32,5 33,3
Fig. 5 Patient treated in pelvic region. MC vs AXB dose till medium distributions. The insert shows DVHs for PTV (blue lines) and for GTV (red lines).
4.4. Evaluation of MC and clinical dose
distributions in the analysis module
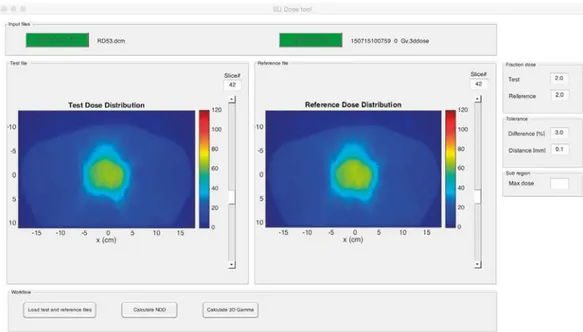
A stand-alone module is developed performing dose distribution comparison and evaluation by the NDD method and gamma analysis [26]. The module is intended to be applied in an interactive mode. User-friendly interface is developed allowing vis-ualization and control of the program parameters from a single main window. The reference- and test dose distributions in either MC- or DICOM format can be loaded. The parameters required to perform NDD calculation, such as prescribed doses, tol-erance levels and sub-region by dose limit, can be set using panel controls. An over-view of the loaded dose distributions is enabled by slice selection sliders connected to each dose distribution source (Fig. 6). Graphical and quantitative results are pre-sented in separate windows (Fig. 7). Point doses and line profiles can be displayed. User manual is written with software specifications, installation and description of the workflow complemented by video demonstration (available by the authors).
Fig. 6 Main window of the analysis module where two dose distributions are loaded.
Fig. 7 An overview of the result windows after NDD calculation.
In Fig. 8 the result from NDD analysis of MC vs. AAA dose distribution is illustrat-ed for the same patient as in Fig. 5. NDD maps for three transversal slices are shown. Negative values indicate lower AAA doses compared to MC data. The MC simula-tions include the air surrounding the patient. Therefore the NDD values outside the patient are negative. The tolerance criteria are set to 2% / 3 mm, i.e. dose difference tolerance of 2% from the prescribed fraction dose of 1.8 Gy and
distance-to-agreement of 3 mm. This distance-to-distance-to-agreement is chosen due to typical resolution of 2.5 mm of the dose calculation matrix in the TPS for the clinical case considered. The passing rate for a region encompassing more than 20% of the prescribed dose is found to be 94.8, i.e. the dose difference for 94.8% of the voxels is within 2%
Fig. 8. An illustration of the NDD analysis for the same patient as in Fig. 5. The col-our scale is adjusted to show pass/fail voxels. Red and dark blue voxels fail. For red voxels, the AAA dose is larger than MC dose by more than 2% of the prescribed dose. For dark blue voxels, the AAA dose is smaller than MC dose by more than 2% of the prescribed dose.
5. Summary
A Monte Carlo (MC) patient-specific pre-treatment QA system is developed, ena-bling calculation and evaluation of dose distributions for VMAT treatment plans in the patient geometry based on CT images. The simulation workflow is portable and can be connected to the TPS by means of exports and imports. The workflow outputs include RT Dose objects further used in the evaluation process.
Varian implementation of VMAT is considered in the work. In particular, Clinac iX and TrueBeam accelerators and VMAT plans involving 6 MV flattened photon beams generated in Eclipse TPS are employed. Two MLC types, Millennium 120 MLC and Millennium High Definition MLC, are modelled in detail and thoroughly validated by a number of static and dynamic MLC sequences. A procedure for de-termination of unknown material and geometry parameters is elaborated, involving examination of local dose deviations between measured and simulated data as well as gamma evaluation.
An advanced software is developed for generation of MC compliant voxel phantoms from patient DICOM data. It is interaction-free, handles any patient orientation and is able to include the treatment couch when the coach is defined as a structure in the DICOM RT Struct file. Spencer-Attix mass restriction stopping-power ratios are cal-culated for all the tissues included in the patient modeling. Thus, the dose distribu-tions in the patient geometry is reported as both, dose to medium and dose to water. Calibration factors are calculated converting MC dose in units Gy per incident parti-cle to absolute dose in Gy per MU.
A stand-alone analysis module is developed for quantitative assessment of deviations between planned and MC dose distributions. Gamma evaluation is implemented as well as the more advanced NDD method producing e.g. pass/fail maps indicating which of the dose distributions dominates at the particular voxel.
Future plans include moving focus from development to implementation of the MC QA system. In particular, larger statistics from analysis of patient plans will be ac-cumulated in order to elaborate global or diagnosis dependent clinical relevant toler-ance criteria.
6. References
[1] I. Kawrakow, E. Mainegra-Hing, D. W. O. Rogers, F. Tessier, and B. R. B. Wal-ters, The EGSnrc Code System: Monte Carlo Simulation of Electron and Photon Transport. http://nrc-cnrc.github.io/EGSnrc/doc/pirs701-egsnrc.pdf.
[2] D. W. O. Rogers, B. R. B. Walters, and I. Kawrakow, BEAMnrc Users Manual http://nrc-cnrc.github.io/EGSnrc/doc/pirs509a-beamnrc.pdf.
[3] I. A. Popescu, J. Lobo, Monte Carlo simulations for time-dependent radiation sources with general kinematics. Radiother. Oncol 2007; 84:76
[4] I. A. Popescu, P. Atwal, J. Lobo, J. Lucido, and B. M. C. McCurdy, Patient-specific QA using 4D MC phase space predictions and EPID dosimetry, Journal of Physics: Conference Series, 2015; 573 (1): 012004
[5] D. W. O. Rogers, B. R. B. Walters, and I. Kawrakow, DOSXYZnrc Users Manu-al. http://nrc-cnrc.github.io/EGSnrc/doc/pirs794-dosxyznrc.pdf.
[6] J. Lobo and I. A. Popescu, Two new DOSXYZnrc sources for 4D Monte Carlo simulations of continuously variable beam configurations, with applications to Rapi-dArc, VMAT, TomoTherapy and CyberKnife, Phys Med Biol 2010; 55:4431-4443 [7] E. Hedin, A. Back, and R. Chakarova, Jaw position uncertainty and adjacent fields in breast cancer radiotherapy, J Appl Clin Med Phys 2015; 16 (6): 5673 [8] E. Hedin, A. Back, J. Swanpalmer, and R. Chakarova, Monte Carlo simulation of linear accelerator Varian 25 Clinac iX 2010, MFT-26 RADFYS 2010:01
[9] P. Francescon, C. Cavedon, S. Reccanello, and S. Cora, Photon dose calculation of a three-dimensional treatment planning system compared to the Monte Carlo code BEAM. Med Phys 2000; 27: 1579-1587
[10] P. Sibolt, R. O. Cronholm, A. R. Beierholm, and C. F. Behrens, Measurements of the relative backscatter contribution to the monitor chamber for modern medical linear accelerators; a multi-center study. Rad Meas 2017; 72: 75-80
[11] E. Heath and J. Seuntjens, Development and validation of a BEAMnrc compo-nent module for accurate Monte Carlo modelling of the Varian dynamic Millennium multileaf collimator. Phys Med Biol 2003; 48: 4045-4063
[12] Varian Medical Systems, Monte Carlo Data Package High Energy Accelerator. Varian Medical Systems, 2.0 ed., Jan 2014.
[13] Varian Medical Systems, TrueBeam Monte Carlo Data Package. Varian Medi-cal Systems, 1.1 ed., Mar 2014.
[14] M. Gustafsson, Department of Medical Physics and Biomedical Engineering, Sahlgrenska University Hospital, Gothenburg, Private communication.
[15] J. V. Siebers, P. J. Keall, J. O. Kim, and R. Mohan, A method for photon beam Monte Carlo multileaf collimator particle transport. Phys Med Biol 2002; 47: 3225-3249
[16] R. O. Ottosson and C. F. Behrens, CTC-ask: a new algorithm for conversion of CT numbers to tissue parameters for Monte Carlo dose calculations applying DI-COM RS knowledge. Phys Med Biol 2011; 56: N263-274
[17] R. Chakarova, K. Muntzing, M. Krantz, E. Hedin, and S. Hertzman, Monte Car-lo optimization of total body irradiation in a phantom and patient geometry. Phys Med Biol 2013; 58: 2461-2469
[18] J. V. Siebers, P. J. Keall, A. E. Nahum, and R. Mohan, Converting absorbed dose to medium to absorbed dose to water for Monte Carlo based photon beam dose calculations. Phys Med Biol 2000; 45: 983-995
[19] D. A. Low, W. B. Harms, S. Mutic, J. A. Purdy, A technique for the quantitative evaluation of dose distributions. Med Phys 1998; 25 (5): 656-660
[20] D. A. Low and J. F. Dempsey, Evaluation of the gamma dose distribution com-parison method. Med Phys. 20013; 30 (9): 2455-2484
[21] T. Depuydt, A. van Esch, D. P. Huyskens, A quantitative evaluation of IMRT dose distributions: refinement and clinical assessment of the gamma evaluation. Ra-diother Onc 2002; 62: 309-319
[22] A. Esch et al, Implementing RapidArc into clinical routine: A comprehensive program from machine QA to TPS validation and patient QA. Med Phys 2011; 38: 5146
[23] G. Asuni, T. A. van Beek, S. Venkataraman, I. A. Popescu, B. M. C. McCurdy, A MC tool for evaluating VMAT and DIMRT treatment deliveries including planar detectors.2013; 58: 3535-3550
[24] J. Bengtsson Scherman, Developement and evaluation of methods for compari-son of dose distributions in radiotherapy using calculated, synthetic and simulated measured dose distributions. 2009, MS thesis, Lund University
[25] S. B. Jiang, G. C. Sharp, T. Neicu, R. I. Berbeco, S. Flampouri, T. Bortfeld, On dose distribution comparison. Phys Med Biol 2006; 51: 759-776
[26] S. Biggs, A gamma evaluation software comparing two arbitrary dose grids in 1, 2, or 3 dimensions, available from https://pypi.python.org/pypi/npgamma/0.4.1.
Appendix A: Detailed result for validation
of open field profiles for TB accelerator
Field size
(cm2) Profile type Depth(cm) Gamma passrate (%)
1%/1mm 2%/1mm All All N/A 93,66 99,31
5x5 Depth dose N/A 98,00 98,00
Crossline 5 95,24 100,00 10 100,00 100,00
Inline 5 100,00 100,00
10 100,00 100,00 All N/A 98,51 99,25
10x10 Depth dose N/A 98,11 98,11
Crossline 5 97,67 100,00 10 100,00 100,00 Inline 5 94,87 100,00
10 97,56 100,00 All N/A 97,67 99,53
20x20 Depth dose N/A 98,28 98,28
Crossline 5 81,82 98,70 10 86,75 100,00 Inline 5 88,31 98,70 10 95,06 100,00 All N/A 88,31 99,20
Table A1. Detailed result of validation for each open field profile for Clinac iX accelerator.
Field size
(cm2) Profile type Depth(cm) Gamma passrate (%)
1%/1mm 2%/1mm All All N/A 97,35 99,69
5x5 Depth dose N/A 98,99 98,99
Crossline 5 89,47 100,00 10 94,74 100,00 20 95,24 100,00 Inline 5 89,47 94,74 10 94,74 100,00 20 95,24 100,00 All N/A 95,85 99,08
10x10 Depth dose N/A 99,09 99,09
Crossline 5 100,00 100,00 10 100,00 100,00 20 100,00 100,00 Inline 5 97,67 100,00 10 100,00 100,00 20 100,00 100,00 All N/A 99,49 99,74
20x20 Depth dose N/A 99,17 99,17
Crossline 5 96,55 100,00 10 91,21 100,00 20 98,99 100,00 Inline 5 97,70 100,00 10 96,70 100,00 20 94,95 100,00 All N/A 96,59 99,85
Appendix B: Design and validation of
MLC components
Fig. B1: MLC physical lateral position as a function of geometrical center of simu-lated lateral dose profile (black circles) for the HDMLC as simusimu-lated by the
SYNCHDMLC. Included in the figure is a linear fit to the data (dashed line) and the intersection of the linear fit and a geometrical center perfectly aligned with the beam CAX (red square).
Fig. B2. Simulated transmission/leakage profile for an MLC blocked field for the MLCiX as simulated by SYNCVMLC. Inline dose profile. The dose is normalized to a field of the same size with the MLC fully retracted.
Fig. B3. Dose ratio of MLC blocked and MLC retracted field for MLCiX (left) as simulated by SYNCVMLC and for HDMLC (right) as simulated by SYNCHDMLC. This simulated ratios are shown as black circles. Included in the figure is a linear fit to the data (dashed line) and the intersection of the linear fit and the measured dose ratio (red square).
Strålsäkerhetsmyndigheten Swedish Radiation Safety Authority
2017:13 The Swedish Radiation Safety Authority has a comprehensive responsibility to ensure that society is safe from the effects of radiation. The Authority works to achieve radiation safety in a number of areas: nuclear power, medical care as well as commercial products and services. The Authority also works to achieve protection from natural radiation and to increase the level of radiation safety internationally.
The Swedish Radiation Safety Authority works proactively and preventively to protect people and the environment from the harmful effects of radiation, now and in the future. The Authority issues regulations and supervises compliance, while also supporting research, providing training and information, and issuing advice. Often, activities involving radiation require licences issued by the Authority. The Swedish Radiation Safety Authority maintains emergency preparedness around the clock with the aim of limiting the aftermath of radiation accidents and the unintentional spreading of radioactive substances. The Authority participates in international co-operation in order to promote radiation safety and finances projects aiming to raise the level of radiation safety in certain Eastern European countries.
The Authority reports to the Ministry of the Environment and has around 300 employees with competencies in the fields of engineering, natural and behavioural sciences, law, economics and communications. We have received quality, environmental and working environment certification.