INFLUENCE OF TRAFFIC FLOW SEPARATION DEVICES ON ROAD
SAFETY IN BRAZIL’S MULTILANE HIGHWAYS
Gabriel Andrade Lanzaro Universidade de Brasília
Departamento de Engenharia Civil e Ambiental, Faculdade de Tecnologia, Campus Universitário Darcy Ribeiro, Brasília, DF, Brazil
Phone: + 55 61 98249-4878 E-mail: gabriellanzaro@gmail.com Co-author: Michelle Andrade, Universidade de Brasília.
ABSTRACT
The accidentality in Brazilian federal highways represents a major problem, since approximately 20% of traffic deaths in the country occur in these types of roads. Regarding multilane highways, specifically four-lane ones, it must be emphasized that they are designed in order to admit intense traffic with proper levels of service, but the problem of traffic accidents and deaths may persist even in highways with better characteristics. Therefore, it’s important to understand the conditions that influence the occurrence of accidents, including the ones related to road design. According to Brazil’s regulations for the geometric design of rural highways, multilane roads must have a traffic flow separation device for opposing directions and this can be represented by a physical distance – provided by a median – or a single barrier, with additional marked lines for safety, and the latter is only allowed when there are severe right-of-way restrictions. However, many of these roads present a single centerline as an instrument of separation and, with such characteristic, the highway becomes undivided, with the only difference, when compared to multilane divided ones, regarding the absence of a physical separation. Naturally, in these scenarios, drivers are encouraged to develop higher velocities, since there are two lanes in each direction, but the probability of certain types of accidents (such as head-on and angle collisions) significantly increase, and these are some of the most fatal kinds of collisions. Because of that, this study aims to verify if the traffic flow separation devices (TFSD) – median (physical distance), barrier and centerline – exert a meaningful impact on road safety with respect to typology and frequency. The study consisted of separating a similar sample in terms of operation, provided by the average daily traffic as an instrument of comparison, but with different types of TFSD. To evaluate the importance of this variable on road safety, descriptive statistics were used with some indexes (accidents, victims and deaths per kilometer) and, after that, the chi-square test was done to assure that the preliminary analysis could lead to stronger conclusions, such as the usage of the contingency coefficient associated to it. It was possible to verify that multilane highways with a single centerline as TFSD present a big mortality when compared to the other ones, approximately double of the second position. Also, the usage of median barriers showed better results than the other kinds of TFSD in terms of accidents and deaths, so a median as large as possible (recommended by the Brazilian regulations for geometric design) may not be always necessary, since there is a reduction of serious collisions with barriers. Therefore, it can be said that the traffic flow separation devices are significant when the accidentality and mortality of the highways are studied.
1.
INTRODUCTION
Projects of multilane highways are primarily based on the level of service required for a specific daily traffic, but the consequences of such designs on road safety become more relevant when compared to two-lane highways, for instance, in which there is a unique lane for each direction. If a median is present, with a barrier or not, the possibility of occurrence of certain types of accidents (such as head-on and angle collisions) are drastically reduced because of the existence of a physical distance or a protection device separating traffic flow in opposite directions.
However, there are specific cases, in Brazil, where the highways possess two lanes in each direction with a continuous cross-section, in which the separation is only visible due to the centerline, although the Average Daily Traffic (ADT) of these roads may be equivalent to the one in divided highways. The main problem is that, because of both lanes in each direction, drivers are naturally encouraged to develop higher velocities. This similarity between divided and undivided highways in terms of operation, being the only difference the absence of a separation, provides an unreal feeling of safety, since the chances of the most fatal types of collision are significantly increased without a separation and, with high velocities, the consequences may be even worse.
In Brazil, the main document that states the guidelines for the geometric design of roads – the Manual
of Geometric Design of Rural Highways (DNER, 1999) – does not contemplate multilane undivided
highways, demanding a median width of at least 3 meters. It also reinforces that, in extreme circumstances, such as tunnels or right-of-way restrictions, the median might be reduced to a single barrier or guardrail with an additional marked line just for safety, since the gap between the protection device and the line cannot be classified as a shoulder due to the minimum width. Therefore, the single centerline dividing opposing traffic in multilane highways is not regulated, although there are several segments of important Brazilian highways with these features.
Due to a series of technical characteristics, a single highway may present different types of devices to divide traffic flow. As an example, it is worth mentioning BR-040, an important Brazilian multilane road that connects Brasília and Rio de Janeiro. There are these three types of separation (median, median barrier and centerline) in distinct segments along its approximately 1200 km, being this illustrated in Figure 1.
Several studies, such as the ones conducted by Pérez (2005) and Russo et al. (2016), investigated safety performance for undivided highways. While the former evaluated the safety impact of road treatments, such as pavement markings, the latter analyzed the relevance of geometric variations to the frequency of injuries and fatalities. Also, The Highway Safety Manual considers undivided four-lane roadway segments in its accident prediction models, stating, for example, a proportion of crashes by collision type and severity level (AASHTO, 2010).
The importance of these studies applied to the Brazilian reality is reinforced by the fact that the country presented, in 2014, 23.4 road traffic fatalities per 100,000 people (WHO, 2015). It places Brazil in the 148th position among 182 countries analyzed by the World Health Organization (ONSV, 2014), in which the first is the safest country in terms of road safety.
Regarding the Brazilian federal highways, in which there are numerous multilane roads, it must be stated that they are responsible for about 20% of total traffic deaths of the country, with around 26,000 people seriously injured. The 170,000 accidents in these highways, only in 2014, represented a cost of approximately US$ 5.35 billion to society, including medical expenses, loss of production and material damages (IPEA, 2015).
(a): BR-040 (MG) – Km 467; Usage of a Median (b): BR-040 (RJ) – Km 34; Usage of a Median Barrier (or Guardrail)
(c): BR-040 (MG) – Km 618; Usage of a Centerline
Figure 1: Traffic Flow Separation Devices in BR-040 (Google Earth, 2017)
These economical losses, associated to an elevated number of deaths, indicate the reason why it is important to understand the factors that influence traffic accidents. Although it can be said that the most important contributing factors are the human, vehicle and road ones (Almeida et al., 2013), the treatment in locations where the most important factors are the ones related to the roads represent the best cost-benefit regarding the reduction of accidents (Nodari, 2003). Therefore, the choice of proper geometric elements, including the cross-section ones, constitute an important step when there is a goal of providing safer roads for users.
Thus, because of the geometric difference between these multilane roads in terms of capacity, the aim of this study is to investigate if the Traffic Flow Separation Devices (TFSD) – median (physical distance), median barrier or single centerline – exert a meaningful influence on road safety with respect to accident typology and frequency.
2.
TRAFFIC FLOW SEPARATION DEVICES (TFSD)
In regards to multilane highways, a median, with a physical distance, is generally used as the element responsible for separating opposing traffic flow. This choice is due to the attempt of ensuring better conditions of traffic safety and fluidity and, because of that, it is recommended to employ widths as large as possible (Lee, 2013). Nonetheless, the utilization of extreme widths, such as bigger than 10 meters, could entail excessive costs in cut and fill (earthmoving) or land expropriation, but could also mean the dispensation of Jersey barriers or guardrails when not necessary.
Barriers and guardrails are used in conditions in which an uncontrolled vehicle may cross the median and crash into another vehicle traveling in the opposite flow, being the usage also justified in cases of obstacles too close to the lane or steep slopes. The stiffness of these devices is high, with the objective of absorbing the kinetic energy from the collisions, but the small angles of impact, associated to the induced deformations, make the vehicle return to the lane (Lee, 2013).
The Brazilian National Department of Transportation Infrastructure (DNIT, former DNER) specifies zones in which the employment of barriers or guardrails is required or optional, being this a function of the width of the median and of the ADT. Figure 2 presents the graphic that shows the need of such devices when separating traffic flow. These criteria were developed based on accident studies and the
usage of the displayed zones is deeply recommended when there is no information regarding accidents in the region of the project.
Figure 2: Need of Barrier or Guardrail (DNER, 1999)
The referred manual also regulates minimum and desired parameters about the existence of a physical distance segregating opposing traffic flow. According to DNER (1999), medians with width greater than 10 meters are desired and, if even larger, may allow the conception of U-turns. It must be stated that the adoption of minimum parameters might seem as a better alternative in terms of economic costs, but the desired ones are needed for the geometric design of safer roads.
As previously highlighted, multilane highways with a centerline as TFSD, that is, undivided, are not contemplated, although there are several roads in the country that present this characteristic.
3.
METHOD
The study consisted of, firstly, defining a sample that could enable the comparison between highways with different TFSD. After that, statistical methods were used to analyze the data, including descriptive statistics and the chi-square test. This section describes the method used.
3.1. Definition of the Sample
The data used for this study was provided by three Brazilian institutions: ANTT (National Ground Transportation Agency), CNT (National Confederation of Transport) and PRF (Federal Highway Police). Their contributions are explained below:
• ANTT: average daily traffic data;
• CNT: traffic flow separation devices data; • PRF: accident data.
In order to unify the information provided by these institutions, the sample consisted of federal highways operated as a concession which were researched by the CNT, since the latter only studied a limited variety of highways all over the country.
After that, the segments with the most critical type of TFSD (a single centerline) were analyzed and it was verified that approximately 185 km could fit into this category. However, to simplify the comparison to highways with a physical distance or a median barrier, a unique road was selected: BR-040, in the state of Minas Gerais. In its 164,9 km that carried this characteristic, it was observed if, for example, the road was inside the urban perimeter of important cities and, most importantly, the ADT measured in its turnpikes.
Other highways with ADT between 10,000 and 20,000 vehicles per day were selected, but now with different TFSD. It must be reinforced that the ADT was not employed in further analysis due to the lack of data for all the highways in the period studied. Therefore, the usage of this traffic data consisted only of a way of obtaining similar roads in terms of operation, as an instrument of comparison. The Table 1 summarizes the sample used.
Table 1: Sample used for the study
Road State Traffic Flow Separation Device Length (km)
BR-040 MG Centerline 164.9
BR-381 MG Physical Distance 435.2
BR-040 / BR-050 MG/RJ Median Barrier 98.9
The highways in which a physical distance was used as TFSD had median widths between 3 and 25 meters approximately, but the majority of the sample consisted of the minimum width (3 meters). However, this element was not taken into consideration for this study.
3.2. Statistical Methods
Descriptive statistics were used to state if the TFSD exert impact on the number of accidents (regarding quantity and typology), victims and deaths. The data applied consisted of a three-year period: 2013, 2014 and 2015.
Every information collected from the accident data was divided by the number of kilometers of the corresponding segments. This technique was used to make the comparison possible, since the length of analysis for each category was different.
It is worth mentioning that some other parameters, such as the number of accidents per 100 million vehicles, were not calculated due to the lack of available ADT data for the three-year period studied. However, the three indexes shown are capable of characterizing the accidentality of Brazilian’s multilane highways according to its correspondent TFSD.
In order to verify the statements inferred from the descriptive statistics with a more significative approach, the chi-square test of independence was conducted, with the goal of determining if there was a relationship between TFSD and mortality. It was established a null hypothesis that there would be no association between these two variables and, if rejected, the test would assume a relationship (Barbetta, 2012).
The acceptance or rejection of the null hypotheses was based on the interpretation of the p-value. The smaller it is, when compared to the level of significance desired, it becomes clearer the rejection of the null hypothesis (Barbetta, 2012).
The application of the chi-square test was performed with the statistical software SAS®, based on recommendations from Waller (2012).
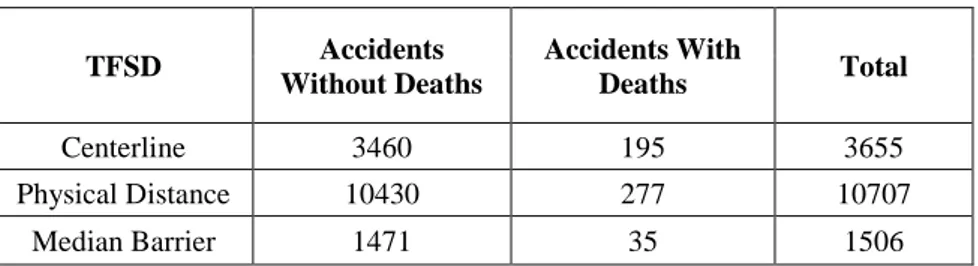
Therefore, the accidents were divided into two categories: accidents without deaths (including both property damage only and accidents with personal injuries) and accidents with deaths. Table 2 shows the absolute numbers of the sample in terms of occurrence.
Table 2: Number of accidents for each TFSD TFSD Accidents Without Deaths Accidents With Deaths Total Centerline 3460 195 3655 Physical Distance 10430 277 10707 Median Barrier 1471 35 1506
However, the chi-square test of independence ensures only that the variables are related (or not) and it is not a clear indicator of how strong occurs this relationship. The contingency coefficient is, in this case, capable of expressing
the intensity of
this association and it is established by (Barbetta, 2012):𝐶 = √ 𝑘 ⋅ 𝜒
2
(𝑘 − 1) ⋅ (𝜒2+ 𝑁)
Where 𝜒2 is the chi-square statistic, N is the number of observations and k is the smallest number between the number of rows and columns from the contingency table (Table 2).
The C-value varies between 0 and 1, where 0 indicates just independence and 1, a perfect association. Besides that, values around 0,5 may be interpreted as a moderate association (Barbetta, 2012).
Another way of analyzing this relationship between variables is the usage of odds ratio (OR) and relative risk (RK), as conducted by Olmuş et al. (2012) when investigating the association between accident time and severity. If both the OR and the RK are equal to one, the event is equally probable in both groups. The greater they are, the bigger the probability of occurrence in the first group, and vice-versa. Such analyses can be done only for 2x2 tables, since they compare two samples individually.
The RR can be defined as a ration of proportions, whereas the OR is expressed as the probability of an event over the probability of this same event not happening (Agresti, 2007). Mathematically, such indexes can be reduced to:
𝑅𝑅 = 𝜋1 𝜋2
𝑂𝑅 = 𝜋1/(1 − 𝜋1) 𝜋2/(1 − 𝜋2)
Where 𝜋1,2 represents the probability of occurrence of certain events. Confidence intervals can also be
obtained with SAS® (2009), defining the level of significance desired.
4.
RESULTS
Three indexes were used to verify the influence of traffic flow separation devices: number of accidents per kilometer, number of victims per kilometer and number of deaths per kilometer.
It must be stated that accidents, for this study, include both property damage only and also personal injured. Besides that, the number of victims is related to the ones injured during the accident and also to deaths.
(a): Number of Accidents per Kilometer per TFSD (b): Number of Victims per Kilometer per TFSD
(c): Number of Deaths per Kilometer per TFSD
Figure 3: Parameters per Traffic Flow Separation Devices
Based on Figure 3, it can be inferred that the median barrier is an effective device for dividing vehicles traveling in opposite directions, regarding the reduction of accidents and deaths on highways, since the indexes for this category were significantly smaller when compared to the other types of TFSD. Concerning typology, two classifications could be highlighted: run-off-road accidents and collisions. Because of that, Figures 4 and 5 show the mean of these types of accidents for the three-year period with its standard deviation.
The numbers of accidents per kilometer on highways separated by a centerline and by a physical distance are very close, according to Figure 3a, and this similarity can be justified by the types of accidents occurring in each one of them. Whereas the quantity of collisions per kilometer more likely to happen on two-lane roads (with a unique lane for each direction), such as head-on, angle and sideswipe, increases in multilane undivided highways (Figure 5), the parameter relative to the number of run-off-road accidents is bigger in run-off-roads with a median (Figure 4).
These results are coherent, since the existence of a physical distance between opposing traffic flow makes possible the higher number of run-off-road accidents. Besides that, the lack of a separation, concerning the cases with a single centerline, make drivers, for example, prone to execute U-turns and, with vehicles developing velocities higher than 80 km/h (according to DNER standards for these types of highways), the accidents tend to become worse.
It’s important to state that only one type of collision (the one with a fixed object) did not present its highest number on highways separated by a centerline because of, mainly, the absence of a physical structure dividing traffic flow. As expected, roads with median barriers came up with the biggest number of accidents in this category.
However, the number of victims on highways separated by a centerline represents the biggest index when compared to the other TFSD categories (Figure 3b), and the situation becomes even more relevant when the number of deaths per kilometer is analyzed (Figure 3c), since it’s almost double the number of the runner-up’s parameter (highways separated by a physical distance).
Figure 4: Number of Run-off-Road Accidents per Kilometer per TFSD
Figure 5: Number of Collisions per Kilometer per TFSD
Figure 6 presents the number of accidents per kilometer caused by inattention and excessive speed. These classifications were provided by the PRF data, in which the accidents were characterized by having these causes. Such classifications were attributed by PRF field agents after analyzing the scene of the accident. Again, the mean and the standard deviation are shown for the three-year period.
It can be seen that, although traffic accidents are more fatal in multilane highways with a centerline as TFSD, drivers lean to pay more attention when driving in these cases. However, this higher level of attention, provided by the adverse geometry, does not imply in death reduction and this corroborates the need of an intervention for better safety conditions.
Moreover, the physical distance induces to higher velocities, since the number of accidents caused by excessive speed is significant in this category when compared to the others.
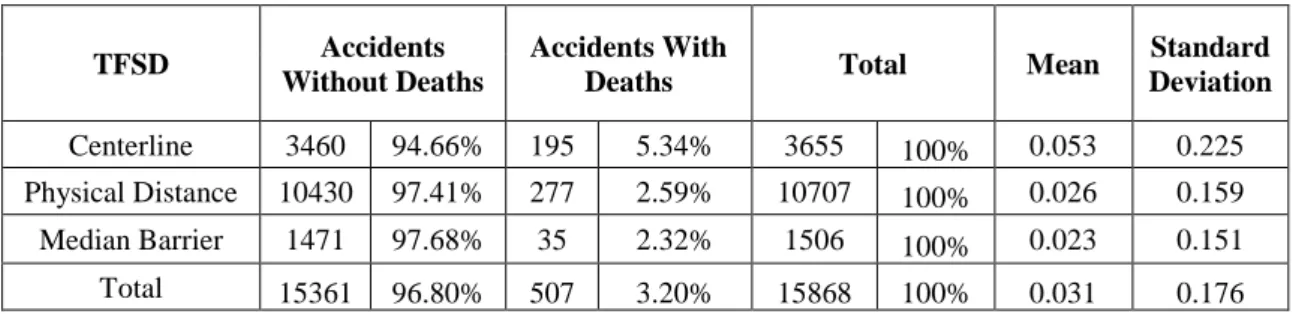
With the objective of doing the chi-square test, the frequencies are listed in Table 3. It also contains the mean and the standard deviation calculated for each TFSD with the consideration: Accident Without Deaths = 0 and Accidents With Deaths = 1.
Table 3: Frequencies, means and standard deviations
TFSD Accidents Without Deaths
Accidents With
Deaths Total Mean
Standard Deviation Centerline 3460 94.66% 195 5.34% 3655 100% 0.053 0.225 Physical Distance 10430 97.41% 277 2.59% 10707 100% 0.026 0.159 Median Barrier 1471 97.68% 35 2.32% 1506 100% 0.023 0.151 Total 15361 96.80% 507 3.20% 15868 100% 0.031 0.176 The chi-square test, with two degrees of freedom (since there are three TFSD variables), resulted in 𝜒2 = 706.11 and a p-value smaller than 0.01. Thus, it is possible to conclude that the existence of accidents with deaths in multilane highways is associated to the TFSD, taking a level of significance of 1%. The contingency coefficient obtained was 0,29, which indicates an association of the variables between the levels of weak and moderate, according to Barbetta (2012), since he establishes C-values of 0 and 0,5 for these types of associations.
The Odds Ratio and the Relative Risk are presented in Table 4, comparing TFSD two by two regarding the probability of occurrence of accidents with deaths, with its respective 95% confidence intervals.
Table 4: Odds Ratio and Relative Risk
TFSD Odds Ratio Relative Risk
OR Confidence Interval RR Confidence Interval Centerline - Physical Distance 2.122 1.760-2.559 2.062 1.724-2.467
Centerline - Median Barrier 2.369 1.645-3.412 2.296 1.610-3.273 Physical Distance - Median Barrier 1.116 0.782-1.593 1.113 0.786-1.576
It can be seen that both the OR and the RR, when the centerline is object of analysis, are greater than 2, which indicates that the probability of occurrence of accidents with deaths is bigger in highways with this type of TFSD. Similar results were obtained from Figure 3c, that used as a parameter the number of deaths per kilometer.
Both indexes also stated the relevance of a median barrier when compared to a physical distance as a separation device, but the confidence intervals included values smaller than 1. This indicates that the median barriers may seem as an efficient way of reducing deaths, yet the confidence intervals emphasize that there might be locations where a physical distance may be better in terms of road safety, such the ones with large width. Therefore, an additional and more specific investigation may lead to better conclusions concerning this topic.
5.
CONCLUSIONS
Based on the results previously shown, it can be implied that highways with a single centerline dividing opposite traffic directions are significantly dangerous for drivers because of the number of deaths per kilometer presented and also of the OR and RR indexes, approximately double of the quantity on highways separated by a physical distance.
Besides that, the descriptive statistics have shown that the absence of a physical separation (a distance or a barrier) represents a meaningful impact with respect to the mortality on highways, since drivers develop higher velocities, as they apparently are on multilane divided highways, with two lanes for each traffic flow direction. However, the single centerline increases the possibility of, for example, head-on and sideswipe collisions, two of the most fatal kinds of accidents (Figure 4).
The number of accidents, victims and deaths per kilometer on highways divided by a median barrier show that an extremely wide separation in the median, although recommended by regulations (such as DNER, 1999), is not the only alternative necessary to reduce the parameters presented in this study. The usage of longitudinal barriers produced satisfactory results in road safety, even better than the ones with a physical distance as TFSD, and this can be an interesting solution if restrictions regarding right-of-way are severe or the existence of properties on the border of the road prevents its enlargement. Also, the chi-square test was able of assuring that the mortality in multilane highways is associated to the TFSD used, with a level of significance of 1%. Because of that, this variable can be included in accident prediction models when studying crash-frequency and crash-severity.
These results are similar to what was verified by Wang et al. (1998) when investing safety effects of cross-section design on rural multilane highways, since the inexistence of a physical separation increased the accident rate in Minnesota’s four-lane roads. Elvik et al. (2009), after comparing several studies, concluded that medians reduce accident in most situations in numerous locations. Besides that, Gabler et al. (2005) noted that the installation of barriers may reduce accident severity, as also observed in Brazil’s multilane highways in terms of fatalities.
As confirmed for Brazilian multilane highways, the usage of a physical separation is, above all, essential for reducing the number of deaths. And, because of that, the Brazilian’s Manual of Geometric Design
of Rural Highways is correct, in terms of road safety, when it does not contemplate undivided highways
when it comes to projecting highways in the country.
6.
LIMITATIONS AND FUTURE RESEARCH
The study did not include the widths of the physical distance between lanes with vehicles traveling in opposite traffic flow and this might be an important parameter when analyzing the accidentality of these highways. It is possible to assume, based on these results, the smaller the physical distance between the opposing lanes is, the greater the chances of increasing fatalities. Additional studies are required to verify such statement.
Also, the lack of ADT data for the whole period studied did not make possible the inclusion of this information into the analysis in order to obtain segments with characteristics even more similar in terms of operation. As the ADT is a factor of risk exposure, different values of this data may result in different characteristics regarding the accidents, such as typology.
As future research, its desired the consideration of these parameters in the models, to verify the efficiency of barriers when compared to a physical distance as TFSD, since the DNER regulation
emphasizes that median barriers as the only form of separation may be used exclusively in extreme circumstances.
Besides that, a correlation with the Highway Safety Manual and the study of regression models (in terms of accident prediction models) for multilane highways with the TFSD as a variable indicate a possibility of future research to study crash-frequency and crash-severity.
ACKNOWLEDGMENTS
The authors would like to acknowledge professors Alan Ricardo da Silva and Maria Alice Prudêncio Jacques, from the University of Brasília, for the assistance with the application of the statistical methods and also with additional comments that improved this study. We would like to show our gratitude to the Brazilian institutions ANTT, CNT and PRF, that provided the data for this work.
Besides that, the authors would like to thank the institutions that provided financial support for the attendance to the conference, such as FAP-DF and the University of Brasília.
REFERENCES
AASHTO (2010). American Association of State and Highway Transportation Officials. Highway Safety Manual. 1st edition. Washington, DC, United States.
Agresti, A. (2007). An Introduction to Categorical Data Analysis. 2nd edition. Wiley-Interscience. Department of Statistics. University of Florida. Gainesville, Florida, United States.
Almeida, R. L. F.; Bezerra Filho, J. G.; Braga, J. U.; Magalhães, F. B.; Macedo, M. C. M.; Silva, K. A. (2013). Man, road and vehicle: risk factors associated with the severity of traffic accidents. Revista Saúde Pública (online). Vol.47, n.4, p.718-731. ISSN 0034-8910.
Barbetta, P. A. (2012). Estatística Aplicada a Ciências Sociais. 8th edition. Editora UFSC. Florianópolis, Brazil.
DNER (1999). Manual de Projeto Geométrico de Rodovias Rurais. Departamento Nacional de Estradas de Rodagem. Instituto de Pesquisas Rodoviárias, Ministério dos Transportes. Brasília, Brazil.
Elvik, R.; Høye, A.; Vaa, T. ; Sørensen, M. (2009). The Handbook of Road Safety Measures. Second edition. Emerald. Oslo, Norway.
Gabler, H. C.; Gabauer, D. J; Bowen, D. (2005). Evaluation of cross median crashes. Rowan University. Department of Mechanical Engineering. Report FHWA-NJ-2005-04.
Google Earth (2017).
IPEA (2015). Acidentes de Trânsito nas Rodovias Federais Brasileiras: caracterização, tendências e custos para a sociedade. Instituto de Pesquisa Econômica Aplicada. Brasília, Brazil.
Lee, S. H. (2013). Introdução ao Projeto Geométrico de Rodovias. 4th edition. Editora UFSC. Florianópolis, Brazil.
Nodari, C. T. (2003). Método de Avaliação da Segurança Potencial de Segmentos Rodoviários Rurais de Pista Simples. Doctoral Dissertation. UFRGS. Porto Alegre, Brazil.
Olmuş, H.; Erbaş, S. (2012). Analysis of traffic accidents caused by drivers by using log-linear models. Promet – Traffic&Transportation, Vol. 24, nº 6, p. 495-504.
ONSV (2014). Observatório Nacional de Segurança Viária. Retrato da Segurança Viária no Brasil – 2014. São Paulo, Brazil.
Pérez, I. (2006). Safety impact of engineering treatments on undivided rural roads. Accident Analysis and Prevention, v. 38, p. 192-200.
Russo, F; Busiello, M.; Dell’Acqua, G. (2016). Safety performance functions for crash severity on undivided rural roads. Accident Analysis and Prevention, v. 93, p. 75-91.
SAS 9.2 User’s Guide (2009). Second Edition. SAS Support Site. Retrieved November 14, 2017 from: https://support.sas.com/en/support-home.html.
Waller, J. L. (2012). How to Perform and Interpret Chi-Square and T-Tests. SAS Global Forum, Paper 155-2012. Orlando, Florida, United States.
Wang, J.; Hughes, W. E; Steward, R. (1998). Safety effects of cross-section design on rural multilane highways. International Symposium on Highway Geometric Design Practices. Boston, Massachusetts. WHO (2015). World Health Organization. Global Status Report on Road Safety – 2015. Geneva, Switzerland.