H O O N < [s N «H N a O :
VTI notat 77A-2001
Perception of some
seat belt reminder
sounds
Author
Sven Dahlstedt
Research division Human, Vehicle, Transport System
Interaction ¥
Project number
40434
Project name
Seat Belt Reminders
Sponsor
The Swedish National Road
Administration
Distribution
Free
Swedish National Road and
Foreword
This study was carried out as a very rapid operation, when the Swedish National Road Administration (or rather some of its of cers) realised that there was an immediate need for data on how people perceive seat belt reminder signals, and also found that there was very little data available. VTI was asked to deliver some data, and we did.
Because of the very narrow time limits it was not possible to delve deeper into all the subtle issues of sound perception. It was more a matter of a most basic exercise in psychophysical scaling. But next time, i.e. before the authorities and/or the industry takes the nal decision on seat belt reminder sounds, I hope that we can have another opportunity to try out the optimal seat belt signal (or something close to it). In the meantime I hope that the people working with seat belt design and regulations will nd some use for the data I present here.
The narrow time limits put some special requirements on all the necessary arrangements, which usually had to be nished by yesterday . And I am most grateful to a lot of people, inside and outside VTI, who helped me at very short notice; particularly Christoffer Nilsson, Decibel Production, Linkoping and Fredrik Borgsj'o', The Sound and Styling Shop, Linkoping, who helped me with the production of the sounds, Hakan Wilhelmsson, VTI, who did some essential programming and Beatrice Séderstrom, VTI, who did most of the data collection. Linkoping, December 2001
Sven Dahlstedt
Contents
Summary
1
Background and purpose of the study
2 Method
2.1 Test sounds
2.2 Sound level measurements 2.3 Experimental procedure 2.4 Subjects
2.5 Analyses
3 Results
3.1 Just audible 3.2 Loud and clear
3.3
Annoying
3.4 Opinions
3.5 Summing up
4 Concluding comments
4.1 Methodological
4.2 Criteria for seat belt reminders 4.3 Further research
References
Appendix 1 Presentation of test sounds
VTI notat 77A 2001
A 0 0 0 3 03 0 5 O) 01
11
11
11
12
14
15
16
18
18
19
19
21
Summary
A study was carried out to provide some background data on how acoustical seat belt reminder signals are perceived in a car. 19 subjects listened to 9 test sounds and one neutral reference sound While sitting in a stationary car and being exposed to a background noise corresponding to driving 50 km/h at top gear. Their task was to adjust the loudness level of each sound to make it just audible , loud and clear or de nitely annoying . After the test session the subjects were also interviewed about which sounds they preferred or rejected.
The results indicate that the more complex sounds are set at fairly uniform levels, but that two of the tested sounds were set consistently lower for the same perceived audibility. For one of these sounds the explanation to the deviation is assumed to be that the sound consisted of pure tones. For the other sound, a ticking with rather brief pulses and an instantaneous onset, the very low dB(A) values are hypothesized to be an artefact of the measurement mode.
The interview gave rather con icting results concerning the popularity of the sounds. This nding is explained by the widely differing criteria used by the subjects when preferring or rejecting a sound, which pinpoints the necessity of explicit speci cations of the purpose of a seat belt reminder system
1
Background and purpose of the study
After it was shown that, at least in Sweden, the number ofreally stubborn seat belt non-users was very small (Dahlstedt, 1999) some of the seat belt promoting work has changed focus - from forcing people to put it on to just reminding them. Also in the current international traf c safety work, 6.g. in EEVC1 and Euro NCAPZ, this direction of work seems to have been adopted. While awaiting nal speci cations from Working Group 16 of EEVC, Euro NCAP has taken the initiative to propose that the safety evaluation of cars shall also include the function of the seat belt reminder (henceforth abbreviated SBR) system.
A proposal for how the SBRs should be assessed has been drafted by a working group of Euro NCAP (2001), and it is intended that the new criteria should take effect from the beginning of2002. The proposal includes a great variety of aspects to be included in the evaluation of the SBR system, and in the requirements it is also stated that the sound signal should be .. loud and clear under normal driving conditions. The normal driving conditions are later speci ed as 50 km/h in top gear on a good, asphalt road and with the ventilation fan running at 3A of full speed. But regarding what should be considered loud and clear there is still some uncertainty. In a paper dated 18th Oct it is tentatively proposed that the sound level of the SBR signal should be at least 5 dB over the background noise in the compartment. But it was realised by the members of the working group that this gure was highly provisional, and that the whole concept of loud and clear needed some elaboration.
In order to have a better basis for considerations regarding how various sound signals of different character and intensity might be perceived by ordinary, average car drivers some relevant data were needed. Therefore, VTI was asked to plan and carry out a minor study of how some existing, as well as hypothetical, SBR sounds are perceived during the prescribed normal driving conditions . In particular, the loudness levels should be established both for when a sound was just discernible as well as when it was judged as loud and clear .
2
Method
2.1 Test sounds
In the whole study 11 different sounds were presented. One of these was the background noise which was on during all sessions. Another was a neutral reference sound, which was presented as a SBR sound, but without any hints that it could ever be used as a reminder. The other nine were the studied reminder
sounds, which are summarized in Table 1 below and also presented in somewhat
more detail in Appendix 1. Originally it was planned to use two different Tick sounds one hard and one soft - but after recording them it was found impossible to discriminate between them if the loudness level was kept equal. Therefore only one tick was included in the study.
The background noise was recorded in a Volvo 850, 1995, during a peaceful, nightly cruise along a fairly at and level road with a high surface standard. The road was dry, the wind speed was very low (0 3m/s) and the car was equipped 1 European Experimental Vehicle Committee
2 European New Car Assessment Program
with a calibrated speedometer, cruise control and summer tires (Gislaved Speed 306). With the ventilation fan set at % of full speed the cruise control was used to keep the speed as constant as possible at 50 kmph while the noise in the compartment was recorded. The microphone was not positioned exactly as in the draft Euro NCAP proposal, but rather close. It was approximately 10 cm to the right and 10 cm in front of the driver s right ear. The microphone was a Br el & Kjaer 4165 and the recording was made on an analogue Nagra type IV-SJ. The total recording time was almost 45 minutes.
During the drive some disturbances, e.g. oncoming and overtaking cars, could not be avoided. Therefore the recorded compartment noise was afterwords tested and listened to very carefully. From the total 45 min recording an interval of 6 min was nally selected to use as the background sound in the study. During these six minutes no disturbances can be heard, and the recorded sound level was within 1 dB(A) all the time. This 6 min interval was then digitized and multiplied ve times to get a continuous 30 min background. No frequency analysis was carried out, but it can be assumed that this sound consists mainly of frequencies from the lower end ofthe audible spectrum.
The neutral reference sound consisted of an excerpt from the daily meteorological observations, which can be heard three times a day on the Swedish Radio, channel 1. The voice was female and it read ..Positi0n(min0r pause)0bservati0ns (noticeable pause)[Next]Positi0n.. at a very steady pace and at a fairly stable loudness level. This sound was also recorded on the analogue Nagra and later converted to a digital WAV- le.
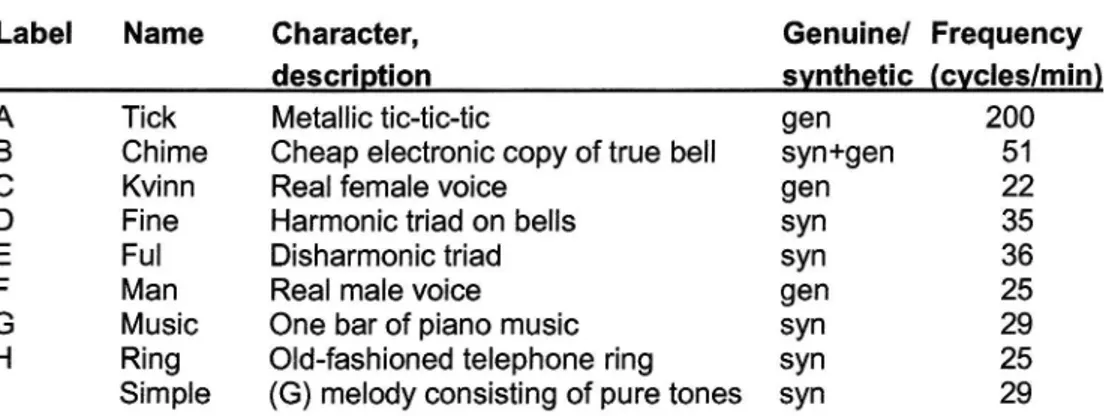
The nine actual test sounds are summed up in Table 1 and also presented in Appendix 1, but a more general description could be as follows:
Tick sound (labelled A) is a real-life seat belt reminder recorded from a Volvo 244, 1985. Most people who have experienced this mechanical sound appear to consider it very ef cient but not very pleasing.
Chime (B), also a real-life sound, taken from a Volvo S 70, 2000. The sound is actually a synthetic copy of a true bell-chime, which is quite easily recognized.
Female voice (C), a real person reading The seat belt, put on the seat belt in Swedish over and over again in a rather neutral tone and without any particular dialect.
Nice triad (D), a harmonic major triad, recorded from a synthesizer but almost sounding as real bells.
Unpleasant triad (E), a disharmonic triad, also recorded from a synthesizer but with the bells selected more at random.
Male voice (F), another real person reading The seat belt, put on the seat belt in Swedish over and over again in a rather neutral tone and without any particular dialect.
Real music (G), one bar from a rather lively melody, played on a synthetic, but rather well-sounding piano.
Ringing (H), an electronic version of an electro-mechanical ring sound, almost like the old-fashioned telephone ringing.
Simple music (I), the same short melody as (G), but presented in the simplest possible, digital version containing only pure tones.
The real sounds A, B, C and F were recorded on the Nagra IV-SJ through a Briiel & Kjaer 4165 microphone. The other sounds were produced and processed digitally before anybody could listen to them.
Table 1 Summary of tested seat belt reminder sounds
Label Name Character, Genuine/ Frequency
gescriLtion svnthetjc (cvcles/min) A Tick Metallic tic-tic-tic gen 200 B Chime Cheap electronic copy of true bell syn+gen 51 C Kvinn Real female voice gen 22
D Fine Harmonic triad on bells syn 35
E Ful Disharmonic triad syn 36
F Man Real male voice gen 25
G Music One bar of piano music syn 29 H Ring Old-fashioned telephone ring syn 25
I Simple (G) melody consisting of pure tones syn 29
2.2 Sound level measurements
All sound levels were measured with a Briiel & Kjaer 2209 Impulse Precision Sound Level Meter equipped with a 4165 microphone, i.e. a rather reliable sound measuring device. All measurements were carried out with the conventional A -lter, thus giving sound levels adjusted for the differing sensitity for differing frequencies of the human hearing. Nevertheless, the sound measurements involved some problems - mainly because of the very intermittent character of most of the sounds.
According to the generally accepted speci cations of IEC 60651 concerning sound meters and sound measurements, a sound can be measured with either of three time constants. In the Slow mode the time constant is 1 sec, which means that the meter calculates average sound levels over an interval (exponential time window) of 1000 ms; in Fast mode the time constant is 1/8 see which gives oating averages over 125 ms intervals; in Impulse mode the time constant is even shorter giving averages over, 35 ms intervals. Some sound meters, e.g. the B&K 2209, have an optional Peak mode, which corresponds to the highest instantaneous sound level. In the B&K 2209 the peak level is measured over an interval less than 10 microseconds.
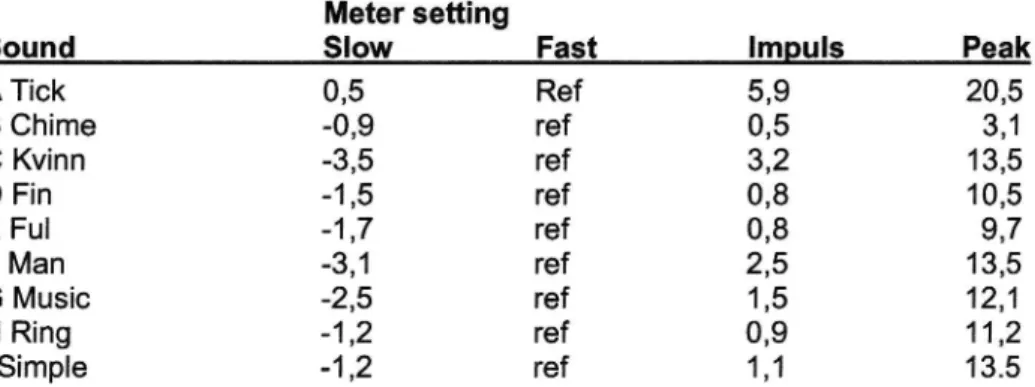
For homogeneous, continuous sounds all these measurement modes give the same result. But for more irregular sounds, a longer time constant tends to level out the measured intensity of short, or very rapidly changing, sounds. For some of the tested sounds the difference was quite substantial between these measurement modes, as can be seen in Table 2. Unfortunately, the human perception of loudness is in uenced in many complex ways by the temporal characteristics of a sound, such as rise and fall time, duration, repetition and also the qualities of the masking (background) noise (see e.g. Scharf and Houtsma (1986) for an overview). This complexity makes it dif cult to select a time constant for the measurements, which gives the best correspondance with the human loudness perception and unfortunately there is no readymade lter similar to the A
-lter for pitch.
Since it could not be decided what measure that was most true , all four measures were taken for all the test sounds and the Fast value was taken as the default. The differences between the measurement modes are presented for all the test sounds in Table 2. The gures in the table can be used to get an impression of the peaked character of a sound by noting the total difference between Slow
and Peak .
Table 2 Differences in sound level readings (dB(A)) depending upon the setting of the sound meter in Slow , Fast Impulse and Peak mode, respectively, for the loudest part ofthe nine test sounds.
Meter setting
Sound Slow Fast Immls Pea_k
A Tick 0,5 Ref 5,9 20,5
B Chime -O,9 ref 0,5 3,1
C Kvinn -3,5 ref 3,2 13,5 D Fin -1,5 ref 0,8 10,5 E Ful -1,7 ref 0,8 9,7 F Man -3,1 ref 2,5 13,5 G Music -2,5 ref 1,5 12,1 H Ring -1,2 ref 0,9 11,2 | Simple -1,2 ref 1,1 13.5
The sound measurements were only made before and after the experimental session as a calibration of the computerized ampli er. During the tests only the digital readings corresponding to certain settings of the ampli er system were recorded. The digital settings had been calibrated as follows; with the microphone in a position according to the Euro NCAP proposal (between driver and passenger, 635 mm above driver s H point) sound levels were recorded for 12 15 settings over the whole range produced by the computer. For each sound the de ections of the meter were checked for at least 30 sec and the highest observed value was recorded. This was done for all four measurement modes. The sound levels were then plotted against the digital settings and straight lines tted, giving equations describing the relations between numerical values and sound levels.
2.3 Experimental procedure
All tests were carried out indoors in a stationary car with all doors and windows closed. For this study the car had been equipped with a self-calibrating Hi system (Pioneer DEH-P945R), thus ascertaining that the output from it should be as close to the original sound as possible. This system was used to present the prerecorded in-car background noise at a constant level of 60 dB(A). (Without this played-back sound the true background noise in the car was below 35 dB(A)). The in-car noise had been digitized and was stored on a CD, which was played on the Pioneer system. The test sounds, also digitized, were stored on the hard disc of a PC and were played back through fairly cheap, conventional PC speakers (Manufactured by JUSTer Co, sound characteristics unknown) positioned on the dashboard - one speaker straight ahead and one speaker about 30° to the right.
After a brief introduction, when the subject was told that the study concerned subjective experience of the loudness of actual and hypothetical seat belt reminder sounds, the subject was seated in the driver's seat of the stationary car. All experimental sessions included the same tasks in the same order, but with the presentation of the sounds randomized within each task. The rst task was named Faint sounds, falling in which the subject was told to reduce the level of a presented, reasonably audible, sound until it was Just audible without extreme listening efforts. When the subject had nished the adjustment of the loudness a sign was given to the experimenter, who recorded the digital loudness setting.
There was no hurry or time limit but most subjects made their adjustments quite quickly without much hesitation. The task always started and ended with the reference sound V , and with the SBR sounds in random order in between.
The second task was named Loud, rising-falling . In this task a sound was started at a barely audible level and the subject was asked to increase its loudness, until it was Loud and clear , and then signal the experimenter. The experimenter noted the loudness setting and the subject continued to increase the sound until it was experienced as de nitely Annoying . After a signal to the experimenter to record the setting, the subject then reduced the sound back to Loud and clear . When this level also had been recorded, the next sound was presented, and so on. The setting of Annoyance levels was introduced to get a rather high, and individually adjusted, starting point for each descending setting. Although not included in the purpose, and not related to work of Euro NCAP, the obtained data are nevertheless presented for those who might be interested in the range of an upper acceptance limit.
The third task was Faint, rising . Now each sound was started at a non audible level, so the subject was given a hand signal to start the listening and increase the sound until it was Just audible , when the set level was recOrded. Just as in the other tasks the rst and last sound was the V reference, with the test sounds in random order in between.
After the listening tasks the session was ended with a brief interview. The subject was asked Which of these sounds that you have listened to, do you think is the best seat belt reminder, i.e. which would you prefer in your own car? Then the subject was asked to name the second best, and also the third best. Then the subject was told From the opposite point of View, which of these sounds did you nd the worst, i.e. the one you preferred the least? After that the subject was also asked about the second and third worst, respectively.
A complete session lasted about 45 minutes for most subjects, and in no case more than one hour. When a session was nished the subject was thanked, praised for his/her endurance and given a bonus check corresponding to 100 SEK, to buy some sweets or other consolation.
2.4 Subjects
All subjects but three were recruited from within VTI, mainly from the administrative staff. The other three were just acquaintances without any known biases towards seat belts or road safety in general. Any special prejudices concerning seat belt reminders were not checked. The only exclusion criterion was that such persons who were aware of any hearing defects or hearing problems were not permitted to take part, but no real hearing tests were carried out. One subject remembered after having nished the full test session that she had had numerous ear infections as a child. Her results were checked particularly carefully, and although indicating a certain bias compared to the group average the results were not so extreme as to motivate exclusion.
The median age of the subjects was 43 years, and the full range extended from 21 to 56 years. Nine of the subjects were male, and ten female, making 19 subjects in all.
2.5 Analyses
All the recorded loudness settings were entered into Excel worksheets and converted to sound levels in dB(A) according to the equations mentioned in the end of section 2.2 above. All subsequent calculations were then made on the dB(A) gures. As descriptive summaries of the results conventional arithmetic means and standard deviations were calculated. Since the purpose of the study primarily was to collect a set of references, rather than to test whether one sound was better or worse, no tests of statistical signi cances were carried out.
3
Results
3.1 Just audible
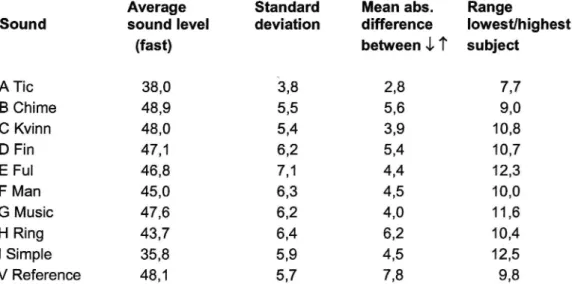
This task, setting the loudness of the SBR sound to be Just audible against the background noise, was carried out twice by each subject; once descending from a clearly audible level and once ascending from a non audible level. The results are summed up in Table 3.
Table 3 Just audible levels of SBR sounds and the reference sound V in dB(A) based on I 9 subjects loudness settings in onefalling and one rising series.
Average Standard Mean abs. Range
Sound sound level deviation difference lowest/highest
(fast)
between i T subject
A Tic
38,0
3,8
2,8
7,7
B Chime 48,9 5,5 5,6 9,0 C Kvinn 48,0 5,4 3,9 10,8 D Fin 47,1 6,2 5,4 10,7 E Ful 46,8 7,1 4,4 12,3 F Man 45,0 6,3 4,5 10,0 G Music 47,6 6,2 4,0 11,6 H Ring 43,7 6,4 6,2 10,4 l Simple 35,8 5,9 4,5 12,5 V Reference 48,1 5,7 7,8 9,8The averages and standard deviations were calculated over both the falling and rising results over all the 19 subjects, thus giving the conventional description of the distribution of data. The column Mean absolute difference between falling and rising presents the average absolute difference between the result from the falling series minus the result from the rising series, thus giving an indication about the in uence of the presentation context. The rightmost column gives similarly an indication of the effects of differing listening capacities and strategies by showing the difference between those subjects having the highest and lowest average loudness setting for each sound.
As can be seen the average levels of the various sounds were set at a fairly constant level, with the exception of sounds A and I; the effect of increasing or decreasing the sound level gave a difference of around 5 dB(A); the difference between best and worst hearing and/or judgement strategy produced loudness differences of about 10 dB(A).
60D
H l l * l i l l w
3?
:5 30,0
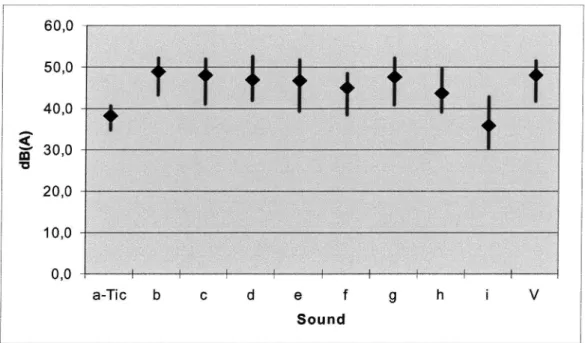
'5 203 103 0,0 l i l l l l V l l .L a-Tic b c d e f g h i V SoundFigure 1 Average loudness settings of nine ust audible seat belt reminder sounds and the reference sound Vfor 19 subjects. The variability is indicated by the vertical lines which show the range between the subjects making the highest and lowest mean loudness settings.
Some of these results are summed up in gure 1, in which the average sound levels are indicated by the fat dots and where also the uncertainty range due to subjective factors is shown as a solid line from the lowest to the highest individual mean loudness setting for each sound. As can be seen the average subject could hear all the complex sounds at levels around 15 dB(A) below the 60 dB(A) background noise. The pure-tone sound I and the peaked amplitude" sound A were heard already at more than 20 dB(A) below the background noise, but it must be kept in mind that the result for the A-sound might partly be an artefact of the mode of measurement (cfsection 2.2 above). It is also rather evident that the different sensitivities and/or listening strategies of the various subjects result in a
subjective uncertainty range of around 10 dB(A).
3.2 Loud and clear
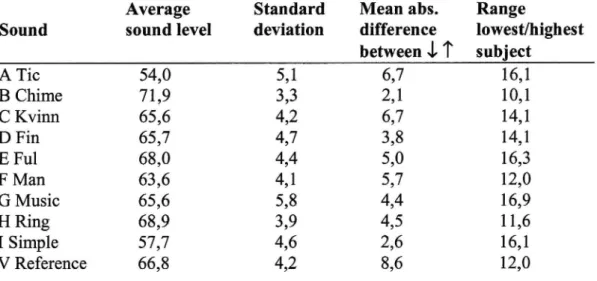
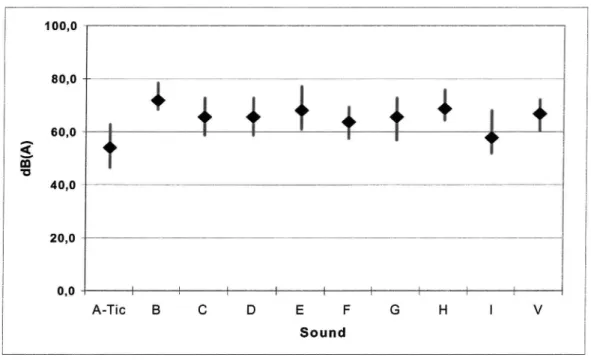
The results of the subjects second task, setting the loudness of each sound so as to make it Loud and clear , are presented in table 4 and summed up in gure 2. Also in this task the subjects made the settings twice, the rst time increasing the sound level and the second time decreasing it. Variability due to this presentation effect is indicated in the column Difference downi/upT , and variability due to individual differences is indicated in the column Range lowest/highest subject .
Table 4
Loud and clear levels of SBR sounds and the reference sound V
in dB(A) based on 19 subjects loudness settings in one falling and one rising
series.
Average Standard Mean abs. Range
Sound sound level deviation difference lowest/highest between ~L T subject A Tic 54,0 5,1 6,7 16,1 B Chime 71,9 3,3 2,1 10,1 C Kvinn 65,6 4,2 6,7 14,1 D Fin 65,7 4,7 3,8 14,1 E Ful 68,0 4,4 5,0 16,3 F Man 63,6 4,1 5,7 12,0 G Music 65,6 5,8 4,4 16,9 H Ring 68,9 3,9 4,5 11,6 1 Simple 57,7 4,6 2,6 16,1 V Reference 66,8 4,2 8,6 12,0
The overall relationships between the various sounds are fairly similar to the results from the task Just audible , but with a general increase of the loudness settings to a level above the 60 dB(A) background noise. This should also be evident from the summary results in gure 2 below.
As can be seen it takes a sound level of 65 70 dB(A) for any of the complex sounds (all except A and I) to be considered Loud and clear against the 60 dB(A) background. Regarding the I sound, which consisted of pure tones, it is not surprising that it contrasts well against the background already at a fairly low level. And regarding the ticking A sound it must again be pointed out that it is doubtful whether the Fast measurement mode gives the best correspondence to human hearing for this type of sound. If the Peak measure was chosen as more representative for this sound, then the Loud and c1ear -leve1 of the A sound would be around 74 dB(A).
100,0 80,0 60,0 g + co '5 40,0 20,0 0,0 l . l l l l l P E A-Tic B C D E F G H l V Sound
Figure 2 Average loudness settings of nine Loud and clear seat belt reminder sounds and the reference sound V for 19 subjects. The variability is indicated by the vertical lines which show the range between those subjects making the highest and lowest mean loudness settings.
3.3 Annoying
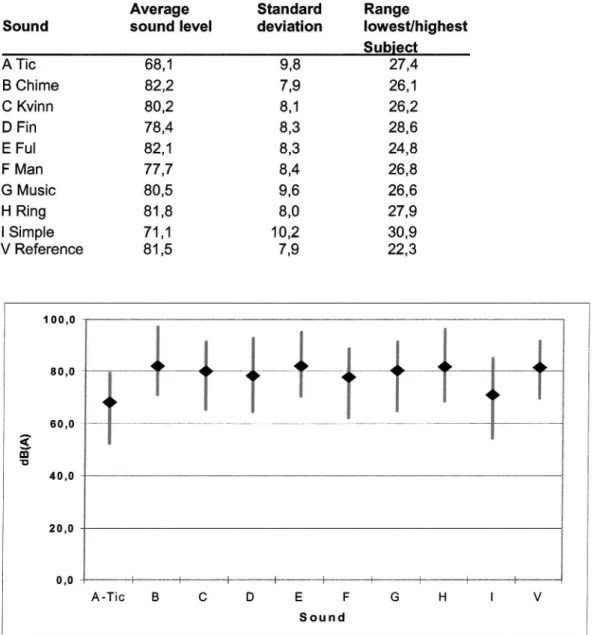
The third task of the subjects was to set the level of each sound so that it was experienced as de nitely Annoying . This setting was done only once, and in a context which corresponds with an ascending series. Therefore these results are probably underestimates compared to results obtained as means from one rising ' and one falling series. And as a consequence, there are no data on context effects in table 5, where the results on Annoying sound levels are presented as in tables 3 and 4. A graphical summing up is also presented in gure 3.
As can be seen the relations between the various sounds are still very similar to the results for Just audible and Loud and clear , but the overall level has increased another 10 15 dB(A). It might be worth pointing out that the variability has increased, both expressed as standard deviations and ranges from highest to lowest subject. This can partly be an effect of halving the number of observations, but is certainly also an effect of the more psychological dimensions of the sounds. On lower levels it was mainly a matter of signal-to-noise ratio, but on the annoyance level other qualitative aspects, e.g. pleasantness, seemed to become important.
Table 5 Annoying levels of SBR sounds and the reference sound V in dB(A) based on 19 subjects single peak settingsfor each sound.
Average Standard Range
Sound sound level deviation lowest/highest Su_biect A Tic 68,1 9,8 27,4 B Chime 82,2 7,9 26,1 C Kvinn 80,2 8,1 26,2 D Fin 78,4 8,3 28,6 E Ful 82,1 8,3 24,8 F Man 77,7 8,4 26,8 G Music 80,5 9,6 26,6 H Ring 81,8 8,0 27,9 | Simple 71,1 10,2 30,9 V Reference 81,5 7,9 22,3 100,0 80.0 + I f $ 60,0
g
l
l
9
40,0 20,0 0,0 l . , . , . . . A-Tic B C D E F G H I v SoundFigure 3 Average loudness settings of nine Annoying seat belt reminder sounds and the reference sound Vfor 19 subjects. The variability is indicated by the vertical lines which show the range between the subjects making the highest and lowest loudness settings.
3.4 Opinions
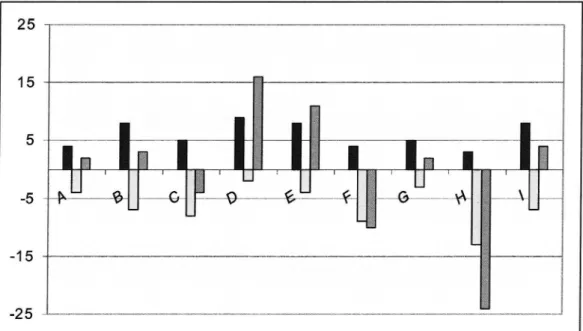
Every experimental session was ended with a few questions regarding the subject s opinions about the SBR sounds. The results of this little survey are summarized in gure 4 below.
That sound, which a subject preferred3 the most, was given a score of +3 and the second and third choices were scored +2 and +1. But to permit expressions 3 Unfortunately, preference can be based on widely differing criteria, which was realised a little too late!
also of dislikes, the sound which a subject preferred the least was scored -3, and the second and third least preferred -2 and -1, respectively. The resulting scores are presented as striped bars in gure 4. There it can be seen e.g. that for the sounds A, B and G the positive and negative opinions almost cancelled each other giving total scores close to O (nil, zero).
The two leftmost bars of each three-group show the number of subjects preferring (upwards) or rejecting (downwards) a sound. As can be seen the opinions differed so much among the subjects that none of the sounds was preferred or rejected consistently by all the 19 persons. One explanation to this result is probably the widely differing criteria which the subjects employed. This effect is discussed further in section 4.2 below.
15
/. /e
e
. / {/1 f/ y e e e ,, g e e; / Z 7 e 7 e:I
e
I ' |
e
I
e
5 ___p___, v, ___Q_ n 6 6 p a \A e \ ____r
e
e ¢ u % -15 %g e4 g g e g 25 %Figure 4 Number of subjects preferring or rejecting the nine SBR sounds and the resultingnet preference scores from 19 subjects. (Left, dark bar = Number of preferring subjects; Middle, light bar = Number of rejecting subjects; Right,
striped bar = Net total score, theoretical max. ::l:57)
Fortunately, the purpose of this study was not to nd an optimal seat belt reminder, but rather to furnish some examples of how some sounds are perceived in a car driving environment. It should perhaps be pointed out that the presentation of popularity in gure 4 is somewhat simpli ed in order to make it interpretable. Some attempts were made to include also the intensity of opinion , i.e. whether a preference/rejection was the rst or third choice, in the graph. In the end it was decided that such further demonstration of the complexities of SBR made the presentation itself unnecessarily complex.
3.5 Summing up
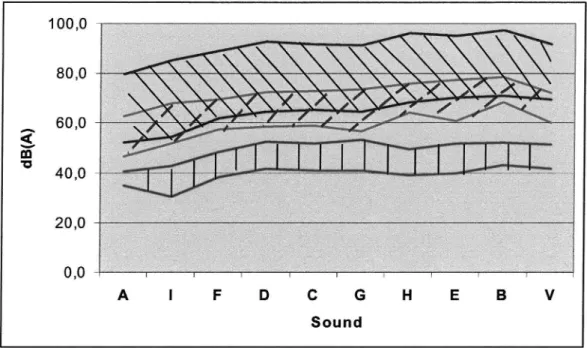
With the background of the study in mind, i. e. to present some data to be used as a basis for the development of criteria for seat belt reminders, the presentation of the results has put more emphasis on variability than on single means. Still another presentation of the wide variation, which must be considered if/when a
speci c sound level is set, is given in gure 5. In that gure the full range, where a sound was judged as audible , loud and clear or annoying by any ofthe subjects (calculated as the average for that subject), is presented for all the sounds. (Here it must be pointed out that it was not the same subject who consistently made the highest or lowest settings.)
The results for lowest and highest audible settings is of course in the lower half of the gure and the loudness range is indicated with vertical stripes between the low line and the high line. The results for Loud and clear are in the middle of gure 5 and the range is indicated
1 mixvm W
»
. v « Y§\\ V ¢r
6° 0 .
_
AW
40,0 ' -'-'"""
\l J/V
'
,
~
V
_
.TTT'.
100,0 80,0dB
(A
)
20,00,0
.
.
I
y
.
I,
,
;
Figure 5 Loudness ranges between the highest and lowest mean settings by any subject when the sound was judged as Just audible (// Loud and clear (/ / /) or Annoying (\ l l). SBR sounds ranked after upper setting of Loud and clear .
with dashed stripes, slanting to the upper right. The Annoying sound levels are at the top of the gure, with the upper and lower bounds united by stripes slanting to the upper left. As can be seen, there is a considerable overlap between the right-slanting and left-right-slanting areas.
4
Concluding comments
4.1 Methodological
There are a number of issues that should be kept in mind and considered when interpreting the results that were presented above. Some of these issues concern how the study was carried out, e.g. the experimental set up and the sound
measurements.
The experimental setting was partly prescribed beforehand by the stipulations in the Euro NCAP proposal, where it is stated that the actual test shall be done at 50km/h, which in this study made the background noise consist of prerecorded in-car noise from driving at a constant 50 km/h speed on the 5th gear, played back at a sound level of 60 dB(A). This level was chosen after checking a number of road tests, from which it appears that the background noise in modern cars is usually in between 58 62 dB(A)4 in this speed range. In this context it should be kept in mind that a change in this general background level should give a corresponding change in those settings which require a certain contrast between signal and
noise .
However, what is most important about the background noise is not its loudness, but rather its spectral composition, i.e.how much low or high frequency tones it contains. The driving conditions of the Euro NCAP proposal means that the background noise will contain much more low than high frequencies, relatively speaking. Other driving conditions, such as other gears or higher speeds will generate other proportions of low and high frequencies, which will produce masking effects that are quite different from this study. The relatively low settings that were obtained for the simple I sound might be an effect of some high frequency components which contrasted very well with this particular background noise. With another background it is possible that also the I sound might require the same loudness levels as the other sounds, but as long as no spectral analyses are carried out this is only a tentative hypothesis.
The selection of SBR sounds is also an important part of the experimental setting. It must be emphasized that the choice of the nine studied sounds was very arbitrary. An attempt was made to include both real and synthetic sounds, but it was not possible to cover all relevant sound dimensions in a systematic manner. So, the tested sounds can only be taken as a very small sample from an enormous population of hypothetical reminder sounds. And as indicated by the results of the sounds A and I, there might exist quite a few sounds that are perceived somewhat differently from all the others.
Another aspect of the experimental situation which perhaps should be emphasized is that it was experimental. The subjects did not have to do any driving or other tasks but could devote all their attentional capacity to the SBR sounds. This effect should not change the order between the tested sounds, but it probably made the subjects a little more sensitive than in an actual driving situation. Therefore, a more realistic estimate of audible or loud and clear sound levels is probably a few dB(A) higher than the results presented above. On the other hand, it can be argued that the reference sound V, which can be assumed to be fairly typical for that sound environment you get when you just don t care about turning down/switching off the car radio, was set at the same level as the 4 Checked in a number of available issues ofthe Swedish motor magazine Vz Bz lc'igare and the German motor magazine Auto, Motor und Sport from late summer-autumn 2001.
synthetic and experimental sounds. This interpretation would mean that the obtained sound levels could be fairly accurate estimates.
The sound measurements also constituted a methodological problem that should be pointed out. As mentioned in section 2.2 above, the measurement of rapidly changing sounds is not as self-evident as the measurement of homogeneous, continuous sounds. Differing sound level readings were obtained for all the nine sounds depending on whether the meter averaged over 1000 ms, 125 ms, 30 ms or gave actual, instantaneous peak values. This effect was particu-larly strong for the ticking A sound. For that sound it is highly uncertain if the presented sound levels represent the best approximation of how loud that sound was perceived by the subjects.
The variability in the data has already been mentioned in the Results chapter. But another aspect of variability could also be worthwhile pointing out. The technique of letting the subjects go both from high to low and from low to high (except in the annoyance setting, which was included mainly to have a high level to ascend from) permits rough estimates of how a certain loudness is experi-enced if a preceding sound level is noticeably louder or quieter. As shown in table 3 and 4 this effect amounts to around 5 dB(A) for most sounds.
4.2 Criteria for seat belt reminders
During the nal questioning of the subjects after their sessions it soon became apparent that asking about the preferred seat belt reminder was the wrong question (But too late to change the question!). From their general comments it was evident that some subjects made their choice based on the pleasantness of the sounds, while others had the aversive character of the sounds as main criterion. Typical comments were That s a nice sound, you could keep it on for a long time or That sound is terrible, all my passengers will put their belts on without a word from me . This basic difference in seat belt attitudes probably explains the con icting results presented in gure 5 above, but it also indicates a need for a stricter speci cation of the qualities of a seat belt reminder. Should a reminder be so smooth that it can be forgotten, or should it be so powerful as to be effective in all the cases when it is needed?
Another important decision concerns the selection of traf c conditions for the actual test. In this study the presently proposed conditions produced a background noise which is judged as far from representative for those situations where a SBR is mostly needed. Going 50 km/h at top gear means that you already have traveled a few blocks, or that you previously have been traveling even faster and has reduced your speed to 50. Therefore, it seems that a more valid test of seat belt sounds should be carried out with background noise corresponding to either low gear low speed-no wind conditions or high gear high speed-noticeable wind noise, or perhaps both if they are considered equally important.
4.3 Further research
The presented results cannot solve many of those problems involved in the speci cation of what should be required of good seat belt reminders. In fact, this study might rise more questions than it answers, but at least it highlights some
important issues that should be considered before the nal decision about requirements upon a perfect-good-acceptable seat belt reminder.
Considering both the anticipated effects of a good seat belt reminder, and the advantages of sound arguments from all concerned (authorities, manufacturers and users) it could be worthwhile investing in a somewhat more comprehensive project than the present.
With somewhat more economical resources and a lot more time available it should be possible to collect some really useful data on SBR sounds. Ideally such a study could be similar to the project on warning signals in civil aircraft carried out by Patterson and colleagues in Cambridge (Patterson, 1989). But on the other hand, they could work towards a rather unidimensional criterion aural effectiveness. In the eld of car safety it seems necessary to nd a compromise between, on the one hand, a sound which forces drivers and passengers to put on the belt, and on the other, a sound which does not frighten potential buyers.
That compromise ought to be a better compromise if there were more data available on e.g.
- which frequencies that are easiest to hear under various driving conditions, what sound qualities that give positive or negative associations to a sound. But rst, perhaps it should be established if an acoustical signal has any effect at all on seat belt use.
References
Dahlstedt, Sven: (1999) Non-users motives for not wearing the seat belt. AAAM 43Fd Ann. Con , 20-22 Sept 1999, Barcelona, Spain.
Euro NCAP: (2001) Belt Reminder Assessment Protocol. Draft proposal for the TWG meeting, prepared by Anders Lie, Swedish Road Administration
2001-11-18.
Patterson, RD: (1989) Guidelines for the design of auditory warning sounds. Proc. Inst of Acoustics, Vol 11, part 5, pp17-24.
Scharf, B. and Houtsma, A.J.M.: (1986) Audition II Loudness, pitch, localisation, aural distortion and pathology. Ch 15 in Boff, K.R., Kaufman, L. and Thomas, J.P.; Handbook of Perception and Human Performance. John Wiley, New York 1986.
Appendix 1
p 1 (6)
Sound presentation
For each of the tested sounds the distribution of sound pressure over a complete cycle is shown, with the exception of sound A, where 8 cycles are shown. The graphs give some indications of the peakedness of each sound, which is also indicated by the different readings that are obtained with different time settings on the sound level meter. These readings are presented in the text below each graph.
A_Tick
Eight old-fashioned Ticks produced electro-mechanically at a rate of about 200 ticks per minute.
Sound level measures: dB(A) gures presented in the paper can be approximately transformed from
Fast (125ms) to
.. Slow (1000 ms) by adding 0,5 dB(A) .. Impulse (35 ms) by adding 5,9 dB(A) .. Peak (3 10 us) by adding 20,5 dB(A)
Appendix 1
p 2 (6)
g s éé_ g t s §a g . _ 8 La'3 -u l I r g»: 11354! £013.15?" V
B_Chime
One Chime tone produced electronically at a rate of 51 such doiinnggs per minute.
Sound level measures: dB(A) gures presented in the paper can be approximately transformed from
Fast (125 ms) to
.. Slow (1000 ms) by subtracting 0,9 dB(A) .. Impulse (35 ms) by adding 0,5 dB(A) .. Peak (3-10 us) by adding 3,1 dB(A)
I, __ 'l ' m '42 '45 Zn 3» '41 A» 24» g :a a I}; an fax {a a a 5 42 in ' z .395! 'ng slaw} ma a, . [E
C_Kvm
Female human voice saying Bilbc'iltet, tapc i bilbc'iltet (The seat belt, put on the seat belt) 22 times per minute.
Sound level measures: dB(A) gures presented in the paper can be approximately transformed from
Fast (125ms) to
.. Slow (1000 ms) by subtracting 3,5 dB(A) .. Impulse (35 ms) by adding 3,2 dB(A) .. Peak (3-10 us) by adding 13,5 dB(A)
Appendix 1 iaflllka- J-VUV ' > I oamoomo .moomo W _ i Record Take 001 4.2 45 41 Q 3h} , i 91:34 Q. 00 :
D_F|n
A harmonic major triad, 35 such ding-ding dong cycles per minute
Sound level measures: dB(A) gures presented in the paper can be approximately transformed from
Fast (125ms) to
.. Slow (1000 ms) by subtracting 1,5 dB(A) .. Impulse (35 ms) by adding 0,8 dB(A) .. Peak (3-10 us) by adding 10,5 dB(A)
___ if M i -m RecordTake 617 4.2 4.5 4,1 340 4.5 7%: giiigv 42,0 -' - .l . i Q { 23
....'wl.w...1..».a.a*....1.v...z - _
-
, .
E_Ful
A disharmonic triad, 36 such plong-plong-plong cycles per minute.
Sound level measures: dB(A) gures presented in the paper can be approximately transformed from
Fast (125ms) to
.. Slow (1000 ms) by subtracting 1,7 dB(A) .. Impulse (35 ms) by adding 0,8 dB(A) .. Peak (3-10 usek) by adding 9,7 dB(A)
Appendix 1
p 4 (6)
ma
gm
'
i
73;} may;
,
,
. _ p I p
I. L
p
y g
V g
V
F_Man
Male human voice saying Bilbc'iltet, ta pd bilbc'iltet (The seat belt, put on the seat belt) 25 times per minute.
Sound level measures: dB(A) gures presented in the paper can be approximately transformed from
Fast (125ms) to
.. Slow (1000 ms) by subtracting 3,1 dB(A) .. Impulse (35 ms) by adding 2,5 dB(A) .. Peak (3 10 us) by adding 13,5 dB(A)
, . Recordth
01 ] ' ' 5 V D 1:64 0 Q 0,
G_M USI k
One bar of a simple melody (same as I_Simple) presented from a fairly well sounding piano, 29 such cycles per minute.
Sound level measures: dB(A) gures presented in the paper can be approximately transformed from
Fast (125ms) to
.. Slow (1000 ms) by subtracting 2,5 dB(A) .. Impulse (35 ms) by adding 1,5 dB(A) .. Peak (3-10 us) by adding 12,1 dB(A)
Appendix 1
p 5 (6)
e t ét éét t t k 3: ¢ 42 gain I _ i I _ r-fo my} 31 hwy} EH_Ring
One RRRiinggg produced electronically at a rate of 25 such ringings per minute.
Sound level measures: dB(A) gures presented in the paper can be approximately transformed from
Fast (125ms) to
.. Slow (1000 ms) by subtracting 1,2 dB(A) .. Impulse (35 ms) by adding 0,9 dB(A) .. Peak (3-10 us) by adding 11,2 dB(A)
«mil
C10 «j 31212.1
I_Simple
One bar of a simple melody (same as G_Music) made up of practically pure tones, 29 such cycles per minute.
Sound level measures: dB(A) gures presented in the paper can be approximately transformed from
Fast (125ms) to
.. Slow (1000 ms) by subtracting 1,2 dB(A) .. Impulse (35 ms) by adding 1,1 dB(A) .. Peak (3-10 us) by adding 13,5 dB(A)
Appendix 1
p 6 (6)
Reference sound, V_vaeder
;..v..l.1s.«. l . .' .«.~I122.
"
y
12 sec excerpt from the complete le Female voice reading:
Skagen. . (observations). . . .Nora'koster.. (observations) . .. Vadero arna.. (observations) ... Mc isb skc ir.. (observations). . . Trubaa uren. . (observations) . . . . ..
