Compensation to executives
High, low or nothing?
Authors:
Håkan Mattsson
Roger
Nordahl
Subject:
Business administration, Finance
Gotland University: VT 2010
Master thesis 15 ECTS
Supervisor: Adri de Ridder
Abstract
Prior studies argue that the board and management of a firm should maximize
shareholder value. Also, there is evidence that compensation levels are linked to firm performance as well as monitoring, in other words, the composition of the board influence compensation.
We document no correlation between CEO compensation and firm performance for a sample of Swedish companies listed on the Stockholm Stock Exchange (SSE) over the sample period 1999 to 2008. However, the Industry firms might pay the CEO for performance. Also, stock ownership influence compensation levels; when the five largest shareholders increase their holdings, CEO compensation levels decrease. We interpret this finding as that monitoring is important and the agency costs can be reduced by higher holdings by institutional investors.
Keyword: Business of administration, Finance, Corporate governance, Executive compensation, Bonuses, Performance
Contents
1 Introduction ... 1
1.1 Background ... 1
2 Previous studies ... 4
2.1 Summary of previous studies ... 8
3 Method ... 10 3.1 Definitions of variables ... 11 4 Result ... 13 5 Conclusion ... 18 5.1 Further research ... 18 Tables ... 19 References ... 25
1
1 Introduction
There is a growing world debate about the bonuses and incentive programs for executives and board members as a reaction to the financial crisis that has hit the world economy the recent years. Political leaders around the world campaigned for a change in bonuses to business executives. What we can interpret from the public debate is that the financial crisis would be the fruit of excessive compensation. At the meeting of world finance ministers in London, the G 20 meeting, they failed to put the principles of bonus ceiling for high bank managers. In the U.S., for example, president Obama consider tax on large banks which should be seen as a punishment for the high bonuses1. According to Anders Borg, Finance Minister of Sweden, who also participated in the debate on bank bonuses, it’s not reasonable with granted bonuses and they do not belong to a sound risk culture2. Mats Odell, minister of Financial Market, is strongly critical to the way Swedish bank’s acting regarding bonuses. “- In the middle of this financial crisis the bonuses have risen, not only in as a share of the result but also in real numbers and that’s very remarkable and upset.”3 People seem to agree that excess reward systems damage corporate reputation, long-term development and society would be negative.
1.1 Background
In order to improve corporate governance in Sweden and as a complement to public regulation (Governance Board, 2010) the Swedish Code of Corporate Governance was introduced in 2005 has since that been revised and was initially for the listed larger companies but to be applicable to all Swedish companies that are listed on the Stockholm Stock Exchange (SSE). The Swedish Corporate Governance Board emphasizes that good corporate governance in the companies promotes confidence to investors and thereby improves conditions for equity (Governance Board, 2010). Shareholders in a company provide not only equity but they also create power balance between shareholders, board and CEO during annual general meetings (AGM). Large shareholders are expected to take more responsibility but are not supposed to misuse their position to harm the company or other shareholders. AGM
1
DI, 2010-01-13 ”Obama planerar särskild bankavgift i USA” 2
DI, 2009-11-27 ”Borg: Ser gärna skärpta regler mot bonus” 3
2
is the only forum where shareholders have influence over the board and CEO (Aktiebolagslagen, 2005).
Shareholders expect the Board of the firm and the CEO act in order to maximize shareholders’ wealth. However, it’s not always the case, for example when the CEO has a strong position. The CEO might have other interest, and therefore not always maximizes shareholder wealth (Jensen and Murpy, 1990). Agency relationship should be viewed as a contract between the client and another person acting on behalf of the principal. The client should provide incentives and monitoring aimed that the agent shall act in the client's best interests. In some situations it is better to pay the agent a higher payment to ensure that he does not make decisions affecting the client negatively. This means that the agency costs are the outlay for the cost of monitoring, higher payments to the agent and other costs if the agent takes the wrong decision resulting in a reduction of principal’s interests. (Jensen and Meckling, 1976)
Depending on if there is a single major shareholder or not, the conditions for the CEO would be different. When the CEO has substantial influence over its own compensation it is subject to be maximized and influenced of industry trends and company size. However, with an externally controlled company, CEO compensation is minimized and therefore the company might have problem to retain and attract a satisfactory CEO (Hambrick and Finkelstein, 1995). The Board and the CEO are the shareholders representatives and should maximize value of their investment. Boards do not take in account stock market development as they evaluate the performance of CEO. Nor do they look at the development process to establish levels of compensation to the CEO. The boards do not take their responsibility towards shareholders as compensation increases regardless development of the share (Kerr and Bettis, 1987). Also, the Board of Directors serves as an important internal control function when deciding on CEO compensation. Boyd (1994) finds the CEO salaries lower in firms with higher level of control. However, he did not find major relationship between CEO compensation and the size of the companies and their profitability.
Core et al. (1999) find that CEO compensation is higher when the Board has more members and the CEO compensation decreases when there are large shareholders who own at least 5% of the company. In recent studies by Croci et al. (2010) they
3
document a positive correlation between Board size and CEO compensation. Previous studies show that ownership structure can affect executive compensation. Hartzell and Starks (2003) find that companies with a higher level and concentration of institutional shareholders show a lower level of compensation. However, Croci et al. (2010) find that institutional ownership has no impact on the CEO compensation. After we studied a number of articles, we find out that there are several factors that can explain CEO compensation levels. On one hand researchers argue that compensation is linked to firm performance, but on the other hand, other scholars argue that some additional factors are related to CEO compensation levels as well.
In this paper we examine CEO compensation and its correlation to firm performance, and if there is a difference between industries. Specifically, we raise the question if a large board, and hence more divergence of opinion within the board, is associated with higher CEO compensation. Contrary, we would expect that a small board monitor the CEO more in details, hence it would be associated with a lower CEO compensation.
The reminder of this paper is organized as follows. Section 2 describes the previous studies. Section 3 describes methods used in this study. Section 4 presents the result of this study. Section 5 concludes.
4
2 Previous studies
We find out most studies have similar approaches with varying results. In this chapter, we introduce adequate research that give us a deeper knowledge of the subject which our study based on, put the reader in the subject and in the analyze part compare with our findings.
Jensen and Meckling (1976) argue that agency relationship should be viewed as a contract between the principal and the agent acting on behalf of the principal. The principal cannot be sure that the agent will work for principals’ best because both parts considered being utility maximizers. However, the client should provide incentives and monitor aimed at the agent shall act for the client's best interests. In some situations it is better to pay the agent a higher payment to ensure that the he does not take decisions affecting the client than to expand monitoring costs. Furthermore, the researchers consider that it is impossible to ensure at a zero cost that the agent’s decisions always give the maximum welfare to the client. This means the agency costs are the outlay for the cost of monitoring, higher payments to the agent and other costs if the agents make wrong decision resulting in a reduction of principal’s welfare.
The United Shareholders Association in U.S. and regulators are pressuring U.S. companies not to have the same person as the CEO and Chairman of the Board, in order to not concentrate executive power in one person (Brickley et al. 1997). Brickley et al. (1997) argue that separating the roles will reduce agency costs and improve performance in corporations and that this separation has potential costs as well as potential benefits, but their evidence suggests that the costs of separation are larger than the benefits for majority of the large firms.
The Board and the CEO are the shareholders representatives and they should work for the shareholders' best interests. This is supported by the Swedish Companies Act (Aktiebolagslagen, 2005). Kerr and Bettis (1987) present a number of researchers who argue that the board and management should maximize value of shareholders' investment. Kerr and Bettis (1987) also find that boards do not take in account the
5
stock market development when evaluating CEO performance. Nor do they look at the development process to establish levels of compensation to the CEO. They argue that the boards do not take their responsibility towards shareholders as compensation increases regardless of the share's development. Jensen and Murphy (1990) points out that the CEO of large firms compared to those in small companies has fewer shares and has lower incentive-based compensation, and it can partly be explained by the fact that the CEO has more power in smaller companies.
Tosi et al. (2000) examined whether there is a correlation between CEO pay and firm performance or a link between CEO pay and firm size. They find out that the correlation between CEO pay and firm size was 0.63 and the firm size accounts for about 40 percent of the variation in CEO pay. The correlation between CEO pay and Return on Equity (ROE) was 0.212. ROE account for 4.4 percent of the variance in CEO pay. Moreover, Finkelstein and Boyd (1998) find that the correlation between CEO Compensation and ROE was 0.13. Belliveau et al. (1996) find in their studies that the correlation was 0.410 between CEO pay and ROE.
Boyd (1994) argues that the Board of Directors serves as an important internal control function when deciding on CEO compensation. He concludes in his study that the CEO salary was lower in firms with higher level of control. However, he did not find any major correlation between CEO compensation, the size of the companies and their profitability. Yermack (1996) find evidence consistent with Jensen (1993) among others, stating that unsatisfactory performance of large boards is the result of lack of communication and problems in decision making process. He uses Tobins Q with data from 452 companies from 1984-91 and finds an opposite relationship between board size and firm value.
In most countries, including Sweden, companies have a committee to decide on the remuneration of senior executives. This committee should, if possible, be independent members of the board. Daily et al. (1998) examine if composition of members in compensation committees affects the level of compensation for CEO. However, they did not find strong enough relationship for the above mentioned hypotheses. The researchers argue that the composition of the Compensation
6
Committee does not have a major role in determining compensation levels for CEOs. This should been seen as an inverse relationship to the agency theory.
Core et al. (1999) investigate whether there is a correlation between levels of CEO compensation and the quality of the company's Corporate Governance. They find that CEO compensation is higher when: the board has more members, has more outside members and when the CEO has more than three directorships. However, they find that CEO compensation decreases as their stakes grow in the company and when there are large shareholders who own at least 5 percent of the company. Furthermore, they find when the CEO does not belong to the Board and CEO have at least 5 percent of the shares is associated with lower compensation. Chhaochharia and Grinstein (2009) find in their study that increased claim for board structures and procedures of deciding about compensation levels and the presence of large block holders in the boards reduce the size of CEO compensation.
Hambrick and Finkelstein (1995) present that differences in ownership are related to the level of remuneration of the CEO. Depending on if there is a single major shareholder or not differentiates the conditions for the CEO. When the CEO has substantial influence on his compensation it is subject to maximize and influenced of industry trends and company size. However, with an externally controlled company, CEO compensation is minimized and therefore the company might have problem to retain and attract a satisfactory CEO. Hartzell and Starks (2003) examined the relationship between institutional ownership and compensation of senior executives. The first measure they use is the proportion of the institutional shareholders in relation to shares held by five biggest institutional shareholders. The second measure is Herfindal index where ownership concentration is calculated. They find that companies with a higher concentration of institutional shareholders showed a lower level of compensation. They add that the findings support the theory that institutional ownership affects the structure of the senior executives' compensation. They also point out that institutional investors prefer to invest in companies that reward for performance.
Croci et al. (2010) studied whether the institutional ownership affects the level of CEO compensation in companies in Central Europe. They find that institutional
7
ownership has no impact on the CEO compensation. Moreover, they find a weak correlation between the Market-to-book ratio (M/B), Board Size to CEO compensation. However, they find stronger relation between performances and CEO compensation.
8 2.1 Summary of previous studies
In this table we summarize previous studies of the subject which our study based on. These studies show the relationship between CEO compensation and corporate governance. The results of the reports indicate that there are other variables than performance that are the basis for wage determination for the CEO.
Author Study Result
Jensen and Meckling (1976). Agency theory. Agency costs are the outlay for the cost of monitoring, higher payments to the agent and other costs if the agents make wrong decision resulting in a reduction of principal’s welfare.
Brickley et al. (1977). Agency theory. The United Shareholders Association argues that separating the role of CEO and Chairman of the board will reduce agency costs and improve performance in corporation.
The authors stress that the costs of this separation are larger than the benefits.
Kerr and Bettis (1987). CEO Compensation, Board responsibility and CEO performance.
They argue that the boards do not take their responsibility towards shareholders as compensation increases regardless of the share's development.
Tosi et al. (2000). CEO compensation. Firm performance and Firm size.
They find strong correlation between CEO pay and firm size. The correlation between CEO pay and ROE was weak. Jensen and Murphy (1990). CEO compensation and
Corporate Governance.
They point out that the CEO of large firms has lower incentive-based compensation than in small companies.
Boyd (1994). CEO compensation and Corporate Governance.
He did not find major relationship between CEO compensation and the size of the companies and their profitability.
Yermack (1996). CEO compensation and Corporate Governance.
He did find a relationship between board size and firm value.
Daily et al. (1998). CEO compensation and Corporate Governance.
They argue that the composition of the Compensation
Committee does not have a major role in determining compensation levels for CEO. This should been seen as an inverse relationship to the agency theory.
9
Core et al. (1999). They investigates whether there is a correlation between levels of CEO compensation and the quality of the company's Corporate Governance.
They find that CEO
compensation is higher when the board has more members.
Chhaochharia and Grinstein (2009).
CEO compensation and Corporate Governance.
They find that increased claim for board structures and procedures in deciding about compensation levels and the presence of large block holders in the boards reduces the size of CEO compensation.
Hambrick and Finkelstein (1995).
The Effects of Ownership Structure.
They show that differences in ownership configurations affect the determination of CEO pay and with an externally controlled company, CEO compensation is minimized. Hartzell and Starks (2003). The Effects of Ownership
Structure. They examined the relationship between
institutional ownership and compensation of senior executives.
They find that companies with a higher level and concentration of institutional shareholders showed a lower level of compensation.
Croci et al. (2010). The Effects of Ownership Structure. They studied if the institutional ownership affects the level of CEO Compensation in companies from Central Europe.
They find that institutional ownership has no impact on the CEO compensation
10
3 Method
To be able to answer our research question we use a cross sectional research design. According to Bryman and Bell (2007) and Malhotra and Birks (2007), a cross sectional research design implies collection of data from several cases at one specific time. In our case data is CEO and Board of Directors compensation, other different compensations and variables. We have chosen to examine companies at Stockholm NASDAQ OMX between 1999 and 2008. To be able to reach the bigger part of market value we select the 30 largest companies which considered for approximately 85% of the market capitalization in Large Cap. This give 300 year observations but some observations are excluded because of the limitation to find data. Therefore, we ended up with 292 year observations. In order to compare changes in senior management compensation and the companies' market valuation over the time, we have chooses to start with companies in the Large Cap composition 2010-01-01. We excluded companies that have their main listing in other countries than Sweden4. It implies that, the remaining 30 largest companies are subjected to the same accounting policies and increases the conditions to obtain data from the same source. In Sweden, CEO compensation is not so well-studied subject which may be because it is a minor stock market compared to United States. For instance, Singh and Davidson (2001) analyze a sample of 1,528 firms at NYSE, AMEX and NASDAQ. Our primary data is collected from companies annual reports between 1999-2008 when these, according to Swedish Companies Act (Aktiebolagslagen, 2005), give the information we need. We use a deductive approach that means our starting point is previous studies which we apply with secondary data from the annual reports. In other words, this data is our empirical material. The thesis should subsequently be reliable and replicable. Bryman and Bell (2007, p. 55) continue:”… in order to collect a body of quantitative or quantifiable data in connection to two or more variables (usually many more than two) which are then examined in order to detect patterns of association.” The quantitative or quantifiable data we collect shall be systemized and standardized so we can do some form of conclusion or find a correlation.
4
11
There are different approaches to carry out a study of a corporate action. MacKinlay (1997) argues that event studies in combination with the use of market data is a flexible approach to measure and verify what a specific corporate action have to the company's value. MacKinlay (1997) also believes that a business case should be directly reflected in the prices of securities and to measure the potential economic impact on the company used prices observed over a relatively short period. The above problem will therefore be similar to the studies presented in Chapter 2 and can be answered by using the event study. Since this study is based on the conditions on closing date the content of the financial statements is of central importance.
3.1 Definitions of variables
The key figures used in different variables are collected from the company’s financial statements, downloaded from their official websites or collected from Almedalsbiblioteket5 archives of annual reports of Swedish companies listed on the SSE, except share price at year-end trading day which is taken from NASDAQ OMX website. We define CEO compensation as salary and bonuses in fixed prices 2008. Companies can also reward their top executives with stock options. Kerr and Bettis (1987) argue that stock options are an important part of the senior executives' compensation. They add that it is difficult to value options when there is only one theoretical acceptance of valuation model, Black and Scholes valuation, and this is used for options that are not traded and hence have no market value. Initially our intention was to include stock options, but after we recognized different versions of options and as Kerr and Bettis (1987) find it difficult to value options we decided to exclude them. Similarly to CEO, Group management has fixed salary and bonuses. This variable excludes the CEO compensation. Board of Directors measures the total board fee to the Board of Directors, including the chairman and only for the work in the board. Fee paid to board members for work in nomination and compensation committee are excluded. CEO / Group management is CEO compensation divided by Group management compensation and measure the power of CEO in daily work. CEO / Board measure the relation between CEO compensation and the Board of Directors compensation to demonstrate the power of CEO in agency perspective.
5
12
We use M/B as market price per share divided by book value of equity per share at the end of the year. ROE is the percentage a company earns on its total equity in a given year. It is calculated by dividing the company's net income related to shareholders by its shareholder equity. Market Capitalization is company’s total equity market value expressed in millions of SEK. It equals shares outstanding at year end multiplied with the closing stock price at year end. Net profit is calculated by subtracting a company's total expenses and minority interest from total revenue, thus showing what the company has earned in a given year related to shareholders. Number in Boards is the members nominated at the AGM, labor representatives are excluded.
13
4 Result
Table 1 present descriptive data for our sample. Panel A lists the firm size and Column 1 summarizes the values from the sample period 1999-2008. Firm size interval varies between 361- to 1 254 million SEK. The average is 80 559 and median 49 086 million SEK. That skewness is explained by the fact that SSE, Large Cap contains a few companies with high market values. In our sample, year 2008 shows a decrease of the total market capitalization in our sample at -42.5 percent from the previous year. In Panel B we report Net Profit in million SEK. Column 1 shows strong variations in the lowest and highest values, from -36,718 to 36,999 million SEK. The low values for year 2002 may be related to IT collapse and values for 2008 are related to financial crash. Panel C shows that the CEO mean compensation has increased by 76 percent from 1999 to 2008 which is a yearly increase with 5.8 percent, and lowest level was doubled from year 1999 to 2008. In Panel D we report the Group Management compensations. The average is 36 222 and the median is 33 487 TSEK. Nevertheless, there are important differences between the lowest and the highest value which can be explained by the variation of members in Group Management. Panel E shows the Board of Directors compensations. The average compensation increased by 71 percent from 1999 to 2008. The above-mentioned payments are purchasing power adjusted so that comparisons can be made over time.
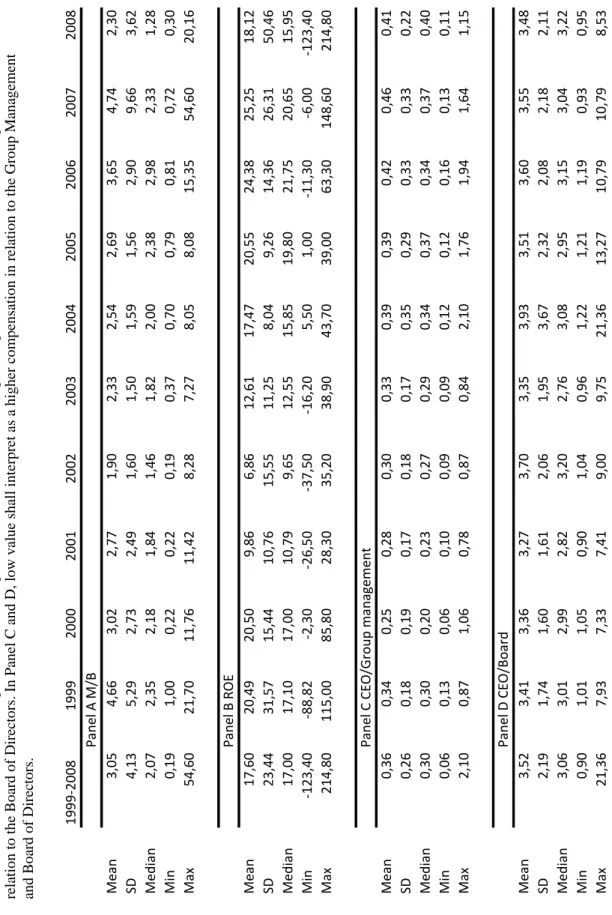
In Table 2 Panel A, we report M/B ratio, the relationship between the price of shares and the book value of equity per share. The median value is 2.07. This might imply that these companies are rated low or has strong balance sheet. The extremely high values come mostly from two companies. For the years 1999-2001, we find Hennes & Mauritz and for the years 2006-2008 Swedish Match. Explanation of these values, for the latter, can be that Swedish Match made repurchase of own shares at 3 679 million SEK and therefore the equity decreases. Panel B shows the ROE. The mean is 17.6 for the period and median is 17 percent, which means that the sample is normally distributed. For the years 1999 and 2008 reported extremely low and high values. Panel C shows the CEO compensation in relation to the Group Management. High values mean that the CEO has high compensation in relation to Group
14
Management. The mean value shows stability over the period. The maximum value is 2.10 which can be interpreted as the CEO has 2.10 times more in compensation than the Group Management. Panel D shows CEO compensation in relation to the Board of Directors. High values mean that CEO compensation is high relative to the Board of Directors. The minimum value is 0.90 and belongs to Swedbank and the highest value report MEDA AB 21.4. This company also report high values for the years 2004-2007.
Table 3 presents the same variables as in Table 2 but the companies are divided into three groups based on industry; Finance, Industry and Others. In group Others features in particular information technology and consumer goods. Panel A shows the Market to Book Ratio. The group Other has 5.27 in M / B, which means that the market valuation of these companies is higher than the other groups. Panel B shows the ROE and companies in the group Other reports an higher ROE than Finance and Industry. The Group Finance reported as lowest -123 percent ROE. Industry shows a more even distribution, the average is 16.9 and 15.7 in median. Panel C shows the Net Profit and Finance reported a higher net profit mean and median value than in the other groups. However, big differences reports in the lowest and highest value. Panel D shows the CEO/Group Management. In group Others, CEO reports a higher compensation relative to the Group Management on average than the other groups. In Panel E we report the CEO / Board of Directors. CEO of Group Other shows higher level of compensation in relation to the Group of Directors. Extreme value is 21.36 which we can interpret as the CEO has 21.36 times more in compensation than the Group of Directors.
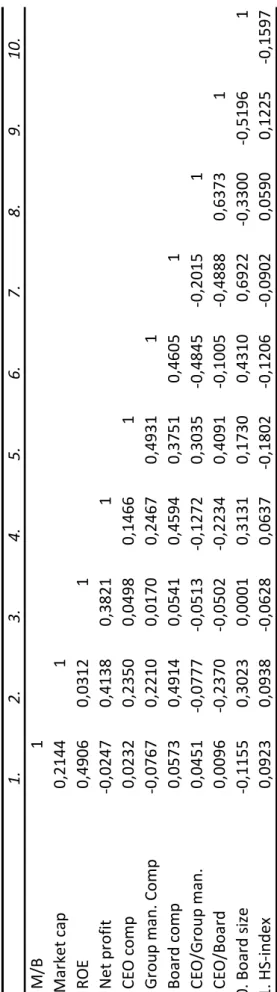
Table 4 presents descriptive data and how variables co-vary. There is no link between CEO compensation and M/B ratio. However, we find a negative correlation between M/B ratio and Board size, consistent with Yermack (1996) using Tobins Q. Among the CEO compensation, Group Management compensation and Board of Directors compensation to Market Cap all three have a positive correlation. This means that companies with high market values pay higher compensation to top executives on average. Between Market Cap and number of the board there is a positive correlation which means that large companies have more board members in average. There is no relation between CEO Compensation and ROE, but the CEO
15
compensation, Group Management and Board of Directors compensation to Net profit is positively related, 0.14, 0.24 and 0.46. The correlation between Net Profit and number of the Board of Directors is 0.31. Boyd (1998) reports a negative correlation when he makes control of Board Control against CEO Compensation. This might be interpreted, as the better Board of Directors is to manage CEO the lower compensation has the CEO and that Board of Directors thus acts as a control function. We find a positive correlation between CEO- and Board of Directors- compensation, which we interpret as a tendency that monitoring does not work in Sweden in general. However, we find a negative correlation between CEO strength and Company size, in larger companies, CEO have less power compared to the Board. This can be interpreted as the control functions in large companies as the board monitor that its shareholders have a return on what they invested. This is consistent with Jensen and Murpy (1990) as they find a negative correlation between power and Company size.
Table 5 reports estimated regression coefficients with OLS-results, using the CEO compensation as a dependent variable. As the M/B ratio and ROE shows no significance and Net Profit only significance at 10% level to CEO compensation, we control the other independent variables separately in order to demonstrate their contribution to the R-Square value. The model 1 presents a positive and significant relationship between Market Cap and CEO compensation, with an R-square of 0.17. In Model 2 we control the CEO / Board of Directors instead of Market Cap and receive a higher R-Square value of 0.20. Net Profit and CEO / Board of Directors show a positive and statistically significant relationship to CEO compensation. In model 3 we control Hartzell-Starks index (HS-index) and we find a negative relationship to CEO compensation of -0.8 and it is statistically significant at the 1% level. Net Profit exhibits a positive relationship of 1.42 and statistically significant at 1% level. R-Square value is low, at 0.10. In model 4 we control Board size and we find a positive relationship to CEO Compensation of 0.06 and are statistically significant at the 1% level. R-Square value is only 0.06. Since we find no overall correlation between CEO compensation and profitability, consistent with Kerr and Bettis (1987), it is doubtful whether if agent theory presents the reality. In our sample
16
we find a nonexistent link between CEO compensation and profitability and hence tendency that agent does not act in the shareholder best interest.
Model 5 presents a positive correlation between Market Cap and CEO compensation, statistically significant at 1% level. This is consistent on the one hand with Tosi et al. (2000) and Croci et al. (2010) who find a weak correlation, on the other hand Boyd (1998) find no correlation between these variables. We interpret this as the CEO for major companies have compensations for greater responsibility which also Croci et al. (2010) argue for. Large companies are more complex and difficult to manage as they mostly are multinational in difference to small companies. We find a positive correlation between Board size and CEO compensation, consistent with Core et al. (1999) and Croci et al. (2010). We interpret that larger boards do not act in shareholder interest with ineffective monitoring as result, Yermack (1996) among others argue that this can be explained by the fact that larger boards have problems with communication and decision making which burden such groups. Jensen (1993) explains it with that the larger Boards are more susceptible for influence from CEO. We have in collection of data find tendency that CEO has multiple Boards assignments and correspondently, i.e. same person have assignments in several companies, not reported in tables. This may mean that with a common social network it is difficult to make decision in an objective manner, but it can be seen as consistent with Croci et al. (2010) discussion about directors with multiple assignments are less likely to monitor CEO compensation effectively. Core et al. (1999) have a similarly discussion about too many assignments. For HS-index we report a negative and statistically significant relationship at the 1% level, consistent with Hartzell och Starks (2003). This can be suggested as that concentrated institutional holdings provide a more effective monitoring and institutional shareholders are thus actively shareholders. The model has an R-Square value of 0.61.
In Table 6 we divide our sample into different groups according to Global Industry Classification System (GICS) to study possible interesting differences between the three groups. We find no significant relation between M/B and CEO compensation for the entire group, for Finance firms we present significant negatively correlation. This is contrary to what Croci et al. (2010) report when they find a weak positive correlation between M/B and CEO compensation. This discrepancy can be explained
17
by the fact that companies in this group increase their equity due to change in regulation6. Belliveau (1996), Finkelstein and Boyd (1998) and Tosi et al. (2000) find a positive correlation between ROE and CEO compensation. We find a strong positive correlation in the group Industry. This, we interpret as industry companies probable use ROE or similarly as a determining variable for CEO bonuses. An industry company in our sample has a large part of the compensation related to Return On Capital Employed (ROCE). There are a tendency to that CEO actually is paid for performance in the Industry group. We also find a strong negative correlation in group Finance which also here is likely due to increase of banks capital requirements. This might explain the differences in previous studies. Our sample presents no major difference between the groups in Company size, but in the group Others there is a smaller impact on CEO compensation. The underlying reason to this is difficult to analyze since that group contain companies in too differently industries.
6
18
5 Conclusion
Swedish companies with high market values pay higher compensation to top executives on average. We interpret this as the CEO for large companies have compensations because of the greater responsibility. Large companies are more complex and difficult to manage as they mostly are multinational in difference to small companies. While we find no overall correlation between CEO compensation and performance there are other variables which have impact on CEO compensation. However, in the group Industry, companies use ROE or similarly as a determining variable for CEO bonuses, and there is a tendency to that the CEO is actually paid for performance in this group.
Moreover, we report a positive correlation between CEO- and Board of Directors- compensation and we also find a positive correlation between Board size and CEO compensation. A possible interpretation is that CEO with multiple Board assignments and board members with divergence of opinion might have difficult to make decision in an objective manner and therefore does not act in the shareholder interest. Furthermore, we find a negative correlation between CEO strength and Company size, therefore in larger companies CEO has less power compared to the board. This indicates existence of a control function in large companies and hence the shareholders have a possibility to a return on what they invested.
Finally, more concentrated institutional holdings lead to decrease of CEO compensation. This suggest that major shareholders have a greater responsibility and exert its influence at AGM, but also in board work as they have the right to a board seat if they have a certain rate of votes. The interest for this member is to act in the shareholder interest rather than for his own.
5.1 Further research
Further research in the field of options, convertibles and similar compensations, which in many cases tend to give a stock market reaction, would be interesting. Clearer rules on the valuation of these sorts of compensation had facilitated the research in this area.
19
Tables
Table 1 Descriptive sta
tistics
This table presents data for
th e v ariab les: Market Cap in pan el A , Net Profit in Pan el B , C E O Compensation in p an el C , Group M an agement Co mpensation in Panel D and Bo ard Compensatio n in p
anel E over the samp
le p eri od 1999-2008. We d efin e Mark et capitalization as number of shares outstand ing multip lied by the pr ice of the s h ares a t the end of ea ch y ear . Ne t P rofit is r ela ted to shar ehold ers. CEO Comp ensa tion is ca lcu lat ed as sal ar y p lus b
onuses and oth
er payments. Group Management Co mpensatio n is salary p lus b
onus and Board
Compensation is related to th e B o ard of Director
s work. All Compen
sation is adju sted for inflation and r ep o rted in 2008 pu rchasing power. To redu ce the imp act of ou tliers, all continuous v ariab les h ave b een winsorize d at the 1 st and 99 th p ercen til e res p ect ively . 1999 ‐2 0 0 8 1 9 9 92 0 0 02 0 0 12 0 0 2 2 0 0 32 0 0 42 0 0 52 0 0 62 0 0 72 0 0 8 Panel A Ma rket ca p MSEK Me an 8 0 55 9 1 05 35 9 9 4 31 2 7 7 61 8 4 6 595 5 9 28 0 7 1 40 1 8 9 749 10 7 76 0 9 9 76 4 5 7 40 9 SD 1 1 7 40 3 2 35 6 9 0 185 55 5 1 0 1 00 9 4 6 127 5 8 85 2 7 9 40 8 9 6 105 10 4 30 3 9 1 33 9 5 9 06 3 Me d ia n 4 9 08 6 6 4 16 9 5 1 15 7 5 7 92 4 3 7 277 4 1 06 5 4 4 75 5 5 4 359 5 8 99 9 5 6 21 3 3 2 82 1 M in 3 61 36 1 3 86 46 3 6 6 7 1 27 0 2 38 5 5 14 8 9 11 8 1 0 37 5 4 86 8 Ma x 1 25 4 19 5 1 25 4 1 9 5 979 70 1 5 1 7 24 6 1 7 4 087 22 4 85 9 3 68 1 6 7 472 120 47 1 48 2 3 41 743 24 6 60 6 Panel B Net pro fit MSEK M ea n 4 8 8 25 2 5 05 3 0 51 8 5 8 9 1 5 2 7 9 04 9 7 17 7 7 48 9 0 77 5 9 33 3 3 8 SD 8 1 1 67 4 1 25 9 9 75 9 9 65 5 3 8 4 5 3 65 1 0 99 4 6 38 9 0 57 8 6 8 1 3 1 3 2 M ed ia n 3 2 6 34 2 1 23 3 6 91 3 7 91 0 4 2 1 9 4 33 3 4 74 3 5 16 0 1 24 4 9 34 1 9 5 Mi n ‐3 671 8 ‐65 ‐43 9 ‐22 88 6 ‐20 563 ‐1 150 0 9 2 ‐152 ‐382 1 ‐2 010 ‐3 671 8 M ax 4 699 9 376 80 24 93 3 1 57 00 8 740 1 456 4 207 99 46 999 3 0 0 9 1 3 0 549 29 21 0 Panel C CE O compens ation TS EK Me an 1 0 57 8 7 45 9 8 01 2 8 24 0 9 098 9 02 2 1 1 13 1 1 1 992 1 3 16 2 1 3 78 9 1 3 14 7 SD 5 08 2 3 99 3 3 52 2 3 74 3 4 476 3 63 0 4 97 9 4 97 6 5 30 3 5 99 8 4 67 5 Me d ia n 9 62 5 6 68 5 7 51 1 7 81 8 7 924 8 14 5 9 60 8 1 1 195 1 1 82 9 1 3 07 1 1 2 80 6 Mi n 2 32 8 2 90 2 2 32 8 3 26 3 3 706 4 71 9 5 70 5 5 33 8 6 36 4 4 09 2 5 82 8 Ma x 2 9 59 3 1 9 66 6 1 9 12 6 1 9 06 0 2 0 905 2 0 01 2 2 4 03 6 2 3 773 2 9 59 3 2 6 77 0 2 3 20 0 Panel D Gro u p Ma nageme n t co mpensa tio n TS EK Me an 3 6 22 2 2 2 61 2 3 6 35 6 3 2 94 0 4 0 040 3 4 51 3 3 8 32 8 3 8 940 4 1 17 1 3 7 49 3 3 8 26 5 SD 19 96 5 4 87 9 8 23 9 1 1 52 3 2 6 596 1 9 99 6 2 2 32 2 2 2 554 2 6 95 4 1 8 75 5 1 8 89 3 Me d ia n 3 3 48 7 2 2 58 9 3 7 73 8 3 3 48 7 3 4 355 3 1 57 9 3 0 81 2 3 3 978 3 6 15 1 3 0 92 8 3 2 68 3 Mi n 6 18 8 8 76 0 9 34 7 6 18 8 8 040 7 34 7 8 18 1 8 89 8 8 24 5 9 52 2 1 1 00 0 Ma x 1 3 3 93 4 3 7 04 9 5 3 92 5 7 1 47 8 1 2 3 687 7 5 12 3 9 6 18 5 9 9 634 13 3 93 4 7 3 64 1 7 8 60 9 Panel E Boar d co m p ensatio n TS EK Me an 3 59 7 2 64 9 2 88 1 3 02 5 2 983 3 30 8 3 53 3 4 03 4 4 20 8 4 60 4 4 53 7 SD 1 94 8 1 56 6 1 72 0 1 69 5 1 702 1 65 8 1 55 7 1 81 7 1 93 1 2 40 4 2 23 5 Me d ia n 3 40 6 2 33 9 2 59 2 2 48 2 2 533 3 02 5 3 29 9 3 75 2 3 93 7 3 95 9 4 05 0 M in 4 39 43 9 6 11 59 6 5 8 4 7 3 8 9 4 3 1 04 5 1 48 0 1 44 9 1 70 0 Ma x 1 3 84 7 7 01 6 7 77 7 7 59 4 8 311 8 19 3 8 21 5 9 33 7 1 0 30 6 1 3 84 7 1 3 09 3
20
Table 2 Descriptive sta
tistics Th is tab le presen ts d ata fo r the v ariab les: Mark et t o Book Ratio ( M /B ), R et u rn On Eq ui ty (R OE ), C E O /Mana geme nt and C E O/ B o ar d of D ir ector s ov er th e samp le p er io d 199 9-2 008 . In Pan el A, w e calcu late M /B as th e sh ar e p ri ce d iv id ed by bo ok v alu e of eq u ity p er sh ar e. P an el B sh ows t h e R O E a n d i n Pa n el C pre sent s C E O C o m p en sat ion i n rel at ion t o t h e G rou p M anage ment . Pa nel D s h o w s C E O C o m p en sat ion i n relatio n t o th e Bo ard o f Directo rs. In Pan el C and D, l o w valu e sh all in terp re t as a h igh er co mp en sation in relation to the Group M an ag emen t an d Bo ar d of D ir ector s. 19 99 ‐2008 1 999 2000 2001 200 2 200 3 2 004 2005 20 06 2 007 2008 Pa nel A M/B Mean 3,0 5 4,66 3 ,02 2 ,7 7 1 ,9 0 2,3 3 2,54 2 ,69 3,65 4,74 2,30 SD 4,1 3 5,29 2 ,73 2 ,4 9 1 ,6 0 1,5 0 1,59 1 ,56 2,90 9,66 3,62 Med ian 2,0 7 2,35 2 ,18 1 ,8 4 1 ,4 6 1,8 2 2,00 2 ,38 2,98 2,33 1,28 Min 0 ,1 9 1 ,0 0 0 ,22 0 ,2 2 0 ,1 9 0 ,3 7 0 ,7 0 0 ,79 0 ,8 1 0 ,7 2 0 ,3 0 Max 5 4,6 0 21,70 11 ,76 1 1 ,42 8 ,2 8 7,2 7 8,05 8 ,08 15,35 54,60 20,16 Pa nel B ROE Me an 1 7 ,6 0 20, 49 20 ,50 9 ,8 6 6 ,8 6 12,6 1 17,47 20 ,55 24,38 25,25 18,12 SD 2 3 ,4 4 31,57 15 ,44 1 0 ,76 1 5 ,5 5 1 1,2 5 8,04 9 ,26 14,36 26,31 50,46 Med ian 1 7 ,0 0 17,10 17 ,00 1 0 ,79 9 ,6 5 1 2 ,5 5 15,85 19 ,80 21,75 20,65 15,95 Min ‐12 3,4 0 ‐88,82 ‐2, 3 0 ‐26 ,50 ‐37 ,5 0 ‐1 6 ,2 05 ,5 01 ,0 0 ‐11,30 ‐6,00 ‐123,40 Max 2 1 4 ,8 0 115,00 85 ,80 2 8 ,30 3 5 ,2 0 3 8,9 0 43,70 39 ,00 63,30 148,60 214,80 Pa nel C CEO/Group ma nag emen t Mean 0,3 6 0,34 0 ,25 0 ,2 8 0 ,3 0 0,3 3 0,39 0 ,39 0,42 0,46 0,41 SD 0,2 6 0,18 0 ,19 0 ,1 7 0 ,1 8 0,1 7 0,35 0 ,29 0,33 0,33 0,22 Med ian 0,3 0 0,30 0 ,20 0 ,2 3 0 ,2 7 0,2 9 0,34 0 ,37 0,34 0,37 0,40 Min 0 ,0 6 0 ,1 3 0 ,06 0 ,1 0 0 ,0 9 0 ,0 9 0 ,1 2 0 ,12 0 ,1 6 0 ,1 3 0 ,1 1 Max 2 ,1 0 0 ,8 7 1 ,06 0 ,7 8 0 ,8 7 0 ,8 4 2 ,1 0 1 ,76 1 ,9 4 1 ,6 4 1 ,1 5 Pa nel D CE O /Bo ar d Mean 3,5 2 3,41 3 ,36 3 ,2 7 3 ,7 0 3,3 5 3,93 3 ,51 3,60 3,55 3,48 SD 2,1 9 1,74 1 ,60 1 ,6 1 2 ,0 6 1,9 5 3,67 2 ,32 2,08 2,18 2,11 Med ian 3,0 6 3,01 2 ,99 2 ,8 2 3 ,2 0 2,7 6 3,08 2 ,95 3,15 3,04 3,22 Min 0 ,9 0 1 ,0 1 1 ,05 0 ,9 0 1 ,0 4 0 ,9 6 1 ,2 2 1 ,21 1 ,1 9 0 ,9 3 0 ,9 5 Max 2 1,3 6 7,93 7 ,33 7 ,4 1 9 ,0 0 9,7 5 21,36 13 ,27 10,79 10,79 8,53
21 Table 3 Descriptive statistics
In this table we classified the Companies into three groups: Finance, Industrial and Others. Classifications of groups are made according to Global Industry Classification Standard (GICS). In group Other we report those who not belong to the Finance and Industry Classification. The variables we report are the same as in Table 2: Market to Book ratio (M/B) in panel A, Return On Equity (ROE) in Panel B, Net Profit in Panel C, CEO/Group Management in Panel D and the CEO/Board of Directors in panel E.
Finance Industry Other Panel A M/B Mean 1,47 2,48 5,27 SD 0,67 1,41 6,78 Median 1,42 2,24 3,03 Min 0,19 0,30 1,09 Max 3,85 7,82 54,60 Panel B ROE Mean 13,90 16,96 21,88 SD 23,55 11,24 33,53 Median 16,05 15,75 18,32 Min ‐123,40 ‐16,20 ‐88,82 Max 85,80 57,70 214,80 Panel C Net profit Mean 7592 3898 3807 SD 11426 4612 7899 Median 7722 3144 1790 Min ‐36718 ‐4283 ‐22886 Max 46999 37680 27747 Panel D CEO/Group management Mean 0,31 0,34 0,44 SD 0,20 0,18 0,36 Median 0,24 0,30 0,35 Min 0,09 0,06 0,11 Max 0,87 1,25 2,10 Panel E CEO/Board Mean 2,33 3,68 4,38 SD 1,53 1,54 2,91 Median 1,89 3,30 3,61 Min 0,90 1,39 1,01 Max 8,71 9,00 21,36
22
Table 4 Correlation ma
trix
This table shows the correlation ma
trix for our sample between 1999 and
200
8.
Market to B
ook Ratio (M/
B
) is the share price relativ
e to boo
k
value of equit
y
per share. Market Cap is the stock pri
ce multip
lied by the number of shares outstanding at t
h
e end of the
year.
Return on Equity
(ROE) is net profit relative to equit
y
. Net profit is the
Net pr
ofit visible to shareholders. Gr
oup
Management Compensation is
the sum of salary
and bon
us ex
clusive the CEO compensation. Board c
o
mpensation is
fee to the Board work. C
E O/Group Management sh ow CEO salary in relation to the Group Management.
CEO/Board presents CEO
compensation in
relation to the Board of Directors. B
o
ard size shows the number
of
directors who are elected at th
e Annual
General Meeting (AGM).
1. 2. 3. 4. 5. 6. 7. 8. 9. 10. 1. M/ B 1 2.Market cap 0 ,2144 1 3. RO E 0 ,4906 0,0312 1 4. Net pr ofit ‐0 ,0247 0,4138 0,3821 1 5. CE O comp 0,0232 0,2350 0,0498 0,146 6 1 6. Group ma n. Comp ‐0 ,0767 0,2210 0,0170 0,246 7 0 ,4931 1 7. Board comp 0,0573 0,4914 0,0541 0,459 4 0 ,3751 0 ,4605 1 8. CE O /G roup man. 0,0451 ‐0,0777 ‐0,0513 ‐0,12 72 0,3035 ‐0,4845 ‐0,2015 1 9. CE O/Board 0 ,0096 ‐0,2370 ‐0,0502 ‐0,22 34 0,4091 ‐0,1005 ‐0,4888 0,6373 1 10. Board size ‐0 ,1155 0,3023 0,0001 0,313 1 0 ,1730 0 ,4310 0 ,6922 ‐0,3300 ‐0,5196 1 11. HS ‐i n dex 0 ,0923 0,0938 ‐0,0628 0,063 7 ‐0,1802 ‐0,1206 ‐0,0902 0,0590 0,1225 ‐0,1597
23 Table 5 OLS - regression results
This table shows estimated coefficients using Ordinary Least Square Regression models. The dependent variable is CEO Compensation expressed in logarithms. Independent variables are: Market to Book ratio (M/B), Net Profit, Return on Equity (ROE), Ln Market Capitalization, CEO/Board of Directors, Hartzell Starks index (HS-index) and Board size. See body text for definitions. In parentheses t-statistics are reported. *, ** and *** denote significance at the 10, 5 and 1 percent levels, respectively.
Ln CEO compensation 1 2 3 4 5 Intercept 14,5311*** 14,0217*** 15,1469*** 14,8598*** 12,8369*** (42,3264) (39,8672) (42,6919) (41,3792) (48,6898) M/B ‐0,0064 0,0084 0,0128* 0,0080 ‐0,0004 (‐0,8399) (1,1699) (1,6598) (1,0385) (‐0,0783) Net profit ‐0,2496 1,8266*** 1,4272*** 0,7526* 0,1478* (‐0,5951) (5,0102) (3,7385) (1,8426) (0,4995) ROE 0,1152 ‐0,1874 ‐0,2449 ‐0,0767 0,0350 (0,7490) (‐1,2775) (‐1,5505) (‐0,4811) (0,3246) Ln Market cap 0,1576*** 0,1988*** (6,8116) (10,6826) CEO / Board 0,0912*** 0,1624*** (7,778) (17,0300) HS‐index ‐0,8191*** ‐0,8085*** (‐4,4599) (‐6,4997) Board size 0,0593*** 0,0828*** (3,1351) (5,3428) R‐square 0,17 0,20 0,10 0,06 0,61
24 Table 6 OLS - regression results Industry
This table shows estimated coefficients using Ordinary Least Square Regression models, divided in groups according to Global Industry Classification Standards (GICS). In group Other we report those who not belong to Finance and Industry Classification. The dependent variable is CEO Compensation expressed in logarithms. Independent variables are: Market to Book ratio (M/B), Net Profit, Return on Equity (ROE), Ln Market Capitalization, CEO/Board of Directors, Hartzell Starks index (HS-index) and Board size. See body text for definitions. In parentheses t-statistics are reported. *, ** and *** denote significance at the 10, 5 and 1 percent levels, respectively.
Ln CEO compensation
Total Finance Industry Others
Intercept 12,8369*** 12,4266*** 11,1754*** 12,7834*** (48,6898) (‐36,4305) (18,0888) (24,9767) M/B ‐0,0004 ‐0,1567*** ‐0,0344 ‐0,0019 (‐0,0783) (‐3,6774) (‐1,5956) (‐0,3009) Net profit 0,1478* 1,0012** ‐0,4218 0,5570 (0,4995) (2,5561) (‐0,5402) (1,0792) ROE 0,0350 ‐0,4443** 0,5301* ‐0,0526 (0,3246) (‐2,5882) (1,8610) (‐0,3568) Ln Market cap 0,1988*** 0,2196*** 0,2007*** 0,1320*** (10,6826) (5,3034) (6,1296) (4,1559) CEO / Board 0,1624*** 0,2391*** 0,1707*** 0,1369*** (17,0300) (11,9010) (9,6629) (9,3460) HS‐index ‐0,8085*** ‐0,5969** ‐0,4952*** ‐0,8494*** (‐6,4997) (‐2,2120) (‐2,6766) (‐3,9488) Board size 0,0828*** 0,0499** 0,1725*** 0,1712*** (5,3428) (2,3842) (6,7838) (4,1175)
25
References
Aktiebolagslagen (SFS 2005:551). Stockholm: Justitiedepartementet.
Belliveau, M, A., O’Reilly, C, A., Wade, J, B. 1996. Social capital at the top: Effects of social similarity and status on CEO compensation. Academy of Management Journal 39, 1568–1593.
Brickley J.A., Coles J. L., Jarrell G., 1997 Leadership structure: Separating the CEO and chairman of the board, Journal of Corporate Finance 3 189–220.
Bryman A., Bell E. 2007. Business Research Methods revised edition, Oxford University Press.
Boyd B. K., 1994. Board Control and CEO Compensation, Strategic Management Journal 15, 335-344.
Chhaochharia, V., Grinstein, Y., 2009. CEO Compensation and Board Structure, Journal of Finance 64.
Core, J, E., Holthausen, R,W., Larcker, D, F., 1999. Corporate governance, chief executive officer compensation and firm performance, Journal of Financial Economics 51, 371-406.
Croci, E., Gonenc, H., Ozkan, N., 2010. CEO Compensation, Family Control, and Institutional Investors in Central Europe, Working paper.
Daily, C, M., Johnson, J,L., Ellstrand, A, E., Dalton, D, R., 1998. Compensation Committee Composition as a Determinant of CEO Compensation, Academy of Management journal 41, 209-220.
Finkelstein, S., Boyd, B. 1998. How Much Does The CEO Matter? The Role of Managerial Discretion in the Settings of CEO Compensation, Academy of Management Journal 41, 179-199.
Gomez-Mejia L. R., Larraza-Klintana M., Makri M., 2003. The Determinants of Executive Compensation in Family-Controlled Public Corporations, The Acdemy of Management Journal 46, 226-237
Hambrick D.C., Finkelstein S., 1995. The Effects of Ownership Structure on
Conditions at the Top: The Case of CEO Pay Raises, Strategic Management Journal 16, 175 - 193.
Hartzell, J. C., Starks, L. T., 2003. Institutional Investors and Executive Compensation, Journal of Finance 58, 2351-2374.
Hirschey, M., Nofsinger, J., 2008. Investments: Analysis and Behavior, McGraw-Hill Irwin, 281.
26
Jensen M. C., 1993. The modern industrial revolution, exit, and the failure of internal control systems, Journal of Finance 48, 831-880.
Jensen M.C., Meckling W., 1976. Theory of the firm: Managerial behavior, agency costs and ownership structure, Journal of Financial Economics 3, 305–360
Jensen M.C., Murphy K.J., 1990. Performance pay and top-management incentives, Journal of political Economy 98, 225–264
Kerr J., Bettis R. A., 1987. Top Management Compensation, and Shareholder Returns, Academy of Management Journal 30, 645-664.
Lucier C, Schuyt R and Handa J, 2004. The Perils of “Good” Governance, Strategy and business, issue 34
MacKinlay, C. A., 1997. Events studies in economics and finance, Journal of Eco-nomic
Literature 35, 13-39.
Malhotra N. K., Birks D. F. 2007. Marketing research An applied approach. Prentice Hall
Nielsen S., Huse M., 2010. The Contribution of Women on Boards of Directors: Going beyond the Surface, Corporate Governance: An International Review, March 2010.
The Swedish Corporate Governance Board, 2010, The aim of the Code, (Available at Internet 2010-04-06). http://www.corporategovernanceboard.se/the-code/aim-of-the-code
Tosi, H,L., Werner, S., Katz, J, P., Gomez-Mejia, L, R. 2000. How Much Does Performance Matter? A Meta-Analysis of CEO Pay Studies, Journal of Management 26, 301-339.
Singh M, Davidson III W. N., 2001. Agency costs, ownership structure and corporate governance mechanisms, Journal of Banking & Finance 27, 793-816
Yermack D., 1996. Higher market valuation of companies with a small board of directors, Journal of Financial Economics 40, 185-211.