Do Stock Prices Conform to an Absolute Price Level?*
David A. Burnie** Haworth College of Business Western Michigan University
Kalamazoo, MI USA e-mail: david.burnie@wmich.edu Adri De Ridder Gotland University SE-621 67 Visby Sweden e-mail: adri.deridder@hgo.se
(This version: October, 2012)
Abstract
We examine nominal and real stock prices and the sequential price pattern of stock dividends, stock splits and Initial Public Offerings (IPOs). Using data for all firms listed in Sweden over the one hundred and twelve year period 1900-2011, we show that the average stock price has been fairly stable over time except for two decades in the beginning and end of the 20th century. Inclusion of these periods yield a decline over time which is generally consistent with the drop in price levels found by Chittenden et al. (2010). In a multivariate setting, the frequency of stock dividends, stock splits and IPOs are positively related to the frequency for these events the prior
year and recent market return. In further tests of the price change we find a positive relationship
between the price difference to the median price for stock splits and stock dividends and a positive relationship to the market return for stock splits. We conclude that the primary reason for an action such as a stock split, is to fit the “norm” price of the market.
* We would like to thank the discussants Mike Staunton at the 2010 EurHISTOCK Conference (Cambridge), Omid Sabbaghi at the 2011 EFA Conference (Savannah) and seminar participants for their many helpful comments. We also thank Mikael Segerlund for his excellent research assistance. Financial support from the Swedish Securities Dealers Association is gratefully acknowledged. The usual disclaimer applies.
1
Do Stock Prices Conform to an Absolute Price Level?
Abstract
We examine nominal and real stock prices and the sequential price pattern of stock dividends, stock splits and Initial Public Offerings (IPOs). Using data for all firms listed in Sweden over the one hundred and twelve year period 1900-2011, we show that the average stock price has been fairly stable over time except for two decades in the beginning and end of the 20th century. Inclusion of these periods yield a decline over time which is generally consistent with the drop in price levels found by Chittenden et al. (2010). In a multivariate setting, the frequency of stock dividends, stock splits and IPOs are positively related to the frequency for these events the prior year and recent market return. In further tests of the price change we find a positive relationship between the price difference to the median price for stock splits and stock dividends and a positive relationship to the market return for stock splits. We conclude that the primary reason for an action such as a stock split, is to fit the “norm” price of the market.
2
1. Introduction
One important question in financial economics is if absolute stock price levels affect stock return and stock ownership. Despite several empirically oriented studies there are still many issues which are not yet fully understood when the focus is on the price level. For instance, Fernando, Krishnamurti and Spindt (2007) examine the offer price in an initial public offering (IPO) and report a U-shaped relationship between offer price and underpricing. They also document that low (high) priced IPOs underperform more (less) in the 3-year period following the IPO. Thus, the absolute price level seems to have an impact on firm valuation despite that financial theory suggests the price level as being irrelevant.
Firms occasionally undertake actions by executing stock dividends, stock splits and reverse stock splits to manage their firm’s nominal stock price into an absolute preferred price level. Although financial theory predicts, given frictionless and efficient markets, that nominal stock
prices are irrelevant, several papers emphasize that price levels matter.1 Why do firms use
stock splits to move their share price to a trading range which is associated with higher transaction costs and should it affect ownership structure? In theory, a stock split is just an accounting change; the split will reduce the price while, at the same time, the number of outstanding shares will increase proportionally, and should therefore not affect firm value. As stock splits are a common corporate event, there must be some benefits associated with the split. As argued by Black (1986), a lower stock price will attract more noise traders and thus increase volatility. Lower stock price levels will also attract retail investors as they tend to be wealth constrained and cannot afford to buy a round lot of a firm’s stock if the price is too high.2 Brennan and Hughes (1991) argue that the negative relation between brokerage commissions and price level provides an incentive for stock brokers to produce more information about low-priced stocks. Angel (1997) studied the relationship between stock price and tick size and develops a model where lower prices and higher relative tick size provide an incentive for stock brokerage firms to promote the stock. Lipson and Mortal (2006) find that market adjusted returns in the
1 The evidence of abnormal returns surrounding the announcement of stock splits in prior literature has been explained by the trading range hypothesis (Copeland, 1979) and the signalling hypothesis (Brennan and Copeland, 1988).
2 This can be illustrated by detailed data from Ericsson, one of the largest firms listed on the Stockholm Stock Exchange. As of the end of December 1999, the firm’s stock price was 559 Swedish kronor (SEK). Three years later, following the “IT-bubble”, the stock price was down to SEK 6.23. Over the same period, the total number of individual shareholders increased by 213%, domestic institutional investors by 157%, and foreign institutional investors by 132%. If this change in share holdings in Ericsson is relevant, stock price levels seem to matter. In February 2008, Ericsson announced a reverse stock split with the ratio 1:5, in other words, five old shares were to be replaced by one new share.
3
month and year before a split are large and that stock splits are unrelated to relative tick size as well that post-split prices have not declined over time. In short, even if prior studies report mixed results, corporate managers seem to care about the price level and use a broad set of tools to get the stock price into an optimal trading range and thereby attract investors, see Baker and Gallagher (1980).
In this paper, we cast new light related to the absolute price level of stocks and we argue that corporate managers in Sweden are concerned about the price level. An examination of Swedish stock price levels is important at least for three reasons. First, in the late 1970s, the Swedish trade unions together with the Social Democratic Party tried to introduce a scheme with wage-earnings funds (“löntagarfonder”) which would have resulted in a gradual take-over of the Swedish corporate sector. Second, in response to the threat, many firms introduced programs that employees should be shareholders in these firms. Essentially, an early version of an employee share ownership plan (ESOP) or early mutual fund was set up which invested, primarily, in the firm’s stocks. These saving schemes were also followed by specific tax-benefits introduced by the new bourgeois government in the end of the 1970s. Thus, one important issue related to stock ownership was the efforts from the government to improve insights and knowledge from the financial markets to individuals. Third, stock ownership in Swedish companies listed on the Stockholm Stock Exchange (SSE) is characterized by a high degree of institutional holdings. Hence, wealth constraints should not be a valid argument to get the stock price into a specific price-level.
To further extend the literature related to stock price levels, we investigate nominal and real stock prices for all stocks listed on the SSE in Sweden during the period 1900-2011. In addition, we also examine the frequency of corporate events (stock dividends, stock splits, reverse stock splits and IPOs), in other words, we raise the question whether there is a difference in price, and the size of the price difference in firms. The main departure of our paper from most of the existing literature is our data set which covers a long time period. Over our sample period we examine almost 15,000 stock prices. We believe that improved insights into what is called the nominal share price puzzle or any attempt to maintain a near constant or absolute price are important for several reasons.
First, the nominal share price level will attract different kind of investors, as noted in the above literature a low price will primarily attract retail investors. While institutional investor ownership has increased over time they have fiduciary responsibilities causing them to avoid investments in some firms. As expensive stocks are associated with large capitalization firms, it
4
is reasonable to expect that institutional investors have incentives to invest in these firms. Further, institutional investors must comply with their charter and investment guidelines which can prohibit them from investing in stocks with low, absolute nominal stock prices (“penny stocks”). Second, a stock split can affect trading activities in the stock. Moreover, the propensity to attain an optimal share price level by a stock split can be due to the overall market conditions and the general view of a “reasonable/affordable” or “norm (al)” stock price whereas a high stock price can be associated with being an overvalued stock.
We find that both nominal and real stock prices have declined over the one hundred and twelve-year period 1900-2011 with long periods of relatively consistent prices. The large drop in prices from 1900 to 1920 is partially due to the World War I embargo and postwar weakness in
Europe accompanied by high levels of inflation.3 The decades between 1920 and 1990 reflect a
more stable price level close to the overall average of SEK 316 for the 1900 to 2011. These results are consistent with Chittenden, Payne and Toles (2010), who show declines in the decade means and an overall average of $23.22. For our sample period 1900 to 1955 the mean (median) equally weighted nominal stock price is SEK 609 (200) which falls to SEK 174 (120) for the time period 1956 to 2011. The largest decline in mean nominal stock price took place between the 1980s and the 1990s with a price drop by 55.8%. Firms associated with stock splits have a lower standard deviation in stock prices compared to firms without stocks splits or stock dividends. We also find that the nominal and real stock price levels increase with the age (defined as number of years listed) of the firm.
Our multivariate analysis assesses the frequency of stock dividends, stock splits and an IPO in a calendar year with its frequency the prior year and the prior 2-year real stock market return as control variables. These tests show that the prior year’s frequency is positively and statistically significantly related to the frequency of the current year and the prior 2-year market return. We find that there is a greater propensity for a stock dividends, a stock split or an IPO when market returns are higher. In further tests of the price change pre to post split/dividend we find a positive relationship between the price difference to the median price for stock splits and stock dividends and a positive relationship to the 2-year market return for stock splits.
Overall, our results suggest that the primary reason for an action such as a stock split, is “to make the stock fit the market or norm price”. The to-split decision is influenced by age of the firm, recent corporate events and the overall market performance.
3 Inflation was particularly high in Sweden in the years 1917 and 1918 with values of 26.2% and 47% respectively. Over the period 1900-1920, mean annual inflation was 5.6%.
5
The rest of the paper is organized as follows. In the subsequent section, we summarize prior studies. Section 3 describes the sample and data used in this study. In Section 4 we present our results. Section 5 concludes the paper.
2. Related studies and incentives to invest in stocks
The behaviour of the total value of stocks and their price over time has been accepted as an upward trending process. Ibbotson and Sinquefield present charts and tables of this general pattern in Stocks, Bonds, Bills and Inflation (1979) which has since been updated annually by Ibbotson Associates. The increasing price levels have also been accompanied by increasing volatility across the US markets from the 1950’s to 1998 as noted by Xu and Malkiel (2003). This volatility is consistent with the increase in cross-sectional variation found by McEnally and Todd (1992) from the 1950’s to the 1980’s. Weld, Michaely, Thaler and Benartzi (2009), in contrast, suggest that the cross-sectional variability in share prices did not exhibit any trend. Stock market movements and returns are also surprising similar in many countries over long time periods. Acheson, Hickson, Turner and Ye (2009) show that the British stock market behaved much like the US market pattern from 1825 to 1870; they also report that the relative importance of return components (i.e. capital gain and dividend yields) of each market changed over the period. Some studies have alternatively indicated that changing fundamentals and market characteristics are more supportive of price levels and valuation or that the market environment in the US has been more stable (Shen, 2000 and Renshaw, 1995).
Chittenden et al. (2010) note that the cost of trading in the US markets has decreased considerably over time with the dropping of fixed commissions in 1975, flat-fee trading in the 1990s and the decimalization of stock trading in 2000. In Sweden the cost of trading has changed over time in a similar pattern. Further, as one element in its policy to stimulate private savings in stocks, the government passed a law in 1978 giving individuals’ special benefits for their savings. In essence, two parts constituted the saving schemes: (a) a special tax reduction
(20% of the savings), and (b) tax-exempted dividends and capital gains. To qualify for these
benefits an individual had to save on a regular basis in a plan over at least six months in a year. In addition, savings were locked in for a period of 5 years. Finally, the maximum saving per month was SEK 400. On January 1, 1981, new rules were put into practice, providing: (a) special tax-reduction increase from 20 to 30% of the amount saved, (b) the maximum savings per month was increased from SEK 400 to 600, and (c) the possibility for firms to start funds for the investment of the money in just one stock – the companies’ own. Further, membership in these corporate
6
schemes or funds was restricted to employees of the company as the firms also provided loans to finance the saving. Two different funds were introduced. The first one limited savings in the company’s own stock to a maximum of 25% of total assets. The second one did not use asset diversification as the fund invested in only the firms’ own shares. In March 1981, 13 companies had started a fund and a year later, almost 60 companies had introduced the saving schemes. The majority of these firms, 87%, had a fund where the assets were invested only in the firm’s own
stock. Approximately 60,000 employees participated in these saving schemes.4 More recently,
Swedish individuals have also become increasingly active in financial markets and particularly in the new pension scheme “Premiepension” where individuals can chose to invest in mutual funds with different net-asset-values (NAV). Taken together, we have reason to believe that retail investors have changed their appetite for financial products and stocks in general following the introduction of these saving schemes and also the shift in the pension schemes from defined benefits to defined contributions.
Empirical evidence indicates that the nominal price of common stocks in the U.S. has remained constant at around $35 per share (on a value weighted basis or $25 equal weighted) since the Great Depression; see Weld et al. (2009). Stock price levels have also been examined by Dyl and Elliott (2006) who report that stock price levels vary across firms but also depend on the exchange where the share is listed. As evidence that stock price level is important, or seems to matter, NASDAQ introduced a new listing agreement with a minimum bid price standard of $1 per share in August 1991 and thereby forced many firms to undertake a reverse stock split to avoid delisting.
Recent studies by Chittenden et al. (2010) find that average stock price on the NYSE and AMEX is lower today than in the 1920s. They find that splitting activity is positively related to both real and nominal two year index returns, real personal savings and the small stock premium. The results indicate that the perception of an optimal trading range has declined in real terms and thus is not an operational objective for stocks to be split to. The Chittenden et al. (2010) and Weld et al. (2009) results are not much different when looking at the same time periods of equal-weighted prices and considering the Chittenden uses winsorized data and Weld does not. The inter-decade change in mean price is roughly of the same size and move in the same direction. Baker et al. (2008) find similar results but focus on a catering hypothesis in nominal prices where their results support the hypothesis that managers will use a split as a tool to categorize their firm
7
as a small capitalization firm when investors place a greater relative financial value on small compared to large firms.
3. Data and summary statistics
3.1. The sample
The data on all firms, name and stock price, listed in Sweden as of the end of each calendar year during the 1900 to 2011 period are hand-collected from several sources. For the period 1900 to 1903 we use information on stock prices published on behalf of Stockholms Handelsbank in the daily newspaper Svenska Dagbladet. For the time period 1904 to 1908 we use the price quotation bulletin published by the stock broker firm Arthur Mattsson and collected by hand from hardcopy and microfiche files in the National Library of Sweden (Kungliga Biblioteket, KB).
Exhibit 1 Illustration of Stock Price Bulletin from the Stockholm Stock Exchange, December 1911.
8
From 1909 and until 2011, we assemble and use the information published in the official price bulletin list by the SSE and from specific market segments. The quality of the price information varies over the sample period. As shown in Exhibit 1, an excerpt from the 1911 price bulletins, difficulties were faced in extracting the appropriate stock prices for some of these early periods. In general, we have information of bid offers and ask offers for all sample firms. As the focus in this paper is on the stock price level, where we use annual data, we collect the price data as of the end of December for each calendar year. From our sources, the closing price (or the end bid offer) for each stock is used to compile our data set. In some cases the stock was not traded on the last trading day in December and in these cases we move to the last trade of the year to identify the bid-offer price.
We collect data on capital changes, i.e., stock dividends, stock splits and reverse stock splits from memos issued by the stock broker firm Arthur Mattsson for the period 1900 to 1908. From 1909 and up to 2011 we use several sources to crosscheck our data on capital changes, information assembled annually by the Swedish Securities Dealers Association (“Svenska
9
fondhandlareföreningen”), the Swedish tax agency (“Skatteverket”), Pokorny (1958a, 1958b, 1961) and Möller (1961). In addition, we use Dinkelspiel (1966) to identify stock splits and stock
dividends in our sample firms. Further, the book published in relation to the 100th anniversary of
the SSE (“Stockholms fondbörs 100 år”, 1963), Ramklint (1966) and Carlsson (1978) as well as various issues of the dictionary “Svenska Aktiebolag”, are used to crosscheck data on capital changes. From 2002 to 2011 we obtained data on capital changes electronically from the SSE and the Swedish tax agency.
In our analysis, we report stock price levels in nominal as well as in real prices. We adjust stock prices for inflation where we use the consumer price index (CPI) as a proxy for inflation. Data for the CPI-index has been obtained from Statistics Sweden and we adjust all nominal stock prices into real prices by multiplying the nominal price for the year by the ratio of the CPI-index as of the end of 2011 and the CPI-index at the base year. For instance, as of the end of 1900, the stock price in the steel firm Sandviken was SEK 4,000. To express this price level in constant 2011 SEK price level, we multiply the price with the ratio of the index 2011 with the CPI-index 1900 and obtain the price of SEK 211,628.
3.2. Sample characteristics
The total number of price observations for all firms over the 1900-2011 time period is 14,880. The mean (median) number of price observations for each calendar year is 125 (122). The minimum number of observations is 20 and represents the calendar year 1900. The maximum number of observations is 291 and represents the calendar year 1999.
This study examines stock price levels over a long sample period, 112 years. Our primary question of interest is the intensity of stock price adjustments in conjunction with the movement of the nominal and the real stock price level. As previously mentioned, our approach to investigate nominal and real stock price levels is straightforward. The first step in our analysis is to sort all firms into two groups; firms which changed their nominal price level by a stock dividend, stock split or a reverse stock split during the year and firms which did not undertake
any actions. In our data set, we have a total of 1,570 corporate events.5 The largest group is stock
dividends (1,166) followed by stock splits (381). Reverse stock splits are a relatively recent innovation on the SSE and we have only 23 events in our sample. As the numbers of reverse stock splits are low and concentrated to the last years we exclude these events in our analysis.
5 In the case that a firm have a combination of stock dividends and stock splits we use only one event and use the one with the highest factor.
10
Figure 1 shows the time series of corporate events over the sample period 1900 to 2011 and for each decade (our last graph show the period 2000-11). As clearly shown, the frequency of stock dividends have declined whereas that the frequency of stock splits has increased.
The most expensive stock in our sample is represented by the firm Rörstrand AB with a stock price of SEK 29,300 as of the end of 1907. In 2011 price level, this corresponds to a stock
price of SEK 1,514,611.6
4. Results
4.1. Mean Prices Overall and by Decade
Table 1 summarizes the price data of our sample firms over the time period 1900-2011 representing a total of 14,880 firm observations. Panel A reports the means, medians, standard deviations, minimum and maximum stock price levels in nominal and real terms (expressed in 2011 price level) for our full sample period and also for several sub-periods. The mean and median nominal stock prices for the full sample period are SEK 316 and 140 respectively and indicate a skewed distribution. The minimum nominal stock price (SEK 0.06) is located in the 2000-11 period whereas the maximum nominal stock price (SEK 29,300) is located in the first period 1900-09. The data also shows that stock price levels, on average, have declined over time and is valid using either nominal or real price levels. For the first (second) half of our full sample period, mean nominal stock price is SEK 609 (174) which corresponds to a drop by 71.4 percent (excluding 1900-1919 the mean nominal stock price of 1920 -1989 is SEK 284). Measuring stock prices in real prices, the drop is even more (95.5 percent).
Panel B reports the descriptive statistics for firms with stock dividends. Over the full sample period, representing a total of 9,273 firm years, the mean (median) stock price in nominal value is SEK 339 (17). Analysis of the first and second half of our sample period also shows a decline in the average nominal stock price, from SEK 551 to 217 respectively and corresponds to a drop by 60.6 percent.
In Panel C, we report descriptive statistics for firms with stock splits. For our full sample period, the mean (median) stock prices in nominal values are SEK 118 (86). Interestingly, mean
6 In comparison to some international firms, Swedish firms seem to manage the nominal share price. On May 8, 2009, the price of a stock in the US-firm Berkshire Hathaway was $94,482 and $25,207 for a stock in the French firm Banque Privee Edmond Rothschild. The boards of these two firms appear not to have bothered to manage the firm’s nominal share price. Interestingly, the opposite holds for the Swedish retail firm Hennes & Mauritz which reported, after several stock splits and stock dividends since its flotation in 1974, a closing price on the same date of SEK 376.50 or $48.05. If no stock price management actions had been taken, the price of the stock should have been SEK 1,245,000 or $158,902.
11
nominal stock price increased moderately from the first to the second half of our full sample period whereas the mean real stock price declined. In the last column of Panel C we see that the frequency of stock splits has increased substantially for our full sample period and also that the increase is located in the post 1950-period with approximately 96% of the 1,459 observations in the period 1956-2011.
Panel D reports descriptive statistics for firms with a reverse stock split where the first one occurred in 1995. Mean (median) nominal stock price for over the time period 1995-2011 is SEK 30.64 (9.85).
Finally, Panel E reports the descriptive statistics for firms without any capital changes
(inclusive of firmswith a limited number of years listed on the SSE). As reported, mean (median)
nominal stock price for the overall sample period is SEK 343 (86). Overall, Table 1 shows that
the average price of a stock listed on the SSE, irrespective of whetherwe measure it in nominal
or real terms, has declined over the sample period. In particular, we find that the mean stock price is lower in the 1956-2011 compared to the 1900-1955 time period. These results are consistent with our conjecture that lower absolute stock price levels attract retail investors and in particular
for employees in firms with various stock savings schemes.7
The pronounced price declines at the beginning and end of the century persist in all panels of Table 1. In Panel B there are 7 decades of significant mean price decline and 2 of significant increase (unreported), in Panel C there are 5 decades of significant decline and 2 of significant increase while in Panel E there are 4 decades of significant decline and one of significant increase. These within panel changes appear to indicate that stock split and stock dividend action lead to greater declines in prices. Panel B, the stock split group, has 4 decades of significant price declines versus the no capital change group (Panel E), while the no capital change group has 5 decades of significant price decline versus the stock split group. In tests comparing Panel C with E, the stock dividend group (Panel C) has 3 decades of significant price decline while the no capital change group (Panel E) has 5 significant declines. Overall, the results suggest that prices are declining for all groups and action by management in terms of stock splits or dividends may only be keeping in step with the market price changes.
4.2. Price Frequency Distributions
7
We also examined the nominal mean stock price for firms with and without the employee share savings schemes. As of 1981, mean stock price for 55 firms with these schemes was SEK 165. Mean stock price for 75 firms without schemes was SEK 230. The mean difference is also statistical significant at the 5% level using a t-test (p-value = 0.041), thus we conclude that firms with schemes have an absolute stock price level which is lower than other firms.
12
We further compare the distribution of stock prices by a closer examination of the price levels where we use two different approaches. First, we examine in detail the distribution of the nominal stocks prices. We do this by sorting our price data into eleven price intervals, beginning with a stock price up to SEK 20 and ending with a price interval for stocks with a price of SEK 200 or above.
Figure 2 presents the distribution of nominal stock prices for all firms for three different time periods, 1900-1955 (Panel A), 1956-2011 (Panel B), and 1900-2011 (Panel C). The frequency of lower price stocks has increased substantially over our sample period. As clearly shown in Panel C of Figure 2, we see that the number of stocks with a price up to SEK 20 is close to 9% of all stocks (rising from around 2% in Panel A to 12% in Panel B). In addition, expensive stocks, stocks with a nominal price in excess of SEK 200 are also close to 33% of all stocks (falling from 49% in Panel A to 26% in Panel B).
Second, we rank stock prices for each calendar year and form equally weighted price quartiles where quartile 1 contain firms with the 25% lowest stock prices and quartile 4 contain firms with the 25% highest stock prices. We do this for all calendar years and compute the mean across the first and fourth quartile. We denote quartile 1 as inexpensive stocks and quartile 4 as expensive stocks. Figure 3 shows the outcome of this analysis. The mean (median) stock price is SEK 51.52 (46.82) for the group denoted as inexpensive stocks and SEK 1,937 (1,090) for stocks classified as expensive stocks (not reported).
In Panel A of Figure 3, we see that the first major decline for inexpensive stocks occurs in the 1908-22 period. The large drop in prices from 1900 to 1920 is due to the World War I embargo and postwar weakness in Europe. For expensive stocks, as reported in Panel B of Figure 3, we see a similar pattern. We attribute the severe price decline in 1909 to the blue collar general strike. From the 1960s and onwards, and irrespective if we analyze inexpensive or expensive stocks, we note a downward price trend.
Further, we compute the ratio between mean price in the group with expensive stocks and the mean price in the group with inexpensive stocks. As reported in Panel C of Figure 3, we find that the relative price level between expensive and inexpensive stock has declined over time even if we see a rebound towards the end of the sample period. For instance, the relative price level between the two groups was 50 times in the time period 1900-55 and 39 times in the time period 1956-2011. However, our data also indicate that the relative difference between the two groups has increased during the last 10-year period with a mean stock price for inexpensive (expensive) stocks of SEK 2.46 (266.80) which corresponds to a price difference of 108 times. This pattern is
13
also evident in the ratio of mean/median prices over time in Figure 4. The trend is down from about 2.5 (1910 – 1920) to 1.5 (2000 - 2010) indicating both mean and median falling values with the mean exhibiting a faster rate of decline. One plausible explanation for this finding is that the number of small capitalization firms, in general associated with low stock price levels, has increased. In sum, our evidence of declining nominal stock prices is consistent with the results in Dyl and Elliot (2006) and Chittenden et al. (2010). Our results are equally somewhat consistent with the price levels of Chittenden et al. and Weld et al. on a same time window basis. The results presented here are highly impacted by the two decades at the beginning and at the end of the sample period. The book-end decades exhibit a large increase in firms years of 50.8% (923) and 18.3% (502) respectively with subsequent mean price changes of -60% and -30% providing strong evidence that the majority of new firms brought to market during this period were lower price firms.
4.3. Firm Age and Prices
Thus far we have focused on the nominal stock prices for firms with stock splits and stock dividends. In this section, we compare stock prices in an attempt to detect any significant differences with respect to the age of the firm. As price data for several firms only occur for a limited number of years, particularly in the beginning of our sample period, we use only firms where we have at least five consecutive prices. We define a “young” firm as a firm which has been listed for a maximum of 15 years. Firms which have been listed for a period of at least 16 years are classified as “older” firms.
The results presented in Table 2 show that younger firms have a statistically significant
lower nominal stock price than older firms and also for all periods reported.8 This is valid if we
use the mean or the median stock price level. For instance, over the full sample period 1900 to 2011, mean nominal stock price for old (young) firms is SEK 611.16 (195.72) and the difference is also highly statistically significant. Specifically, the price differentials between old and young firms vary from 1.7 to 3.1 times (time periods 1956-2011 and 1900-2011 respectively). Consistent with the results presented in Table 1, evidence of declining nominal stock prices is apparent.
In Figure 5, we show the age distribution of firms. As shown, several firms went public in the late 1990s and the number of firms with an age between 10-15 years is 90 which is 43.7% of
8 To conserve space we only report the results using nominal stock prices. Using real stock prices do not change our findings.
14
all sample firms. We also show the cumulative percentage of firms for our sample (right-hand scale in the figure) and the age; this line indicates that more than half of our firms (61.7%) have been listed for a period of less than 15 years. Taken together, these results suggest that the composition of firms is tilted towards younger firms with low stock price levels whereas older firms are associated with higher stock prices.
4.4 IPOs
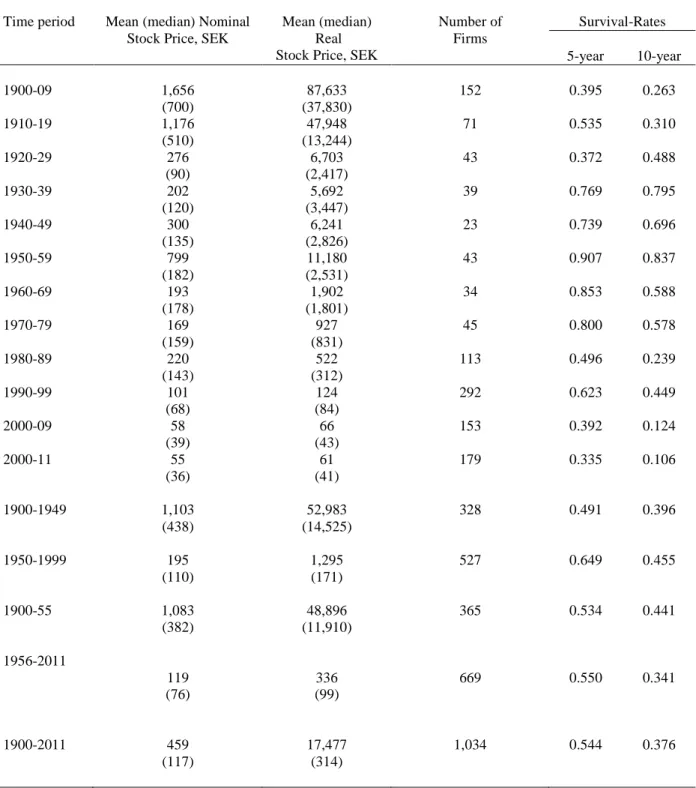
We also examine IPOs over the sample period 1900 to 2011 where we have identified a total of 1,034 IPOs. Of these firms roughly 1/3 were floated in the first half of our sample period and 2/3 were floated in the second half. The results in Table 3 indicate that mean stock price, both in nominal and real terms, has decreased over time for IPO firms. For instance, the mean (median) nominal stock price for IPOs in the period 1900-09 was SEK 1,656 (700) but only SEK 58 (39) in the period 2000-09 and represents a drop in the mean value by almost 97%. A closer examination of the stock price also shows that the median stock price, in nominal value, fell by approximately 80% in the second 55-year period compared to our first 55-year period.
The lowest number of IPOs occurred in and around the Second World-War period of 1940-49 when only 23 firms went for a listing. In contrast, the period with most IPOs was the 1990-99 period with the advent of the over-the-counter-market (OTC) and specific market segments and 292 firms were listed. The number of IPOs as well as the nominal stock price varies across the calendar years. For instance, in 1999 we have (not reported) 39 sample firms with a mean (median) nominal stock price of SEK 213 (149) and even if the number of IPOs is roughly the same the following year the mean (median) nominal stock price declined to SEK 75 (42).
The last two columns of Table 3 report the survival rates for our sample firms. We report the survival rate by decade, defined as the fraction of IPOs which are still listed after 5 and 10-years. We also report the survival rate for the first and second half of the sample period and for the full sample period. As reported, we see that the 5-year survival rate as well as the 10-year survival rate has declined over the sample period. For instance, for IPO firms in the first (second) half of our sample period, 53.4% (55%) were still listed after 5 years. If we extend the survival rate to a 10-year window, we see a much stronger decline in the survival rate; for firms which went public in the first (second) half of the sample period 44.1% (34.1%) of the companies were still listed.
Table 3 provides evidence that recent IPOs are associated with low nominal stock prices to facilitate ownership to retail investors and also to employees. For all IPO firms we find that the
15
mean price has declined over time. This is valid whether we measure price in nominal or real terms.
We attribute the findings of a lower stock price level to the general increase in the number of individual shareholders which took place in the early 1980s and conjecture that firms going public had to set an “affordable” price level to attract individual investors. The expansion of electronic trading and transaction record keeping has improved access for individual investors and not (appreciably) increased costs for large investors who may invest the same large monetary amounts for a greater number of shares as prices have decreased over time. In addition, the general public interest in stock market investments may have contributed to IPO firms setting
their offer price into the ‘affordable, reasonable or marketnorm’ range.
We also conclude from Table 3 that the survival rate for firms which went public over the full sample period has declined and only 38% of all IPOs survive beyond their 10-year anniversary as a public company. Survival rates are low for firms which went public in the 2000s, only 39.2% were still listed after 5 years and just 12.4% were still on the SSE after 10 years. We attribute some increased activity to private equity firms which acquired substantial parts of the IPO firms during depressed market conditions, in particular those listed on the OTC-market.
4.5. Further tests of the price decline
An interesting characteristic of analyzing absolute stock price levels over a long time-period is the apparent pattern of lower price levels as previously reported. However, such entrenchment seems difficult to understand given that institutional shareholders today are the main investors on the SSE. In this section, we provide one additional test related to stock price levels. Specifically, for each calendar year, starting 1901, we rank all firms based on the price level. We then form deciles, thus our first (tenth) decile contain inexpensive (expensive) stocks. Finally, we compute the fraction of firms which are still in the same decile after 1 and 3 years.
Figure 6 shows the outcome of this analysis. Panel A reports the outcome for inexpensive stocks and Panel B shows the results for expensive stocks. Across all sample years the mean number of companies in the deciles is 14.
Panel A of Figure 6 shows that the percentage of companies which still belong to the first decile (inexpensive stocks) and represented by the solid line, the consecutive year is 7.7%. After 3 years, just 4.1% remain in the same decile. The horizontal lines show the mean for the sub-periods 1901-55 and 1956-2011. As shown, the drop is larger when we measure the fraction of
16
firms still in the same decile after 3 years; companies still in the same decile after 1-year fall from 8.3% to 7.2% for versus from 5.3% to 2.9% after 3-years.
Panel B of Figure 6 shows the results but for stocks classified as expensive stocks. The horizontal lines, reflecting the mean value of firms still in the same decile after 1 and 3 years, suggest a larger drop compared to inexpensive stocks. The drop between the two sub-periods is from 8.3% to 5.6% and 6.3% and 2.8% for firms still in the same decile after 1 and 3 years. Thus, this suggests that companies with expensive stocks tend to move more compared to inexpensive stocks.
4.6. Price Adjustment Relationships
To further explore nominal stock prices and the correlation to the number of prior year events ((a) stock dividends, (b) stock splits and (c) IPOs) and the prior market return, we employ an ordinary-least square regression model. In our analysis we use the natural logarithm of 1 + the frequency of corporate events as the dependent variable in a calendar year. Our first independent variable is the natural logarithm of 1 + the frequency of the corporate event the prior year. The second independent variable is the real overall return on the market over the prior 2 years
(geometric compounded). The model follows the basic structure of Chittenden et al. (2010).9
Thus, we run the following time-series regressions to estimate the sensitivity of prior events:
Ln(1+StockDividend/Split or IPO)t = α + β1 Ln(1+StockDividend/Split or IPO)t-1 + ε (1)
Ln(1+StockDividend/Split or IPO)t = α + β1 Ln(1+ StockDividend/Split IPO)t-1 + β2 (2-yr Rm) + ε. (2)
In Table 4, we report coefficients of ordinary least squares (OLS) regressions for the corporate events. We find that the estimated coefficients on the lagged coefficient for the frequency, using both model (1) and (2), are statistically significant at the 1% level and positive for all corporate events. The estimated coefficients are lowest for IPOs and highest for stock dividends. These results indicate that management pays attention to the corporate events and seems to engage in mimicking activity. When we add the second control variable, the 2-year real stock market return, we see that the estimated coefficients vary for our three groups. Of particularly interest is the estimate for stock splits (1.8085; 1% level) which is substantial higher
9 Chittenden et al. (2010) include four additional variables of which two were significant; personal savings (significant at the 1% level) and the small stock premium (significant at the 5% level). We exclude these variables due to market size and data availability over our sample period.
17
compared to the group IPOs (0.9856; 5% level) and stock dividends (0.7336; 10% level). Our evidence also shows that the inclusion of our second control variable, the 2-year real market
return, is accompanied by the largest increase in the adjusted R2 from 49% to 57% for stock splits
(columns 3 and 4).
In summary, these regression results indicate that the propensity to undertake a stock dividend, a stock split is influenced by both the number of events in the preceding year and the level of stock market performance. For stock dividends, the propensity to undertake a stock dividend is influenced by the frequency of stock dividends the prior year and the level of stock
market performance but less so than stock splits. The most striking finding, perhaps, is that the
frequency of IPOs is influenced by the number of IPOs the prior year which is consistent with the IPO literature suggesting that IPOs comes in waves. The control variable 2-year real market return has a significant impact on the frequency of IPOs but at a smaller multiple than stock splits but at a greater multiple than stock dividends.
So and Tse (2000) investigate the split factor chosen and the change in split factor in relation to the target price. A key dependent variable in this analysis is the deviation in stock price from the median price. However, instead of using the split factor, our model is more closely related to the model employed by Weld et al. (2009) with the dependent variable defined as the pre-split minus the post-split price. Weld et al. (2009) use both a size median and an industry median price. Our model employs a market median price as creating size or industry median prices is inefficient given the limited number of firms in industry or size groups in the earliest years of the study. Thus, to examine the magnitude of price change and evaluate possible links to a stock price change based on a market norm we use model (3).
(Pricebefore - Priceafter) = α + β1(Pricebefore - Median Priceafter) + β2(2- yr. Rm) + ε. (3)
Table 5 presents analysis analogues to Table 4 except that we use the market norm of stock prices. The results in Table 5, column 1, show a positive and statistically significant intercept for stock dividends (35.07; 1% ), a statistically significant positive relationship to the pre-action price and the median price (0.3112; 1%) and also, albeit not statistically significant, negative relationship to the 2-year real market return.
Column 2 of Table 5 reports the estimated coefficient for stock splits. Interestingly, the intercept is negative and statistically significant (-22.2741; 10%). The estimated coefficient on the price change and the market norm, is positive and statistically significant (1.0167; 1%).
18
Further, the estimated coefficient on the prior 2-year real market return is insignificant. We believe the insignificant 2-year real market return can be explained as stock splits are usually smaller in size and thought of as a part of a more consistent, long term dividend policy decision process. Note that our model explains 89% of the variation in stock split price change versus the stock dividend model explaining 73% of the variation in stock split price change.
We conclude that both stock dividend and stock split activity is highly influenced by the market norm price. Management, for whatever motivation, clearly adjusts the price of the company stock to the market norm consistent with the findings of Chittenden et al. (2010), Weld et al. (2009) and the target-price habit or market norm of So and Tse (2000).
5. Summary and Conclusion
The debate about the “optimal” absolute price level of stocks has been ongoing over several years. We investigate 14,880 nominal and real stock prices for Swedish firms in the years 1900-2011 and find that stock prices have declined over time. Using a unique hand-collected database of stock prices for all stocks listed on the SSE in Sweden we find that mean nominal stock price in the last decade is just 5% compared to the mean price in the first decade.
We conjecture that one important explanation of this development was the intention by the government to increase individual savings in stocks by introducing specific tax benefits related to saving schemes for individuals in the late 1970s, early 1980s.
The paper finds that the propensity to a stock dividend, a stock split or an IPO is a function of the frequency of prior year level of these activities and the prior two year real market performance.
We examine the robustness of our conclusions in a variety of ways. Specifically, we extend our data over the 30-year period 1980 to 2011 by using monthly closing prices as of the end of June for each calendar year. The estimated correlation coefficient between the two price level series is high, 0.88. We find that mean stock price for June is SEK 104.40 and SEK 106.29 for December. The mean difference is not statistically significant although that the December prices are more skewed. We also re-examine the mean stock price levels as of the end of June and December for each of the decades during the last 30-year period and find that there is no statistically significant differences between the price levels. Our main conclusions are robust to these alternative definitions.
Our results are consistent with the drop in prices levels found by Chittenden et al. (2010) and while we find falling prices they do not exhibit the constant price level suggested by Weld et
19
al. (2009) given the continued decline in prices over time. We find that both nominal and real stock prices have declined over the period 1900 to 2011 with long periods of relatively stable prices. The large drop in prices from 1900 to 1920 is partially due to the World War I embargo and post-war weakness in Europe. The decades between 1920 and 1990 reflect a more stable price level close to the overall average of SEK 316 for the 1900 to 2011 period. These results are consistent with Chittenden et al. (2010), who show declines in the decade means with an overall average of $23.22. We do find that there is a strong relationship between the price change caused by a split or dividend and the median price in the market place. These results suggest that firms adjust prices to the perceived level that attracts investors, most likely retail investors or employees via savings plans. In short, we provide new evidence on what has been termed “the
nominal share price puzzle” by providing empirical evidence consistent with the prior studiesof
the decline innominal and real stock prices over a long time period. We find the actions taken
by firms to change the price level of the stock, perhaps to the “norm”, are related to prior events and median market prices.
20
References
Acheson, G.G., Hickson, C.R., Turner, J.D., & Ye, Q. (2009). Rule Britannia! British Stock Market Returns, 1825-1870. Journal of Economic History, 69-4, 1107-1137.
Angel, J. (1997). Tick Size, Share Prices, and Stock Splits. Journal of Finance 52, 655-681. Baker, K., & Gallagher, P. (1980). Management’s view of stock splits. Financial Management 9, 73-77.
Baker, M., Greenwood, R., & Wurgler, J. (2008). Catering Through Nominal Share Prices.
Electronic copy available at: http://ssrn.com/abstract=1083548, (pp46).
Black, F. (1986). Noise. Journal of Finance 41, 529-543.
Brennan, M., & Copeland, T. E. (1988). Stock splits, stock prices, and transaction costs. Journal of Financial Economics 22, 83-101.
Brennan, M., & Hughes, P. (1991). Stock prices and the supply of information. Journal of Finance 45, 1285-1295.
Carlsson, T. 1978. Aktiemarknaden. Kapitalmarknadsutredningen, SOU 1978:13.
Chittenden, W.T., Payne, J.D., & Toles, J.H. (2010). A Note on Affordability and the Optimal Share Price. Financial Review 45, 205-216.
Copeland T.E. (1979). Liquidity changes following stock splits. Journal of Finance 34, 115-141. Dinkelspiel, C. 1966. Investment Guide för aktier noterade på Stockholms fondbörs,
Bankir firman E. Öhman J:or AB, G. Hensher Reproduktion & Reklam AB, Stockholm. Dyl, E., & Elliott, W. (2006). The share price puzzle. Journal of Business 79, 2045-2066.
Fernando, C., Krishnamurti, S., & Spindt, P. (2007). Are share price levels informative? Evidence from the ownership, pricing, turnover and performance of IPO firms. Journal of Financial Markets 7, 377-403.
Ibbotson, R. G., & Sinquefield, R.A. (1979). Stocks, Bonds, Bills and Inflation: Updates, (1979). Financial Analysts Journal, Jul/Aug, 35-4, 40.
Lipson, M. & Mortal, S. (2006). The Effect of Stock Splits on Clientele: Is Tick Size Relevant? Journal of Corporate Finance 12, 878-896.
McEnally, R. W., & Todd, R.B. (1992). Cross-Sectional Variation in Common Stock Returns. Financial Analysts Journal, May/June, 48-3, 59-64.
Möller, B. 1961. Svensk Aktiemarknad, Nr 4, Ekonomiska studier, Nationalekonomiska institutionen, Göteborgs universitet.
21
Pokorny, C.R. 1958a. Aktiespararnas handbok, Bonniers Förlag.
Pokorny, C.R. 1958b. Hur stort bör aktiekapitalet vara?, Aktiebolags kapital – värdering, för Svenska Standardbolag, AB Kundtjänst.
Pokorny, C.R. 1961. Att ha aktier, Bonniers Förlag, Stockholm.
Ramklint, L. 1966. Börskursen, elementär handbok för aktiesparande, Gebers, Uppsala.
Renshaw, E. (1995). Is the Stock Market More Stable Than It Used to Be?. Financial Analysts Journal, Nov/Dec, 51-6, 81-88.
Shen, P. (2000). The P/E Ratio and Stock Market Performance. Economic review – Federal Reserve Bank of Kansas City, Fourth Quarter, 85-4, 23-36.
So, R., & Tse, Y. (2000). Rationality of stock splits: The target-price habit Hypothesis. Review of Quantitative Finance and Accounting 14, 67-84. Stockholms Fondbörs. 1963. AB Nordiska Bokhandeln, Stockholm.
Stockholms fondbörsnotering. 1901-1909. Fondmäklerifirman Arthur Mattsson, Stockholm. Weld, W.C., Michaely, R., Thaler, R.H., & Benartzi, S. (2009). The Nominal Share Price Puzzle. Journal of Economic Perspectives 23-2, 121-142.
Xu, Y., & Malkiel, B.G. (2003). Investigating the Behavior of Idiosyncratic Volatility. Journal of Business 76, 613-644.
22
Figure 1
Frequency of Stock Dividends, Stock Splits and Reverse Stock Splits, 1900-2011
This figure shows the number of stock dividends, stock splits (forward splits) and reverse stocks splits for all firms listed in Sweden over the time period 1900-2011. For the full sample period our data set reflect a total of 1,570 corporate events sorted into 1,166 stock dividends, 381 stock splits and 23 reverse stocks splits.
0 50 100 150 200 250 300 350 1900-09 1910-19 1920-29 1930-39 1940-49 1950-59 1960-69 1970-79 1980-89 1990-99 2000-11 F re q u e n c y
23
Figure 2
Distribution of Average Nominal Stock Prices in Sweden
This figure shows the distribution (in percent) of nominal stock prices (SEK) for all stocks listed in Sweden over our sample period 1900-2011. We present our results for three different time periods (Panel A to C).
Panel A: Distribution, 1900-1955 0 10 20 30 40 50 60 0-20 20-40 40-60 60-80 80-100 100-120 120-140 140-160 160-180 180-200 200-Price level P e rc e n t Panel B: Distribution, 1956-2011 0 5 10 15 20 25 30 0-20 20-40 40-60 60-80 80-100 100-120 120-140 140-160 160-180 180-200 200-Price level P e rc e n t Panel C: Distribution, 1900-2011 0 5 10 15 20 25 30 35 0-20 20-40 40-60 60-80 80-100 100-120 120-140 140-160 160-180 180-200 200-Price level P e rc e n t
24
Figure 3
Average Nominal Stock Prices in Sweden, 1900-2011
This figure shows the average nominal stock price for Swedish firms for three different time periods and for four different time series. Each calendar year, stocks are first sorted by end-year price and then sorted into quartiles. We then calculate the average price across quartiles. Quartile 1 contains firms in the lowest price group, inexpensive stocks, and quartile 4 contains firms in the highest price group, expensive stocks. We report the results in three panels, Panel A (inexpensive stocks), Panel B (expensive stocks) and Panel C reports the ratio between expensive and inexpensive stocks. The number of firms in each quartile varies between 20 and 64.
Panel A: Inexpensive stocks, average nominal stock price, 1900-2011
0 20 40 60 80 100 120 140 160 180 1900 1910 1920 1930 1940 1950 1960 1970 1980 1990 2000 2010 P ri c e ( S E K )
Panel B: Expensive stocks, average nominal stock price, 1900-2011
0 2000 4000 6000 8000 10000 12000 14000 1900 1910 1920 1930 1940 1950 1960 1970 1980 1990 2000 2010 P ri c e ( S E K )
Panel C: The ratio between expensive and inexpensive nominal stock price, 1900-2011. Solid line is annual data and dashed line is 10-year moving average 0 50 100 150 200 250 1900 1910 1920 1930 1940 1950 1960 1970 1980 1990 2000 2010 P ri c e R a ti o
25
Figure 4
Time Trend of the Ratio of Mean to Median Price by Decade
This figure shows the ratio of mean price to median price by decade for Swedish firms from 1900 to 2011. Higher values indicate a high mean to median price.
0 0,5 1 1,5 2 2,5 3 3,5 4 1900 1910 1920 1930 1940 1950 1960 1970 1980 1990 2000 2010
26
Figure 5
Distribution of number of years listed (“age”)
This figure shows the number of years listed for Swedish firms as of the end of 2011. The bars indicate number of firms (left-hand scale) and the solid line shows the cumulative fraction of firms relative to the number of years listed (right-hand scale).
0 5 10 15 20 25 30 1 10 17 25 32 48 60 84 108 0,00 10,00 20,00 30,00 40,00 50,00 60,00 70,00 80,00 90,00 100,00
27
Figure 6
Stock Price Deciles and Duration
These figures shows the fraction of shares which still belong to the same price decile after 1 (solid line) and 3 (dashed line) years. For each calendar year all stocks on the Stockholm Stock Exchange are ranked based on end-year price and sorted into deciles. Deciles 1 (10) are then denoted as inexpensive (expensive) stocks. The following year we quantify the fraction of shares which remain in the same decile. In Panel A we report findings for inexpensive stocks (decile 1) and in Panel B we report findings for expensive stocks (decile 10). The horizontal solid line shows the mean value for the periods 1901-55 and 1956-2011 for 1-year and 3-year respectively.
Panel A: Inexpensive Stocks and Duration
0,000 0,020 0,040 0,060 0,080 0,100 0,120 0,140 0,160 0,180 1901 1911 1921 1931 1941 1951 1961 1971 1981 1991 2001 2011
Panel B: Expensive stocks and Duration
0,000 0,020 0,040 0,060 0,080 0,100 0,120 0,140 1901 1911 1921 1931 1941 1951 1961 1971 1981 1991 2001 2011
28
Table 1 Mean Nominal and Real Stock Prices, SEK, for Swedish Firms, 1900-2011.
The table describes nominal and real stock prices (Swedish krona, in SEK), reported as of the last trading date of the year for Swedish firms. Real price is defined as nominal price multiplied with the ratio between consumer price index level as of the end of 2011 and the starting year. Source for consumer price index level is Statistics Sweden. In Panel A we report mean stock price in nominal and real terms for the full sample; firms with stock dividends, stock splits, reversed stock splits and firms without capital changes are presented in Panel B, C, D and E. Our sample size in these groups consists of 14,880, 9,273, 1,459, 142 and 4,006 firm-year observations respectively.
Panel A: Descriptive Statistics, Nominal (Real) Stock Price, Full Sample Period
Mean Median Standard Deviation
Minimum Maximum Firm-years
1900-09 1,471 (75,818) 710 (37,368) 2,915(148,379) 40 (2,146) 29,300 (1,514,611) 589 1910-19 1,363 (48,954) 620 (20,764) 2,729 (99,965) 25 (682) 25,300 (883,993) 727 1920-29 355 (8,503) 142 (3,492) 622 (14,387) 4 (86) 9,000 (184,885) 712 1930-39 238 (6,778) 111 (3,197) 476 (13,591) 2 (45) 4,140 (119,700) 797 1940-49 296 (5,823) 168 (3,245) 435 (8,643) 5 (114) 4,100 (79,874) 1,267 1950-59 382 (5,047) 185 (2,490) 1,244 (15,831) 1 (14) 22,000 (268,677) 1,306 1960-69 268 (2,581) 195 (1,837) 310 (3,141) 1 (8) 2,600 (27,298) 1,507 1970-79 197 (1,084) 163 (867) 235 (1,221) 1 (6) 4,800 (16,962) 1,403 1980-89 251 (575) 181 (397) 503 (1,344) 0.50 (1) 9,500 (24,975) 1,493 1990-99 111 (139) 81 (103) 117 (146) 0.35 (1) 1,500 (1,810) 1,817 2000-09 80 (88) 52 (56) 102 (113) 0.11 (0.11) 1,740 (1,932) 2,740 2000-11 79 (87) 51 (55) 99 (110) 0.06 (0.06) 1,740 (1,932) 3,242 1900-49 653 (24,169) 200 (4,851) 1,726 (75,624) 2 (45) 29,300 (1,514,611) 4,102 1950-99 234 (1,747) 159 (732) 603 (7,052) 0.35 (1) 22,000 (268,677) 7,452 1900-55 609 (21,270) 200 (4,248) 1,640 (70,164) 1 (14) 29,300 (1,514,611) 4,839 1956-2011 174 (962) 120 (240) 451 (4,769) 0.06 (0.06) 22,000 (268,677) 10,041 1900-2011 316 (7,566) 140 (826) 1,026 (41,311) 0.06 (0.06) 29,300 (1,514,611) 14,880
Panel B: Descriptive Statistics, Nominal (Real) Stock Price, Stock Dividends
1900-09 1,930 (98,501) 1,005 (52,315) 3,364 (167,603) 92 (4,814) 29,300 (1,514,611) 253 1910-19 1,258 (46,357) 650(22,176) 1,831 (75,612) 50 (1,194) 15,700 (738,754) 439 1920-29 354 (8,510) 153 (3,766) 568 (13,657) 4 (86) 3,710 (89,572) 499 1930-39 241 (6,869) 117 (3,287) 513 (14,667) 3 (88) 4,140 (119,700) 588 1940-49 279 (5,452) 166(3,209) 424 (8,403) 13 (258) 4,100 (79,874) 942 1950-59 382 (5,049) 186 (2,504) 1,299 (16,533) 18 (244) 22,000 (268,677) 1,186 1960-69 248 (2,397) 200 (1,856) 227 (2,368) 1 (8,75) 2,400 (26,206) 1,360 1970-79 189 (1,036) 160 (865) 211 (1,032) 1 (7.51) 4,800 (16,962) 1,284 1980-89 254 (580) 195 (425) 463 (1,255) 0.65 (1.13) 9,500 (24,975) 1,171 1990-99 134 (171) 103 (132) 118 (151) 0.66 (1.12) 998 (1,204) 758 2000-09 112 (125) 88 (101) 95 (107) 0.66 (0.91) 969 (1,157) 685 2000-11 111 (123) 89 (99) 94 (105) 0.65 (0.91) 969 (1,157) 793 1900-49 596 (21,570) 190 (4,269) 1,440 (66,677) 3 (88) 29,300 (1,514,611) 2,721 1950-99 249 (1,977) 175 (971) 649 (7,820) 0.65 (1.13) 22,000 (268,677) 5,759 1900-55 551 (18,374) 190 (3,843) 1,375 (60,496) 3 (88) 29,300 (1,514,611) 3,381 1956-2011 217 (1,367) 160 (668) 539 (5,979) 0.65 (1.13) 22,000 (268,677) 5,892 1900-2011 339 (7,568) 17 (1,382) 948 (37,734) 0.65 (1.13) 29,300 (1,514,611) 9,273
Panel C: Descriptive Statistics, Nominal (Real) Stock Price, Stock Splits
1900-09 87 (4,204) 87 (4,204) 1 (67) 87(4,156) 88 (4,252) 2 1910-19 76 (2,981) 78 (3,055) 8 (932) 61 (1,431 86 (4,174) 8 1920-29 63 (1,544) 65 (1,504) 7 (192) 53 (1,197) 77 (1,811) 11 1930-39 64 (1,823) 64 (1,893) 17 (441) 44 (1,261) 86 (2,351) 10 1940-49 83 (1,616) 80 (1,688) 7 (158) 71 (1,318) 92 (1,792) 10 1950-59 161 (2,069) 87 (1,148) 135 (1,676) 42 (733) 425 (5,105) 27 1960-69 305 (2,807) 198 (1,943) 238 (1,971) 116 (1,015) 1,300 (10,440) 37 1970-79 206 (1,113) 175 (804) 127 (861) 63 (239) 735 (4,545) 54 1980-89 218 (492) 175 (375) 162 (426) 1 (2) 900 (2,498) 137 1990-99 131 (162) 104 (127) 133 (161) 1 (2) 1,500 (1,810) 344 2000-11 83 (91) 64 (66) 80 (88) 1 (1) 515 (547) 811 1900-49 72 (2,034) 74 (1,688) 13 (867) 44 (1,261) 92 (4,252) 41 1950-99 170 (572) 128 (227) 156 (1,006) 1 (2) 1,500 (1,810) 599 1900-55 86 (1,958) 75 (1,647) 63 (1,077) 44 (1,261) 425 (5,105) 56 1956-2011 120 (279) 90 (107) 126 (699) 1 (2) 1,500 (1,810) 1,403 1900-2011 118 (343) 86 (113) 124 (760) 1 (2) 1,500 (1,810) 1,459
29
Panel D: Descriptive Statistics, Nominal (Real) Stock Price, Reverse Stock Splits
1995-2011 30.64 (35.13) 9.85 (10.71) 43.20 (50.80) 0.15 (0.17) 192 (232.39) 142
Panel E: Descriptive Statistics, Nominal (Real) Stock Price, No Capital Changes
1900-09 1,132 (59,065) 641 (33,467) 2,482 (130,056) 40 (2,146) 28,000 (1,481,396) 334 1910-19 1,570 (54,529) 600 (19,904) 3,748 (130,302) 25 (682) 25,300 (883993) 279 1920-29 372 (8,831) 115 (2,839) 749 (16,317) 4 (108) 9,000 (184,885) 203 1930-39 239 (6,759) 105 (2,988) 362 (10,175) 2 (45) 2,200 (63,608) 199 1940-49 354 (7,028) 180 (3,674) 466 (9,312) 5 (114) 2,650 (51,417) 325 1950-59 445 (5,803) 195 (2,752) 566 (7,186) 1 (14) 2,100 (24,923) 103 1960-69 491 (4,791) 169 (1,635) 779 (7,726) 1 (8) 2,600 (27,298) 110 1970-79 348 (2,005) 210 (1,204) 532 (3,130) 1 (6) 2,700 (12,534) 65 1980-89 260 (607) 122 (233) 816 (2,119) 1 (2) 6,500 (16,928) 185 1990-99 77 (95) 51 (64) 99 (121) 1 (1) 1,340 (1,617) 686 2000-09 65 (73) 35 (38) 113 (126 1 (1) 1,740 (1,932) 1,260 2000-11 65 (71) 35 (38) 109 (120) 1 (1) 1,740 (1,932) 1,517 1900-49 787 (30,122) 278 (8,034) 2,209 (91,763) 2 (45) 28,000 (1,481,396) 1,340 1950-99 194 (1,247) 85 (133) 489 (3,935) 1 (14) 6,500 (16,928) 1,149 1900-55 769 (29,025) 273 (7,292) 2,163 (89,864) 1 (14) 28,000 (1,481,396) 1,402 1956-2011 114 (465) 50 (59) 331 (2,376) 1 (9) 6,500 (16,928) 2,604 1900-2011 343 (10,460) 86 (152) 1,344 (54,902) 1 (14) 28,000 (1,481,396) 4,006
30
Table 2 Mean and Median Nominal Stock Prices and Firm Age
This table shows descriptive statistics for nominal stock prices for Swedish firms and classified as young and old firms respectively. Both means and median stock prices are reported with medians reported in parentheses. To be included in the analysis we require that the firm has five consecutive stock prices. All firms are then broken down into two groups, young and old firms. Young firms are classified as firms which have been listed for at least 15 years. Old firms are firms which have been listed for at least 16 years. The first row in the last column shows the test of a zero mean difference between young and old firms using a t-test. The Kruskal-Wallis Chi-square test for significant difference between young and old firms in medians are used and reported in parentheses.
Period Young Firms Old Firms Test of Difference
1900-49 716.81 (240) 1,673.16 (715) -956.35*** (117.88***) 1950-99 182.91 (110) 351.94 (173) -169.03*** (59.75***) 1900-55 717.35 (240) 1,631.88 (707.50) -914.53*** (167.44***) 1956-2011 91.81 (58.13) 156.64 (115) -64.83*** (44.44***) 1900-2011 195.72 (71) 611.16 (195) -415.44*** (201.12***)
31
Table 3 Nominal and Real Stock Prices, Frequency and Survival Rates of Initial Public Offerings (IPOs) in Sweden over the Time Period 1900-2011
This table shows the descriptive statistics mean and median on nominal and real stock prices as of the end of the flotation year for IPOs over the sample period 1900-2011. The two last columns shows the 5-and 10-year survival rates defined as the fraction of firms which are still listed 5 and 10 years after the flotation. We report statistics for eleven decades, two half centuries and for the overall sample period.
Time period Mean (median) Nominal Stock Price, SEK
Mean (median) Real Stock Price, SEK
Number of Firms Survival-Rates 5-year 10-year 1900-09 1,656 (700) 87,633 (37,830) 152 0.395 0.263 1910-19 1,176 (510) 47,948 (13,244) 71 0.535 0.310 1920-29 276 (90) 6,703 (2,417) 43 0.372 0.488 1930-39 202 (120) 5,692 (3,447) 39 0.769 0.795 1940-49 300 (135) 6,241 (2,826) 23 0.739 0.696 1950-59 799 (182) 11,180 (2,531) 43 0.907 0.837 1960-69 193 (178) 1,902 (1,801) 34 0.853 0.588 1970-79 169 (159) 927 (831) 45 0.800 0.578 1980-89 220 (143) 522 (312) 113 0.496 0.239 1990-99 101 (68) 124 (84) 292 0.623 0.449 2000-09 58 (39) 66 (43) 153 0.392 0.124 2000-11 55 (36) 61 (41) 179 0.335 0.106 1900-1949 1,103 (438) 52,983 (14,525) 328 0.491 0.396 1950-1999 195 (110) 1,295 (171) 527 0.649 0.455 1900-55 1,083 (382) 48,896 (11,910) 365 0.534 0.441 1956-2011 119 (76) 336 (99) 669 0.550 0.341 1900-2011 459 (117) 17,477 (314) 1,034 0.544 0.376
32
Table 4 OLS-Regression Results on the Frequency of Stock Splits, Stock Dividends and Initial Public Offerings (IPOs) over the Time Period 1900-2011
This table reports estimated coefficients in an OLS-regression model where the dependent variable is the natural logarithm of 1+ the frequency of stock splits, stock dividends and IPOs respectively. The independent variables are: (a) the lagged dependent variable one year (t-1) and (b) the 2-year mean (geometric compounded) real stock market return on the market portfolio and adjusted for cash dividends. White’s t-statistics are reported in parentheses below estimated coefficients.
Stock Dividends Stock Splits Initial Public Offerings (IPOs) (1) (2) (1) (2) (1) (2) Intercept 0.3545*** (2.52) 0.2498 (1.39) 0.5221*** (2.90) 0.3929*** (2.23) 0.8995*** (5.04) 0.8417*** (4.41) Ln(1+Frequency)t-1 0.8378*** (14.31) 0.8539*** (12.69) 0.7008*** (7.24) 0.6632*** (7.37) 0.5380*** (6.44) 0.5207*** (5.73)
2-year Mean Real Stock Market Return
0.7336* (1.70) 1.8085*** (3.71) 0.9856** (2.06) R-square adjusted 0.66 0.68 0.49 0.57 0.29 0.34 F 205*** 80*** 52*** 36*** 41*** 20***
33
Table 5 OLS-Regression Results on the Price Change Relationship for Stock Dividends and Stock Splits over the period 1900 - 2011
This table reports estimated coefficients in an OLS-regression model where the dependent variable is the price change from pre-stock dividend or pre-stock split to post-stock dividend or post-stock split respectively. The independent variables are: (a) the price difference to the median price and (b) the 2-year mean (geometric compounded) real stock market return on the market portfolio and adjusted for cash dividends. White’s t-statistics are reported in parentheses below estimated coefficients.
Stock Dividends Stock Splits
Intercept 35.0651*** (2.91) -22.2741* (-1.78) (Pricebefore -Pricemedian) 0.3112*** (14.10) 1.0167*** (48.62) 2-yr Rm -87.3588 (-1.35) 72.5956 (1.36) Adj. R2 0.73 0.89 F 103*** 229***