Örebro University, SE-701 82 Örebro, Sweden Grevgatan 34, SE-114 53 Stockholm, Sweden
The report is available for download on www.entreprenorskapsforum.se
THE ENTREPRENEURIAL CODE -
A COMP
ARA
TIVE STUDY OF ENTREPRENEURIAL DYNAMICS IN CHINA, EUROPE AND THE U.S.
THE ENTREPRENEURIAL CODE
- A COMPARATIVE STUDY OF ENTREPRENEURIAL
Total Early-stage entrepreneurial activity (TEA) Percentage of individuals aged 18-64 who are either a nascent entrepreneur or owner-manager of a new business.
Nascent entrepreneurship rate
Percentage of individuals aged 18-64 who are currently a nascent entrepreneur, i.e., actively involved in setting up
a business they will own or co-own; this business has not paid salaries, wages, or any other payments to the owners for more than three months.
New business ownership rate
Percentage of individuals aged 18-64 who are currently an owner-manager of a new business, i.e., owning and managing a running business that has paid salaries, wages, or any other payments to the owners for more than three months, but not more than 42 months.
Characteristics of early-stage entrepreneurial activity
Opportunity-based early-stage entrepreneurial activity Percentage of individuals involved in early-stage entrepreneu-rial activity (as defined above) who claim to be purely or partly driven by opportunity as opposed to finding no other option for work. This includes taking advantage of a business opportunity or having a job but seeking better opportunity.
Necessity-based early-stage entrepreneurial activity Percentage of individuals involved in early-stage entrepre-neurial activity (as defined above) who claim to be driven by necessity (having no better choice for work) as opposed to opportunity.
Improvement-driven opportunity early-stage entrepreneurial activity
Percentage of individuals involved in early-stage entre-preneurial activity (as defined above) who (1) claim to be driven by opportunity as opposed to finding no other option for work; and (2) who indicate that the main driver for being involved in this opportunity is being independent or increasing their income, rather than just maintaining their income.
High-growth expectation early-stage entrepreneurial activity: relative prevalence
Percentage of early-stage entrepreneurs (as defined above) who expect to employ at least 20 people five years from now.
New product-market-oriented early-stage entrepreneurial activity: relative prevalence
Percentage of early-stage entrepreneurs (as defined above) who report that their product or service is new to at least some customers and that not many businesses offer the same product or service.
International-oriented early-stage entrepreneurial activity: relative prevalence
Percentage of early-stage entrepreneurs (as defined above) who report that at least 25% of their customers are from foreign countries.
Established business ownership rate
Percentage of individuals aged 18-64 who are currently an owner-manager of an established business, i.e., owning and managing a running business that has paid salaries, wages, or any other payments to the owners for more than 42 months. Business discontinuation rate
Percentage of individuals aged 18-64 who, in the past 12 months, have discontinued a business, either by selling, shut-ting down, or otherwise discontinuing an owner/management relationship with the business.
Note: this is NOT a measure of business failure rates. Individual attributes of a potential entrepreneur Perceived opportunities
Percentage of individuals aged 18-64 involved in any stage of entrepreneurial activity excluded who see good
opportunities to start a business in the area where they live. Perceived capabilities
Percentage of individuals aged 18-64 involved in any stage of entrepreneurial activity excluded who believe they have the required skills and knowledge to start a business.
Entrepreneurial intentions
Percentage of individuals aged 18-64 involved in any stage of entrepreneurial activity excluded who are latent entrepreneurs and who intend to start a business within three years. Fear of failure rate
Percentage of individuals aged 18-64 involved in any stage of entrepreneurial activity excluded who report that fear of failure would prevent them from setting up a business.
GEM OPERATIONAL DEFINITIONS:
THE ENTREPRENEURIAL CODE
- A COMPARATIVE STUDY OF ENTREPRENEURIAL
DYNAMICS IN CHINA, EUROPE AND THE U.S.
Sweden’s GEM team 2014 consisted of Pontus Braunerhjelm, Professor at KTH Royal Institute of Technology and Research Director at Swedish Entrepreneurship Forum, Carin Holmquist, Professor Stockholm School of Economics, Johan P. Larsson, PhD Jönköping International Business School and Swedish Entrepreneurship Forum, Per Thulin, PhD Royal Institute of Technology and Swedish Entrepreneurship Forum and Lisa Silver, Project Manager Swedish Entrepreneurship Forum.The team wishes to thank the GEM global coordination team for their cooperation and support. We especially like to mention Yana Litovsky, Alicia Coduras and Francis Carmona for their efforts in providing high quality data and analysis. Finally we like to express our gratitude to VINNOVA and the Federation of Swedish Enterprises, who has provided funding for this project.
4
© Swedish Entrepreneurship Forum, 2015 ISBN: 978-91-89301-74-0
Authors: Pontus Braunerhjelm, Carin Holmquist, Johan P Larsson, Lisa Silver and Per Thulin. Photo: Istockphoto
Graphic design and production:
Klas Håkansson, Swedish Entrepreneurship Forum Print: E-print, Stockholm
PREFACE 7
1 – INTRODUCTION AND SUMMARY 9
2 – A CROSS-COUNTRY ANALYSIS OF ENTREPRENEURIAL ACTIVITY, AMBITION AND ATTITUDES 21
3 – ENTREPRENEURSHIP AND WELL-BEING 43
4 – CONCLUDING REMARKS 51
REFERENCES 59 APPENDIX 1 – NATIONAL EXPERTS SURVEY
– EXPERTS’ VIEWS ON CONDITIONS FOR ENTREPRENEURSHIP 61
APPENDIX 2 – GEM METHOD 65
APPENDIX 3 – QUESTIONS TO EXPERTS 66
Swedish Entrepreneurship Forum hereby presents
The Entrepreneurial Code – A comparative study of entrepreneurial dynamics in China, Europe and the U.S., based on data from the Global Entrepreneurship
Monitor (GEM). GEM is the most comprehensive worldwide investigation on entrepreneurship that annually measures and analyzes entrepreneurial activities, aspirations and attitudes. The project has since the start in 1999 grown from ten participating countries to 73 in the 2014 survey. Altogether 206 000 individuals were interviewed together with 3 936 national experts on entrepreneurship. The survey covers 72 percent of the world’s population and 90 percent of global GDP. The launch of the global report was made at a conference in Mexico in February and can be downloaded from the GEM Consortium web-site, www.gemconsortium.org.
GEM provides an annual and comprehensive snaps-hot of the level, aspirations and attitudes to entre-preneurship among the population, i.e. not only the
entrepreneurs themselves. The analysis also draws attention to economic policy conditions for entre-preneurship, growth and innovation. International comparisons are made possible through extensive coordination of methodology and wording of the questionnaires and analyses.
The Entrepreneurial Code examines the similarities
and differences between the dominating economic regions in terms of level of entrepreneurial activity, entrepreneurs’ ambition to grow, internationalize and to innovate, as well as the attitudes towards entrepre-neurship. We present the development over time as well as the levels for a large number of variables related to activity, ambition and attitude. In addition, we com-pare entrepreneurial activity to intrapreneurial efforts undertaken by employees in already existing firms. As usual, the findings, policy recommendations and the analysis presented in the report represent the views of the authors and is not necessarily shared by The Swedish Entrepreneurship Forum.
PREFACE
Stockholm, May 2015 Johan Eklund
Professor Jönköping International Business School and Managing Director of Swedish Entrepreneurship Forum
Pontus Braunerhjelm
Professor KTH Royal Institute of Technology, Research Director, Swedish Entrepreneurship Forum and project manager of the Swedish GEM team
1
INTRODUCTION AND SUMMARY
1. The global report can be downloaded from www.gemconsortium.org. 1.1 THE GLOBAL ENTREPRENEURSHIP MONITOR (GEM) – AN INTRODUCTION The 16th Global Entrepreneurship Monitor Report (GEM) was published in 2015.1 The report annually examines individual attitudes, activities and ambitions with respect to entrepreneurship around the world. Since the first survey, which covered 10 countries, was conducted in 1999 the study has grown to include 206,000 respondents in 73 countries in 2014, repre-senting over 72 percent of the world’s population and 90 percent of world GDP. This makes GEM the largest ongoing study of entrepreneurship and entrepreneu-rial dynamics in the world.
The current report focuses on entrepreneurial development in innovation-driven economies and China. More precisely, we will discuss how entre-preneurial activities, ambitions and attitudes have evolved over time in the EU-countries, the U.S. and China. Part of the analysis will be narrowed to the larger EU-countries (France, Germany, Italy and the UK), China, Sweden and the U.S., while the results for smaller EU-countries (Belgium, Ireland and Netherlands) and the Nordic countries (Denmark, Finland and Norway) will be presented as weighed
averages of their respective groups. We will explore how these different countries and country groups compare with one another and whether there are lessons to be learned from divergent entrepreneu-rial patterns.
This introductory chapter describes the GEM model and briefly summarizes the global results of the 2014 survey, while chapter 2 presents more detailed results for various European countries, the U.S. and China. Subsequently, chapter 3 presents an analysis of the well-being of entrepreneurs compared with that of employees. Finally, conclusions and policy recommen-dations are provided in chapter 4.
THE GEM CONCEPTUAL FRAMEWORK
The GEM model is based on the idea that entrepre-neurship is key to a country’s prosperity and that this applies, albeit through different channels and in vari-ous ways, regardless of the degree of a country’s eco-nomic development.
The objective of the model is to map the entrepre-neurial process, beginning with the potential entre-preneur, moving to the start-up of a business, then to an established business, and finally to a potential
THE ENTREPRENEURIAL CODE – A COMPARATIVE STUDY OF ENTREPRENEURIAL DYNAMICS IN CHINA, EUROPE AND THE U.S. 10
Figure 1.1: The entrepreneurial process
Figure 1.2: Characteristics and key concepts, economic development phases
2. Definitions and terms are explained on the inside of the cover of the report.
discontinuation of the business. The GEM differs from similar projects in that it takes the individual’s per-spective on entrepreneurial activities, ambitions and attitudes.2
The GEM methodology focuses on the separate stages that characterize the entrepreneurial process (Figure 1.1). The starting point is the individual’s potential, i.e., whether an individual is considering exploiting identified opportunities and believes she or he can start and run a firm. When the potential entrepreneur has converted perceived opportunities and capabilities into activity, the process moves to the next phase – that of the nascent entrepreneur – someone who is involved in starting a business during its first three months. The next stage is ownership and management of a new business, a period that runs from three months to 3.5 years after the start of the business. These two phases form the foundation for the measure of TEA (Total Early-Stage Entrepreneurial Activity) – which is a central part of the GEM survey. The GEM survey also collects data on businesses that are older than 3.5 years. These are defined as
established businesses. Finally, information is gathe-red on the discontinuation of businesses. This is the basic structure of the model that forms the basis for the results presented in this report.
The participating countries in the survey are divided by geographic region and different stages of economic development. The three different stages of develop-ment are defined as factor-driven, efficiency-driven and innovation-driven economies. Figure 1.2 illustrates these stages and describe in more detail the characte-ristics of each category, while Table 1.1 classifies the 73 countries that participated in the GEM study in 2014 by geographic region and stage of economic development. 1.2 SUMMARY OF THE GLOBAL GEM REPORT 2014
ENTREPRENEURIAL ATTITUDES, PERCEIVED OPPOR-TUNITIES, CAPABILITIES AND INTENTIONS
Promoting entrepreneurial awareness and positive attitudes towards entrepreneurship is a high priority on most countries’ policy agendas. The underlying Potential Entrepreneur: Opportunities, Knowledge Nascent Entrepreneur: Involved in Setting Up a Business (0-3 months) Owner-Manager of a New Business (3-42 months) Owner-Manager of an Established Business Discontinuation of Business Total Early-stage Entrepreneurial Activity (TEA)
CONCEPTION FIRM BIRTH PERSISTENCE
From subsistence agriculture to mining of natural resources,
creation of regional scale intensive agglomerations
Increased industrialization and economies of scale. Large companies dominate but niches in the supply chains opens for small
and medium-sized enterprises
R&D knowledge-intensive companies and growing service
sector. Greater potential for innovative entrepreneurial
activity
FACTOR-DRIVEN ECONOMIES EFFICIENCY-DRIVEN ECONOMIES INNOVATION-DRIVEN ECONOMIES
11 Introduction to Global Entrepreneurship Monitor and summary of the global results
Table 1.1: Countries by geographic region and economic development
Country Factor-driven
economies Effi ciency-driven economies Innovati on-driveneconomies
Africa Angola, Botswana, Burkina
Faso, Cameroon, Uganda South Africa
Asia
& Oceania Philippines, India, Iran, Vietnam Indonesia, Kazakhstan, China, Malaysia, Thailand Australia, Japan, Qatar,Singapore, Taiwan
Lati n America
& Caribbean Bolivia Argenti na, Barbados, Belize, Brazil, Chile, Colombia, Costa Rica, Ecuador, El Salvador, Guatemala, Jamaica, Mexico, Panama, Peru, Surinam, Uruguay
Puerto Rico, Trinidad & Tobago
Europe – EU Croati a, Lithuania, Poland,
Romania, Hungary Belgium, Denmark, Estonia, Finland, France, Greece, Ireland, Italy, Luxembourg, Netherlands, Portugal, Slovakia, Slovenia, Spain, UK, Sweden, Germany, Austria
Europe – non EU Bosnia-Hercegovina, Georgia,
Kosovo, Russia Norway, Switzerland
North America Canada, USA
notion is that an overall positive view of entrepre-neurship may result in more people taking the plunge into business start-ups. Consequently, the GEM sur-vey also gathers data on attitudes and rial ambitions, in addition to data on entrepreneu-rial activities. Attitudes towards entrepreneurship include an individual’s perceived ability to start a business, perceived business opportunities and fear of failure – all of which can be expected to influence entrepreneurial activity. Obviously, more severe con-sequences of failure can deter an individual from exploring a perceived business opportunity.
In addition to factors at the individual level, there are contextual conditions, such as the dynamics of the labour market and other institutions (laws and regulations), that may affect individuals’ propensi-ties to engage in entrepreneurial activity. Hence, a complex mix of individual, social and contextual factors underlie individuals’ decisions to engage in entrepreneurial endeavours. GEM enables us to capture this complexity by providing individually based data.
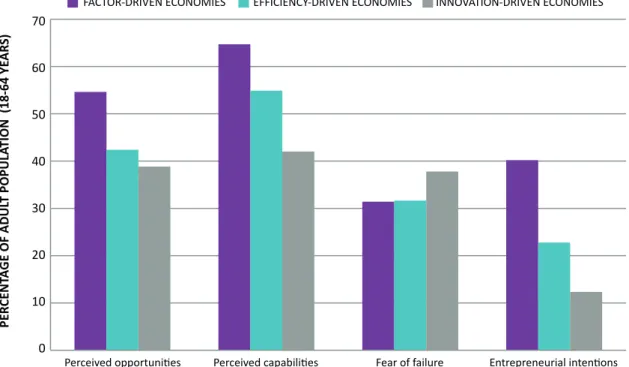
As shown in Figure 1.3, there are considerable diffe-rences between countries in different stages of econo-mic development regarding perceived entrepreneurial opportunities, individuals’ abilities to start busines-ses and entrepreneurial intentions. A generally esta-blished pattern is that perceived opportunities and capabilities tend to decline as economic development increases.
The highest average levels of perceived business opportunities (55 percent) and perceived capabilities (65 percent) are found in the factor-driven countries, while the lowest are found in the innovation-driven countries (39 and 44 percent, respectively). Among the innovation-driven countries, Sweden has the highest proportion of the population that considers itself able to identify good business opportunities (70 percent). However, only 37 percent view themselves as having sufficient capabilities to start a business. Denmark and Norway exhibit similar patterns.
Another interesting pattern that emerges in the European Union is that countries that have expe-rienced long-term economic problems do not differ
THE ENTREPRENEURIAL CODE – A COMPARATIVE STUDY OF ENTREPRENEURIAL DYNAMICS IN CHINA, EUROPE AND THE U.S. 12
Figure 1.3: Individual attributes in the GEM economies in 2014, by phase of economic development
significantly from other countries in terms of percei-ved capabilities to start and run businesses. However, they do express the lowest levels of perceived entre-preneurial opportunities (17 percent in Slovenia, 18 percent in Croatia, 20 percent in Greece, 23 percent in Spain and 23 percent in Portugal).
The next step in the entrepreneurial process starts when a potential entrepreneur decides he or she intends to start a new business in the next three years; these are so-called potential entrepreneurs. Also, entrepreneurial intent differs between countries in different stages of economic development, with fac-tor-driven economies generally exhibiting significantly higher levels of entrepreneurial intent. This can, at least partly, be explained by the fact that there are fewer choices in the labour markets of these countries. In efficiency-driven and (especially) innovation-driven economies, entrepreneurial intentions are lower.
There is large variation in the data, which can be illus-trated by Botswana, where 63 percent of respondents state that they intend to start a business within three years, while the corresponding figure for Japan is three
percent. Among innovation-driven countries, Qatar, Trinidad and Tobago and Taiwan have the highest levels of entrepreneurial intentions (50, 34 and 26 percent).
Perceived business opportunities, high confidence in one’s own capabilities and entrepreneurial intentions are not sufficient to lead to a high level of entrepreneu-rial activity. Fear of failure in entrepreneuentrepreneu-rial ventures may leave a large portion of potential opportunities untapped. This fear is greater in innovation-driven countries than in efficiency- and factor-driven countries. In several countries that have experienced economic crises in recent years, such as Greece, Portugal and Italy, high proportions of respondents express fear of failure, while low proportions of respondents see per-ceived business opportunities. It is important to note that fear of failure partly relates to the type of business a respondent intends to start, which also tends to cor-relate with degree of economic development. In fac-tor-driven countries characterised by large economic inequalities, entrepreneurial intentions often focus on local, necessity-based entrepreneurship, with limited growth and development ambitions.
Perceived opportunities
FACTOR-DRIVEN ECONOMIES EFFICIENCY-DRIVEN ECONOMIES INNOVATION-DRIVEN ECONOMIES
Perceived capabilities Fear of failure Entrepreneurial intentions
PER CENT AGE OF ADUL T POPULA TION (18-64 YE AR S) 70 60 50 40 30 20 10 0
13 Introduction to Global Entrepreneurship Monitor and summary of the global results
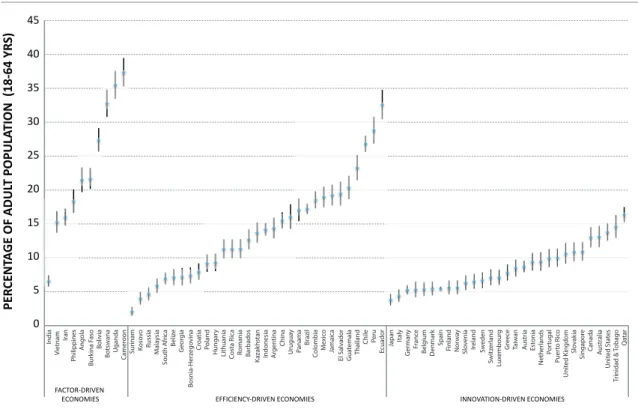
TOTAL ENTREPRENEURIAL ACTIVITY (TEA) – ENTREPRENEURSHIP IN THE EARLY STAGES As noted above, Total Entrepreneurial Activity (TEA) is a central part of the GEM survey. A country’s TEA is defined as the proportion of the population aged 18–64 who are actively involved in starting a busi-ness in either the very early phase (nascent entre-preneurship, 0–3 months) or the phase that extends to 3.5 years after a company’s inception.
Figure 1.4 shows TEA for all countries, categori-zed by development. Factor-driven economies are shown to have the highest proportion of entrepre-neurial activity, with an average of 23 percent, while the corresponding proportion is nine percent for innovation-driven economies.3
Among innovation-driven economies, the highest TEA levels are found in Qatar (16 percent), Trinidad & Tobago (15 percent), the United States (14 per-cent), Australia (13 percent) and Canada (13 perper-cent), whereas the lowest levels are found in Japan and Italy (four percent).
Motivational reasons
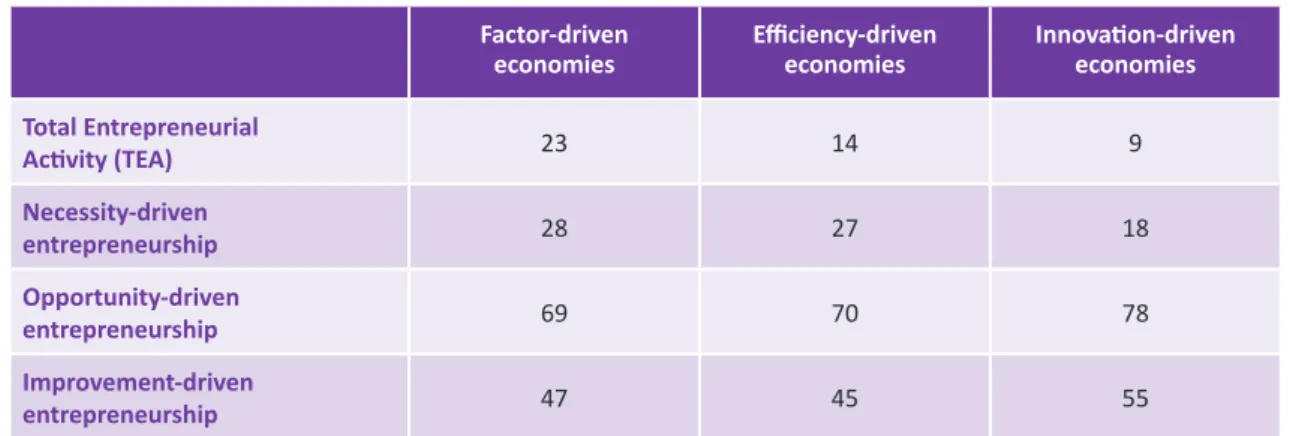
The motivational reasons for starting a business vary widely across countries. At the individual level, this is captured in the GEM model by the distinction between necessity- and opportunity-based entre-preneurship. In the former case, reasons to start a business are related to limited possibilities to earn a livelihood relative to perceived business opportuni-ties. Among those who view entrepreneurship as an opportunity rather than a necessity, the study also discerns improvement-driven opportunity, which pertains to entrepreneurs driven by the opportunity to earn more money and achieve greater indepen-dence rather than the need to maintain an income. The share of necessity-based entrepreneurship in TEA is clearly linked to the level of economic deve-lopment, with necessity-driven entrepreneurship decreasing as economic development increases (Table 1.2).
Necessity-driven entrepreneurship often relates to fundamental economic factors. In developing countries, start-ups are often a consequence of a Figure 1.4: Total early-stage entrepreneurship (TEA) in 2014, by economic development
PER CENT AGE OF ADUL T POPULA TION (18-64 YR S) 45 40 35 30 25 20 15 10 5 0 FACTOR-DRIVEN
ECONOMIES EFFICIENCY-DRIVEN ECONOMIES INNOVATION-DRIVEN ECONOMIES
India Vietnam Ira n Philippines A ngola Bur kina F aso Bolivia Botsw ana Uganda Camer oon Sur inam Koso vo Russia M ala ysia South A fr ica Beliz e G eor gia Bosnia-Her zego vina Cr oa tia Poland Hungar y Lithuania Costa R ica
Romania Barbados
Kazak hstan Indonesia Argen tina China Urugua y Panama Br azil Colombia M exic o Jamaica El S alv ador Gua temala Thailand Chile Peru Ecuador Japan Italy G er man y Fr anc e Belg ium D enmar k Spain Finland Nor w ay Slo venia Ireland Sw eden Switz er land Lux embour g Gr eec e Taiw an Austr ia Est onia Nether lands Por tugal Puer to R ic o Unit ed K
ingdom Slovak
ia Singapor e Canada Austr alia Unit ed S ta tes Tr inidad & T obago Qa tar
THE ENTREPRENEURIAL CODE – A COMPARATIVE STUDY OF ENTREPRENEURIAL DYNAMICS IN CHINA, EUROPE AND THE U.S. 14
lack of jobs and undeveloped social security systems, which force people to try to acquire alternative live-lihoods through entrepreneurship. As economies develop, the supply of jobs usually increases, resul-ting in fewer people being forced into necessity-based entrepreneurship. Factor-driven economies are characterised by the highest levels of entrepre-neurial activity in the GEM study but also the highest proportion of necessity-based entrepreneurship. In 2014, the average of necessity-based entrepreneur-ship was 28 and 27 percent, respectively, for factor-driven and efficiency-factor-driven economies, while the corresponding proportion for innovation-driven eco-nomies was 18 percent.
Innovation-driven economies exhibit, on average, the lowest levels of entrepreneurial activity but the highest proportion of opportunity-based entrepre-neurship. In these economies, the entrepreneur iden-tifies and pursues an opportunity that can improve not only his/her income but also his/her degree of perceived independence. In 14 of the 30 innovation-driven countries, over 80 percent of entrepreneurship is opportunity-driven, and in an additional 12 of the innovation-driven countries, 60 percent of entrepre-neurship is improvement-driven.
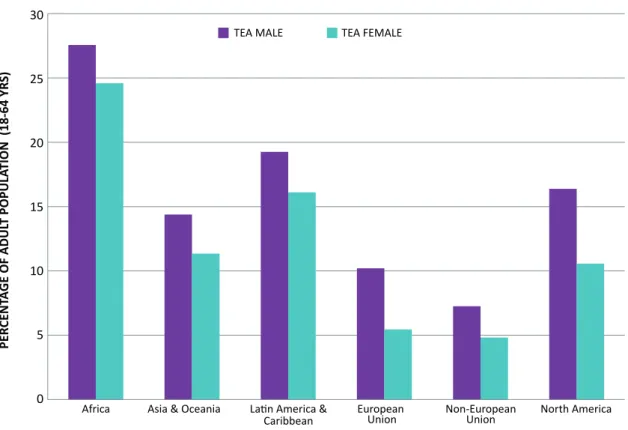
Gender aspects of early-stage entrepreneurial activity
Through the years, GEM has shown that the early stages of entrepreneurial activity among women vary considerably worldwide. These differences between
countries reflect differences in culture and tradition regarding women’s participation in the economy and more general societal perceptions of women’s role in the labour market.
Men generally dominate entrepreneurship in the early stages all over the world (Figure 1.5), but as previous GEM studies have shown, there is no nota-ble difference between women and men in terms of perceived opportunities and capabilities. Only the fear of failure is somewhat higher among women than men.
Another pattern emerges when the motiva-tional reasons for entrepreneurship in the early stages are examined, namely, that in all regions, women’s entrepreneurship is more often necessity-driven than men’s. One group of countries (United Kingdom, India, Iran and Italy) exhibits the oppo-site pattern in that relatively more men start their businesses out of necessity. Furthermore, some countries (Australia, Austria, Denmark, Kazakhstan, Luxembourg, the Netherlands, Singapore, South Africa and Thailand) exhibit a fairly balanced pro-portion of necessity-driven entrepreneurship across genders.
The two countries with the largest differences bet-ween men and women in the proportion of necessity-driven entrepreneurship is Chile, with 27 percent for women, compared with 10 percent for men, and Burkina Faso, with 33 percent for women compared with 13 percent for men.
Table 1.2: Entrepreneurial activity and motivational reasons by level of economic development
Note: TEA is the percentage of the adult population engaged in early stage entrepreneurial activity. Figures are the proportions of TEA that fall within each motivational category.
Factor-driven
economies Effi ciency-driveneconomies Innovati on-driveneconomies
Total Entrepreneurial
Acti vity (TEA) 23 14 9
Necessity-driven entrepreneurship 28 27 18 Opportunity-driven entrepreneurship 69 70 78 Improvement-driven entrepreneurship 47 45 55
15 Introduction to Global Entrepreneurship Monitor and summary of the global results
4. Amorós et al., (2013).
5. Birch, D, (1979); Haltiwanger et al. (2010); Braunerhjelm et al. (2014).
ENTREPRENEURIAL EMPLOYEE ACTIVITY (EEA) Since 2011, GEM has measured employees’ entrepre-neurial activity (EEA) to illustrate how entrepreneur-ship may be channelled between different occupatio-nal choices, implying that employees may also engage in entrepreneurial activities. These different types of entrepreneurship combined, it may be argued, con-stitute an economy’s entrepreneurial capacity. GEM operationalizes employees’ entrepreneurial activity as a situation in which an employee, during the last three years, has actively participated or had a leading role in developing an idea for a new activity or pre-paring and implementing a new activity. The levels of EEA increase along with countries’ levels of economic development; thus, it is highest in innovation-driven economies and lowest in factor-driven economies.
EEA is far less common in the world than TEA, with the largest differences between TEA and EEA found in the African, Latin American and the Caribbean eco-nomies. North America and EU economies have the highest incidence of EEA (Figure 1.6).
ENTREPRENEURIAL AMBITIONS FOR GROWTH, INNOVATION AND INTERNATIONALIZATION
GEM also measures ambitions associated with entrepreneurship. More precisely, ambitions are defined as entrepreneurs’ expected job creation together with their innovation and internationa-lization efforts. These types of entrepreneurial ambitions have been positively linked to economic development.4
Growth ambitions
Growth ambitions of entrepreneurs in the early stages are directly connected to political priorities around the world, i.e., the creation of jobs. Young and small businesses are of particular interest in this respect, and their importance in contributing to job creation is established in the literature.5 GEM mea-sures expected job growth associated with compa-nies by asking early stage entrepreneurs how many employees they expect to hire in the coming five years.
Figure 1.5: Male and female early-stage entrepreneurial activity (TEA) in 2014, by geographic region 30 25 20 15 10 5 0 Africa
TEA MALE TEA FEMALE
Asia & Oceania Latin America &
Caribbean European Union Non-EuropeanUnion North America
PER CENT AGE OF ADUL T POPULA TION (18-64 YR S)
THE ENTREPRENEURIAL CODE – A COMPARATIVE STUDY OF ENTREPRENEURIAL DYNAMICS IN CHINA, EUROPE AND THE U.S. 16
Figure 1.6: Comparison of presence of TEA and EEA in 2014, by geographic regions
Figure 1.7: Expected job growth by geographic region 30 25 20 15 10 5 0 PER CENT AGE OF ADUL T POPULA TION (18-64 YR
S) TEA EEA (Entrepreneurial Employee Activity)
Africa Asia & Oceania Latin America &
Caribbean European Union Non-EuropeanUnion North America
100 90 80 70 60 50 40 30 20 10 0 Job creation expectations: 20 or more jobs Job creation expectations: 5-19 jobs Job creation expectations: 0-5 jobs PER CENT AGE OF TE A
Africa Asia & Oceania Latin America &
17 Introduction to Global Entrepreneurship Monitor and summary of the global results
The figure shows that growth ambitions are parti-cularly strong in North America, where over 20 per-cent of entrepreneurs believe they will employ more than 20 people within five years. The corresponding figure for entrepreneurs in the EU is approximately 15 percent. The lowest growth ambitions are found in Africa, Latin America and the Caribbean.
Innovative orientation
While expectations of job growth and how they are realized constitute a visible effect of entrepreneurship in the short term, innovation is indicative of the long-term prospects of entrepreneurs. Innovation here refers to the Schumpeterian view that new products, services, processes and markets drive the further development of a country.6
GEM measures the innovative orientation of a business from two perspectives (product and mar-ket). The study examines the extent to which entre-preneurial products or services are new to some or
all customers in the market and whether few or no competitors offer the same product or service. It is important to note that this measure is rather con-text-dependent, as some products/services, despite globalization, may be new to internal markets in many economies though already available in other markets. Nevertheless, a high degree of innovation tends to positively impact the economic develop-ment of the country in question.
The North American economies are more inno-vation-oriented than the rest of the world in both respects. Asia and Oceania shows a different pattern of high product innovation but less introduction of products to new markets. The African economies, with the exception of South Africa, exhibit low inno-vative orientation in both respects. The EU countries are on average more innovation-oriented in both dimensions measured by GEM than most other regions (Figure 1.8).
Figure 1.8: Innovative orientation of early-stage entrepreneur (TEA) in 2014, by geographic regions (% of TEA) 70 60 50 40 30 20 10 0 Percentage within TEA: product is new for some or all customers Percentage within TEA:new market (few/no businesses offer the same product) PER CENT AGE OF ADUL T POPULA TION (18-64 YR S)
Africa Asia & Oceania Latin America &
Caribbean European Union Non-EuropeanUnion North America
THE ENTREPRENEURIAL CODE – A COMPARATIVE STUDY OF ENTREPRENEURIAL DYNAMICS IN CHINA, EUROPE AND THE U.S. 18
Internationalization
As globalization proceeds, it becomes increasingly important for new and young firms to penetrate foreign markets. While innovation may pave the way for small and new companies, such firms must also acquire skills to expand into markets for their pro-ducts, particularly for ventures originating in countries with small domestic markets.
The EU countries, with their tradition of internatio-nal trade and geographical proximity to various mar-kets, have the highest percentage of young companies that indicate that at least 25 percent of their custo-mers are located outside their countries. Several small EU countries exhibit the highest degree of internatio-nalization: In Luxembourg, 42 percent of young com-panies have more than 25 percent of their customers abroad, followed by Croatia (38 percent), Belgium (33 percent) and Estonia (24 percent). The same is evident in countries outside the EU, where Kosovo leads with 33 percent, followed by Switzerland with 31 percent. Other small countries, such as Suriname, Singapore and Barbados, also exhibit high internationalization.
The African economies report the least intense internationalization of young businesses (almost 70 percent of entrepreneurs in the early stages entirely lack customers outside their respective countries). The exception is South Africa, where 26 percent of start-up companies have more than 25 percent of their customers abroad.
1.3 SUMMARY OF THE FINDINGS OF THE GLOBAL GEM REPORT 2014
The results of the Global GEM report 2014 confirm many of the findings of previous reports. The least economically developed parts of the world generally exhibit the highest levels of entrepreneurial activity but also the highest levels of entrepreneurship driven by necessity rather than perceived opportunities.
Perceived business opportunities and capabilities to start and run a business are also greatest in these factor- and efficiency-driven countries. The innovative orientation of businesses increases as economic deve-lopment increases. GEM 2014 shows, once again, that there is a considerable gender gap in most countries and that women’s entrepreneurship is more often necessity-driven than men’s.
In the global GEM report, the authors stress the importance that decision-makers understand that dif-ferent types of entrepreneurship coexist (early-stage entrepreneurship, established businesses, employ-ees’ entrepreneurial activities, etc.). Identification and support of these different types of entrepreneurship and recognition, for example, of entrepreneurial acti-vity manifested in established businesses contributes to an improved understanding of a country’s entre-preneurial capacity and potential.
19 Introduction to Global Entrepreneurship Monitor and summary of the global results
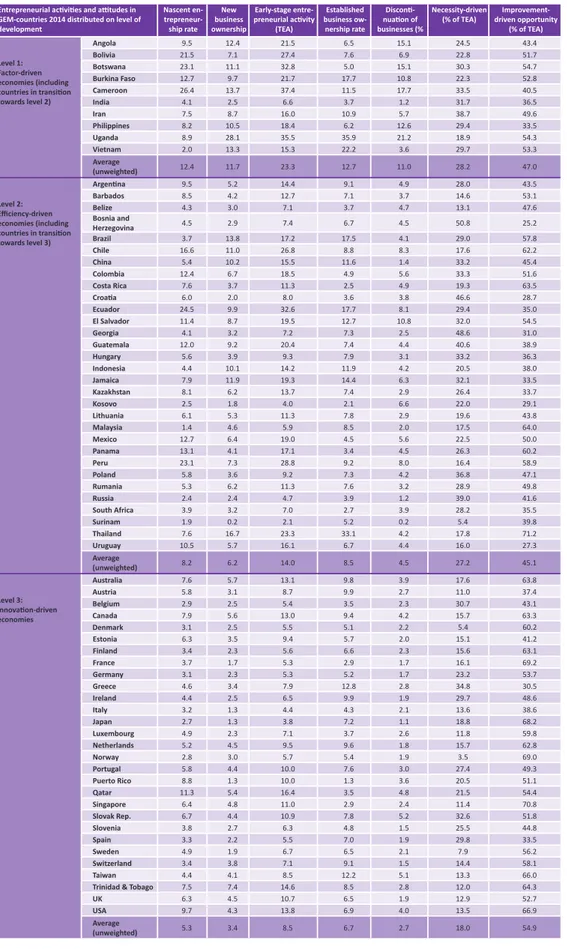
Table 1.3: Entrepreneurial activity in GEM 2014 distributed on level of development Entrepreneurial acti viti es and atti tudes in
GEM-countries 2014 distributed on level of development Nascent en- trepreneur-ship rate New business ownership Early-stage entre-preneurial acti vity
(TEA) Established business ow-nership rate Disconti -nuati on of businesses (% Necessity-driven
(% of TEA) driven opportunity Improvement-(% of TEA) Level 1: Factor-driven economies (including countries in transiti on towards level 2) Angola 9.5 12.4 21.5 6.5 15.1 24.5 43.4 Bolivia 21.5 7.1 27.4 7.6 6.9 22.8 51.7 Botswana 23.1 11.1 32.8 5.0 15.1 30.3 54.7 Burkina Faso 12.7 9.7 21.7 17.7 10.8 22.3 52.8 Cameroon 26.4 13.7 37.4 11.5 17.7 33.5 40.5 India 4.1 2.5 6.6 3.7 1.2 31.7 36.5 Iran 7.5 8.7 16.0 10.9 5.7 38.7 49.6 Philippines 8.2 10.5 18.4 6.2 12.6 29.4 33.5 Uganda 8.9 28.1 35.5 35.9 21.2 18.9 54.3 Vietnam 2.0 13.3 15.3 22.2 3.6 29.7 53.3 Average (unweighted) 12.4 11.7 23.3 12.7 11.0 28.2 47.0 Level 2: Effi ciency-driven economies (including countries in transiti on towards level 3) Argenti na 9.5 5.2 14.4 9.1 4.9 28.0 43.5 Barbados 8.5 4.2 12.7 7.1 3.7 14.6 53.1 Belize 4.3 3.0 7.1 3.7 4.7 13.1 47.6 Bosnia and Herzegovina 4.5 2.9 7.4 6.7 4.5 50.8 25.2 Brazil 3.7 13.8 17.2 17.5 4.1 29.0 57.8 Chile 16.6 11.0 26.8 8.8 8.3 17.6 62.2 China 5.4 10.2 15.5 11.6 1.4 33.2 45.4 Colombia 12.4 6.7 18.5 4.9 5.6 33.3 51.6 Costa Rica 7.6 3.7 11.3 2.5 4.9 19.3 63.5 Croati a 6.0 2.0 8.0 3.6 3.8 46.6 28.7 Ecuador 24.5 9.9 32.6 17.7 8.1 29.4 35.0 El Salvador 11.4 8.7 19.5 12.7 10.8 32.0 54.5 Georgia 4.1 3.2 7.2 7.3 2.5 48.6 31.0 Guatemala 12.0 9.2 20.4 7.4 4.4 40.6 38.9 Hungary 5.6 3.9 9.3 7.9 3.1 33.2 36.3 Indonesia 4.4 10.1 14.2 11.9 4.2 20.5 38.0 Jamaica 7.9 11.9 19.3 14.4 6.3 32.1 33.5 Kazakhstan 8.1 6.2 13.7 7.4 2.9 26.4 33.7 Kosovo 2.5 1.8 4.0 2.1 6.6 22.0 29.1 Lithuania 6.1 5.3 11.3 7.8 2.9 19.6 43.8 Malaysia 1.4 4.6 5.9 8.5 2.0 17.5 64.0 Mexico 12.7 6.4 19.0 4.5 5.6 22.5 50.0 Panama 13.1 4.1 17.1 3.4 4.5 26.3 60.2 Peru 23.1 7.3 28.8 9.2 8.0 16.4 58.9 Poland 5.8 3.6 9.2 7.3 4.2 36.8 47.1 Rumania 5.3 6.2 11.3 7.6 3.2 28.9 49.8 Russia 2.4 2.4 4.7 3.9 1.2 39.0 41.6 South Africa 3.9 3.2 7.0 2.7 3.9 28.2 35.5 Surinam 1.9 0.2 2.1 5.2 0.2 5.4 39.8 Thailand 7.6 16.7 23.3 33.1 4.2 17.8 71.2 Uruguay 10.5 5.7 16.1 6.7 4.4 16.0 27.3 Average (unweighted) 8.2 6.2 14.0 8.5 4.5 27.2 45.1 Level 3: Innovati on-driven economies Australia 7.6 5.7 13.1 9.8 3.9 17.6 63.8 Austria 5.8 3.1 8.7 9.9 2.7 11.0 37.4 Belgium 2.9 2.5 5.4 3.5 2.3 30.7 43.1 Canada 7.9 5.6 13.0 9.4 4.2 15.7 63.3 Denmark 3.1 2.5 5.5 5.1 2.2 5.4 60.2 Estonia 6.3 3.5 9.4 5.7 2.0 15.1 41.2 Finland 3.4 2.3 5.6 6.6 2.3 15.6 63.1 France 3.7 1.7 5.3 2.9 1.7 16.1 69.2 Germany 3.1 2.3 5.3 5.2 1.7 23.2 53.7 Greece 4.6 3.4 7.9 12.8 2.8 34.8 30.5 Ireland 4.4 2.5 6.5 9.9 1.9 29.7 48.6 Italy 3.2 1.3 4.4 4.3 2.1 13.6 38.6 Japan 2.7 1.3 3.8 7.2 1.1 18.8 68.2 Luxembourg 4.9 2.3 7.1 3.7 2.6 11.8 59.8 Netherlands 5.2 4.5 9.5 9.6 1.8 15.7 62.8 Norway 2.8 3.0 5.7 5.4 1.9 3.5 69.0 Portugal 5.8 4.4 10.0 7.6 3.0 27.4 49.3 Puerto Rico 8.8 1.3 10.0 1.3 3.6 20.5 51.1 Qatar 11.3 5.4 16.4 3.5 4.8 21.5 54.4 Singapore 6.4 4.8 11.0 2.9 2.4 11.4 70.8 Slovak Rep. 6.7 4.4 10.9 7.8 5.2 32.6 51.8 Slovenia 3.8 2.7 6.3 4.8 1.5 25.5 44.8 Spain 3.3 2.2 5.5 7.0 1.9 29.8 33.5 Sweden 4.9 1.9 6.7 6.5 2.1 7.9 56.2 Switzerland 3.4 3.8 7.1 9.1 1.5 14.4 58.1 Taiwan 4.4 4.1 8.5 12.2 5.1 13.3 66.0
Trinidad & Tobago 7.5 7.4 14.6 8.5 2.8 12.0 64.3
UK 6.3 4.5 10.7 6.5 1.9 12.9 52.7
USA 9.7 4.3 13.8 6.9 4.0 13.5 66.9
Average
2
A CROSS-COUNTRY ANALYSIS OF ENTREPRENEURIAL
ACTIVITY, AMBITION AND ATTITUDES
7Chapter 2 contains three sections based on the GEM’s classification of entrepreneurship on entre-preneurial activities, entreentre-preneurial ambitions and societal attitudes towards entrepreneurship. Our comparison involves seven countries (China, France, Germany, Italy, UK, USA and Sweden) and two coun-try groups – small EU-countries (Belgium, Ireland and the Netherlands) and the Nordic countries (Denmark, Finland and Norway but not Sweden).
These countries form the basis for international comparisons when we examine entrepreneurial activity in section 2.1 (level, types, gender, age and industry composition, etc.) and entrepreneurial attitudes in section 2.3 (intention, perceived opp-ortunities and capabilities, fear of failure, career choice, etc.). When examining entrepreneurial ambitions (employment growth, market position, innovation and internationalization), all innovation-driven economies are included in the analysis.
Time series running from 2002 to 2014 will be presented for most of the variables presented below. In addition to comparing rates of indivi-dual participation across countries, we will present details of the various phases of entrepreneurship:
potential entrepreneurs, individuals who intend to found businesses, early-stage entrepreneurs who are starting and running new businesses and owners of established businesses.
2.1 ENTREPRENEURIAL ACTIVITY ENTREPRENEURIAL LEVEL
We distinguish between individuals in the process of starting a business (i.e., nascent entrepreneurship, 0–3 months old), those operating a new business that is older than three months but younger than 3.5 years (new business ownership), and those operating an established business (older than 3.5 years). The nascent entrepreneurship rate and the new business ownership rate together account for total early-stage entrepreneurial activity (TEA) within an economy.
Figure 2.1 compares TEA for seven countries and two groups of countries that participated in the GEM between 2002 and 2014. It is clear that TEA rates vary between three categories of eco-nomies with higher average levels of entrepre-neurial activity observed for the Anglo-Saxon countries together with China, followed by smaller
THE ENTREPRENEURIAL CODE – A COMPARATIVE STUDY OF ENTREPRENEURIAL DYNAMICS IN CHINA, EUROPE AND THE U.S. 22
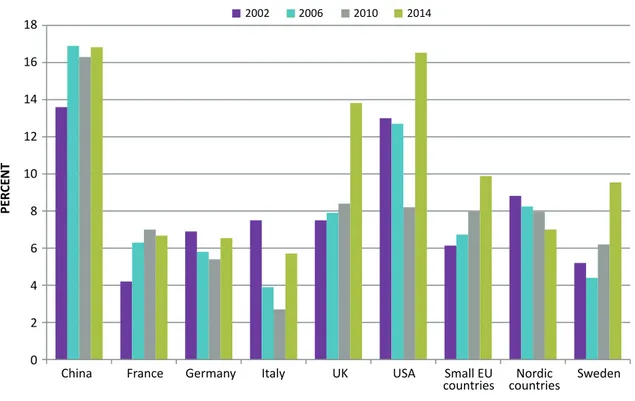
Figure 2.1: Total early-stage entrepreneurial activity (TEA)
Percentage of 18–64 year olds in population who are either nascent entrepreneurs or owner-managers of new businesses
Note: Small EU-countries comprise Belgium, Ireland and the Netherlands; Nordic countries comprise Denmark, Finland and Norway.
EU-countries, the Nordic countries and Sweden. The larger EU-economies report somewhat lower levels of entrepreneurial activity. Note that several countries appear to have embarked on an entre-preneurial path over this time period: in particular, entrepreneurship is increasing in the UK but also in France, Sweden and other small EU-countries.8 We will return to possible explanations of this develop-ment below. Another conspicuous feature is that the U.S. entrepreneurial level (almost 14 percent) is about twice that of the EU-countries. Moreover, China is basically on par with the U.S.
Turning to the earliest stage of entrepreneurship – nascent entrepreneurship – the U.S. dominates with almost 10 percent of the adult population in 2014 involved in setting up a business (Figure 2.2). The UK ranks second, while Sweden, a traditional welfare state, is in fourth place, just after China. We observe a notable increase in nascent entrepre-neurship in the U.S., the UK, Sweden and, to some extent, other small EU-countries.
Nascent entrepreneurship is important, as it captures the extent to which countries are engaged in market experiments that may generate new and growing firms. Nevertheless, the underlying reasons may dif-fer between countries, as may the societal impact, depending on whether entrepreneurial endeavours are undertaken because institutions are conducive to start-ups or because various support structures sub-sidize entrepreneurial activities. These two need not conflict with each other, but it is important to identify the drivers of entrepreneurial activity to understand the underlying dynamics.
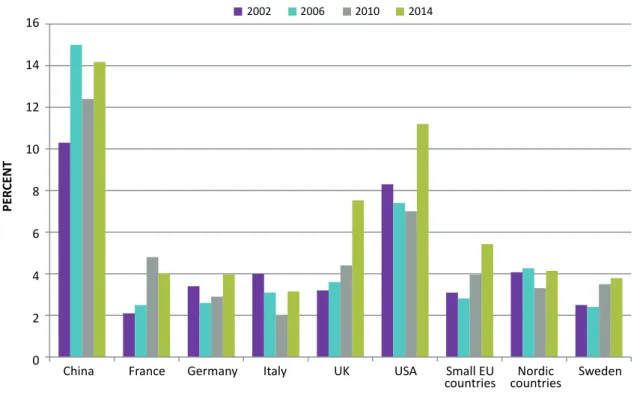
The next stage of entrepreneurial activity concerns new business ownership rates (young firms between 3–42 months old). According to Figure 2.3, the picture is much more compressed when we consider new busi-nesses. Disregarding China, the U.S. reports the highest shares of the adult population running new firms.9 However, the share in the U.S. has decreased somewhat over the years and also appears to have shrunk consi-derably during the economic crisis that started in 2008.
2002 2006 2010 2014 PER CENT 18 16 14 12 10 8 6 4 2 0
China France Germany Italy UK USA Small EU Sweden
countries countriesNordic
8. Sweden did however experience an unprecedented decline between 2013 and 2014 (1,5 percentage points), including nascent entrepreneurship and new business ownership. Female entrepreneurship declined with more than two percentage points.
9. Data for entrepreneurial activity in China is overall surprisingly high but may reflect the opening up of a formally closed economy and (overoptimistic) attempts to exploit conceived business opportunities.
23 A cross-country analysis of entrepreneurial activity, ambition and attitudes
Figure 2.2: Nascent entrepreneurship rate
Percentage of the 18–64 year old population who are currently nascent entrepreneurs, i.e., actively involved in setting up businesses they will own or co-own; such a business has not paid salaries or wages or made any other payments to the owners for more than three months.
Note Figure 2.2 and 2.3: Small EU-countries comprise Belgium, Ireland and the Netherlands; Nordic countries comprise Denmark, Finland and Norway.
2002 2006 2010 2014 PER CENT 12 10 8 6 4 2 0
China France Germany Italy UK USA Small EU Sweden
countries countriesNordic Figure 2.3: New business ownership rate
Percentage of 18–64 year old population who are currently owner-managers of new businesses, i.e., run businesses that have paid salaries or wages or made any other payments to owners for more than three months but not more than 42 months
2002 2006 2010 2014 PER CENT 14 12 10 8 6 4 2 0
China France Germany Italy UK USA Small EU Sweden
THE ENTREPRENEURIAL CODE – A COMPARATIVE STUDY OF ENTREPRENEURIAL DYNAMICS IN CHINA, EUROPE AND THE U.S. 24
Note: Small EU-countries comprise Belgium, Ireland and the Netherlands; Nordic countries comprise Denmark, Finland and Norway. Figure 2.4: Informal investors rate
Percentage of 18–64 year old population that has personally provided funds for a new business started by someone else in the past three years
The pattern varies across countries. The UK and small EU-countries display the most pronounced increase over the studied time period. The low levels in larger EU-countries are noteworthy, particularly, the decline in traditional small business economies, such as Italy. FUNDING
A critically important precondition for starting a new firm is access to capital. The GEM provides data on the share of the adult population involved in funding new businesses – often referred to as fools, friends and family. Figure 2.4 reveals some interesting findings. First, Sweden turns out to be among the countries with the largest share of informal investors. Indeed, in 2010, Sweden had a higher share than any other country. Together with the U.S. and to some extent China, Sweden stands out as best endowed with early-stage funding individuals. This may explain Sweden’s high and increasing share of nascent entrepreneurs. Second, the crisis that started in 2008 does not appear to have deprived countries of their informal investors. Rather, informal investors increased in a number of countries between 2006 (before the crisis) and 2010
(in the midst of the crisis), and for some, it has conti-nued to increase through 2014.
ENTREPRENEURIAL MOTIVE – NECESSITY OR OPPORTUNITY
A key difference in the character of entrepreneurship can be observed by comparing the primary motiva-tions of entrepreneurs. On the one hand, entrepre-neurs may be pushed into starting a business out of necessity because they have no other work options and require a source of income – necessity-driven entrepreneurship. On the other hand, they may be pulled into starting businesses because they recog-nize lucrative business opportunities and choose to pursue them – opportunity-driven entrepreneurship. Entrepreneurs in innovation-driven economies tend to be primarily driven by opportunity-motivated entrepreneurship.
Figures 2.5a and 2.5b clearly illustrate this distin-ction. Most countries are predominantly characte-rized by opportunity-driven entrepreneurship, the exception being China. As economies become richer and more developed, the share of necessity-driven
2002 2006 2010 2014 PER CENT 10 9 8 7 6 5 4 3 2 1 0
China France Germany Italy UK USA Small EU Sweden
25 A cross-country analysis of entrepreneurial activity, ambition and attitudes
Note Figure 2.5 a and b: Small EU-countries comprise Belgium, Ireland and the Netherlands; Nordic countries comprise Denmark, Finland and Norway. Figure 2.5a: Necessity-driven entrepreneurial activity: relative prevalence
Percentage of those involved in TEA because they have no other work options
2002 2006 2010 2014 PER CENT 60 50 40 30 20 10 0
China France Germany Italy UK USA Small EU Sweden
countries countriesNordic Figure 2.5b: Opportunity-driven entrepreneurial activity: relative prevalence
Percentage of those involved in TEA because they identified business opportunities
2002 2006 2010 2014 PER CENT 100 90 80 70 60 50 40 30 20 10 0
China France Germany Italy UK USA Small EU Sweden
THE ENTREPRENEURIAL CODE – A COMPARATIVE STUDY OF ENTREPRENEURIAL DYNAMICS IN CHINA, EUROPE AND THE U.S. 26
Figure 2.6a: Total early-stage entrepreneurial activity for male working age population
Percentage of male 18–64 year old population who are either nascent entrepreneurs or owner-managers of new businesses
Note: Small EU-countries comprise Belgium, Ireland and the Netherlands; Nordic countries comprise Denmark, Finland and Norway.
entrepreneurship normally falls. In 2014, between 70–80 percent of entrepreneurship is related to busi-ness opportunities in the eight innovation-driven economies, whereas it has risen from approximately 45 percent in 2002 to 65 percent in 2014 in China, i.e., not far behind the more developed economies. There has, however, been a trend-wise fall in smaller EU-economies since 2006 (but from high levels).
Moreover, the crisis appears to have increased the share of necessity-based entrepreneurship, judging from the increase in 2010, particularly in the U.S. The smallest share is reported for the Nordic countries and Sweden, both having shares of approximately 8–9 per-cent that can be attributed necessity-driven entrepre-neurship. In France and Germany, this kind of new firm formation has decreased by approximately 50 percent since 2006, albeit the shares are still considerably hig-her than in the othig-her six innovation economies.
Each of these two types of entrepreneurship is important for economic development, but we expect opportunity-based entrepreneurship to be more
strongly associated with productivity and growth effects (Fritsch and Schroeder 2011; Lamballais, Tessensohn and Thurik, 2012).
THE GENDER GAP
Figures 2.6a and 2.6b present the TEA rate for the male and female adult population. The rankings in Figure 2.6a basically mimic the overall TEA rate shown in Figure 2.1, but the shares are higher if we restrict the analysis to men. In the corresponding graph for women, it is clear that countries characterized by strong entrepreneurial performance in general also exhibit strong entrepreneurial performance among women (Figure 2.6b). Among developed econo-mies, the U.S. and UK are far ahead of the remaining countries but still trail China.
The female TEA prevalence rate further reveals that most countries exhibit a substantial gender gap in entrepreneurship (Figure 2.7), with the share of women entrepreneurs approximately 50 percent that of males in most countries. Sweden is shown to have
2002 2006 2010 2014 PER CENT 18 16 14 12 10 8 6 4 2 0
China France Germany Italy UK USA Small EU Sweden
27 A cross-country analysis of entrepreneurial activity, ambition and attitudes
Figure 2.6b: Total early-stage entrepreneurial activity for female working age population
Percentage of female 18–64 year old population who are either nascent entrepreneurs or owner-managers of new businesses
Note Figure 2.6b and 2.7: Small EU-countries comprise Belgium, Ireland and the Netherlands; Nordic countries comprise Denmark, Finland and Norway.
2002 2006 2010 2014 PER CENT 16 14 12 10 8 6 4 2 0
China France Germany Italy UK USA Small EU Sweden
countries countriesNordic Figure 2.7: Total early-stage entrepreneurial activity, number of females per male
2002 2006 2010 2014 RA TIO 1,0 0,9 0,8 0,7 0,6 0,5 0,4 0,3 0,2 0,1 0,0
China France Germany Italy UK USA Small EU Sweden
THE ENTREPRENEURIAL CODE – A COMPARATIVE STUDY OF ENTREPRENEURIAL DYNAMICS IN CHINA, EUROPE AND THE U.S. 28
Note: Small EU-countries comprise Belgium, Ireland and the Netherlands; Nordic countries comprise Denmark, Finland and Norway. Figure 2.8: Established business ownership rate
Percentage of 18–64 year old population who are currently owner-managers of established businesses, i.e., run businesses that have paid salaries or wages or made any other payments to owners for more than 42 months
experienced a large drop in women’s entrepreneur-ship in 2014.
ESTABLISHED BUSINESSES
With respect to established business ownership, we can observe in Figure 2.8 that in a surprisingly large number of countries, the share of the adult popu-lation running a firm older than 3.5 years is in the range of 6.0–7.5 percent. China is again an outlier, having a rate of approximately 12 percent, which corroborates previous findings regarding the rela-tionship between stage of economic development and number of firms.
INDUSTRY AND AGE COMPOSITION OF ENTREPRENEURSHIP
The distribution of early-stage entrepreneurs (TEA) by industry is shown in Figure 2.9. Among innovation-dri-ven economies, Germany, the U.S. and Sweden have the largest shares of TEA in the service sector. While Sweden has a considerably smaller share of start-ups
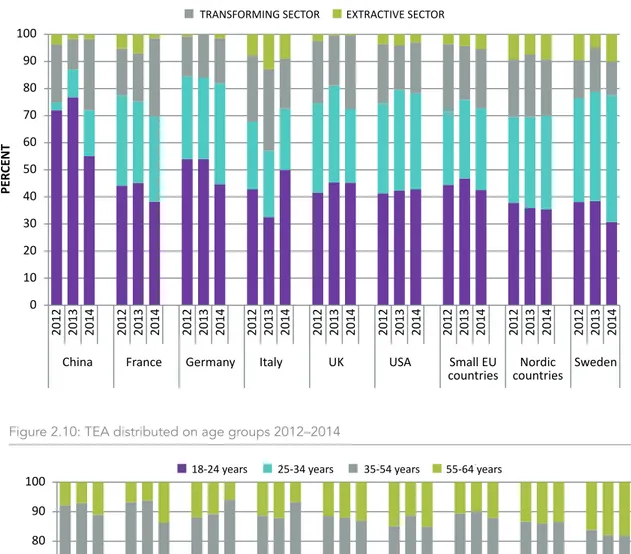
in the consumer-oriented part of the service sector, this share is largest in Germany and Italy. Sectoral differences are relatively small between countries. Again, China deviates from the general pattern, with a considerable share of entrepreneurial ventures taking place in the consumption-oriented service sec-tor while having a tiny but growing business service sector.
The final figure in the entrepreneurial activity sec-tion focuses on the age distribusec-tion of entrepreneurs. As shown in Figure 2.10, approximately 35–40 per-cent of early-stage entrepreneurship occurs among the age cohorts 18–24 and 24–35. For all countries, entrepreneurship, however, is most common among individuals of mid-career ages, i.e., the age cohort 35–54. There are signs of entrepreneurship becoming more prevalent among the more elderly (55–64), particularly in France, the UK, the U.S. and Sweden. However, this share is quite low, somewhere between 13–18 percent in 2014. 2002 2006 2010 2014 PER CENT 16 14 12 10 8 6 4 2 0
China France Germany Italy UK USA Small EU Sweden
29 A cross-country analysis of entrepreneurial activity, ambition and attitudes
Note Figure 2.9 and 2.10: Small EU-countries comprise Belgium, Ireland and the Netherlands; Nordic countries comprise Denmark, Finland and Norway. Figure 2.9: TEA distributed on sectors 2012–2014
PER CENT 100 90 80 70 60 50 40 30 20 10 0 China 2012 2013 2014 2012 2013 2014 2012 2013 2014 2012 2013 2014 2012 2013 2014 2012 2013 2014 2012 2013 2014 2012 2013 2014 2012 2013 2014
CONSUMER ORIENTED SERVICES BUSINESS ORIENTED SERVICES TRANSFORMING SECTOR EXTRACTIVE SECTOR
France Germany Italy UK USA Small EU Sweden
countries countriesNordic
Figure 2.10: TEA distributed on age groups 2012–2014
PER CENT 100 90 80 70 60 50 40 30 20 10 0 China 2012 2013 2014 2012 2013 2014 2012 2013 2014 2012 2013 2014 2012 2013 2014 2012 2013 2014 2012 2013 2014 2012 2013 2014 2012 2013 2014
18-24 years 25-34 years 35-54 years 55-64 years
France Germany Italy UK USA Small EU Sweden
THE ENTREPRENEURIAL CODE – A COMPARATIVE STUDY OF ENTREPRENEURIAL DYNAMICS IN CHINA, EUROPE AND THE U.S. 30
Figure 2.11: Entrepreneurial employee activity (EEA)
Percentage of population 18–64 years old that, in the last three years, actively managed and developed new activities for his or her employer
Note: Small EU-countries comprise Belgium, Ireland and the Netherlands; Nordic countries comprise Denmark, Finland and Norway.
PER CENT 14 12 10 8 6 4 2 0 Italy Gr eece Japan Trinidad & T obag o Puert o Ric o Spain Portug al Es tonia France German y
Finland Slovenia Canada
Sing apor e Slo vakia Belgium Aus tria Sw eden Switz erland Small EU c oun tries USA Ireland Ne therlands Unit ed King dom Lux embour g Taiw an N or w ay Nor dic c oun tries Aus tr alia Denmark Qa tar
INTRAPRENEURSHIP – ENTREPRENEURIAL EMPLOYEES Entrepreneurship materializes not only in the form of new and young firms but is also an ongoing continu-ous process in incumbent firms. For example, many of Sweden’s multinational and successful firms today were founded about a century ago, and their ability to reinvent themselves and maintain international competitiveness largely rests on the contributions of their employees to innovativeness and efficiency. This is often referred to as corporate entrepreneurship or intrapreneurship.
Figure 2.11 depicts the shares of employees in incumbents that define themselves as entrepreneu-rial employees, i.e., as involved in entrepreneuentrepreneu-rial and innovative tasks. They can be defined as intrapre-neurs. Note that the Nordic countries are ranked high – Denmark reports the second largest share of intra-preneurs, while Norway holds the fourth position. Finland is ranked considerably lower, while Sweden
belongs to the middle group of countries with respect to intrapreneurship. Several Anglo-Saxon countries can also be found in the top segment in terms of intrapreneurship.
On average, approximately eight percent of the adult population in Nordic countries reports being involved in intrapreneurship, which can be compared to the share claiming to be involved in entrepreneur-ship, which is considerably lower (approximately 5.5 percent; see Figure 2.1). The corresponding shares for Sweden are six percent (intrapreneurship) and just above six percent (TEA), respectively. Within small EU-countries, the share of intrapreneurship is slightly above six percent, which is about one percentage point smaller than the share of the population that is in the process of starting or running a young com-pany. Large EU-countries rank on average below smal-ler EU-countries with regard to both intrapreneurship (four percent) and entrepreneurship, having a TEA
31 A cross-country analysis of entrepreneurial activity, ambition and attitudes
Figure 2.12: Job growth expectations for early-stage entrepreneurs, 2012–2014
Share of TEA where entrepreneurs expect to hire 20 or more employees within five years
Note: Small EU-countries comprise Belgium, Ireland and the Netherlands; Nordic countries comprise Denmark, Finland and Norway.
PER CENT 30 25 20 15 10 5 0 Gr eece Spain Switz erland Italy Norw ay Ne therlands Belgium Small EU-c oun trie s Es tonia Sw eden Portug al Nor dic c oun tries Finland France Trinidad & T obag o UK German y Slo venia Ireland Slo vak R epublic U SA Japan Sing apor e Taiw an
of six percent. It is noteworthy that the U.S. deviates markedly from European countries, where the share of the population involved in entrepreneurship (14 percent) is more than twice the share that defines themselves as intrapreneurs (around six percent).
Consequently, it appears that the way that entre-preneurship materializes depends on the institutional framework – laws, regulations and traditions – where traditional welfare states, such as the Nordic countries and Sweden, with stricter labour market regulations for permanent employees and tighter social security safety nets, result in relatively larger shares of intrapreneurship. 2.2 ENTREPRENEURIAL AMBITIONS – GROWTH, INNOVATION AND INTERNATIONALIZATION
How new firms and businesses impact the national economy depends on the institutional framework that surrounds the activities of incumbents and entre-preneurs. This section profiles the potential impact of
entrepreneurship by examining the perceived i) job-creation potential of businesses, ii) market position, iii) innovativeness and iv) internationalization, measu-red by the share of customers abroad..
In this section, we will present data for all countries defined as innovation-driven, based on data for the last available year (2014) and averages for the last three years.
JOB GROWTH EXPECTATIONS
Growth expectations measure how many employees entrepreneurs expect to employ in the coming five years. Previous research has shown that growth expec-tations are a workable indicator of later growth per-formance by firms (Davidsson et al., 2012). In Figure 2.12, average growth expectations are presented for new and young firms expecting to hire more than 20 employees in the coming five-year period (high growth expectations). High-growth firms, or gazelles, have been shown to account for a disproportionate share
THE ENTREPRENEURIAL CODE – A COMPARATIVE STUDY OF ENTREPRENEURIAL DYNAMICS IN CHINA, EUROPE AND THE U.S. 32
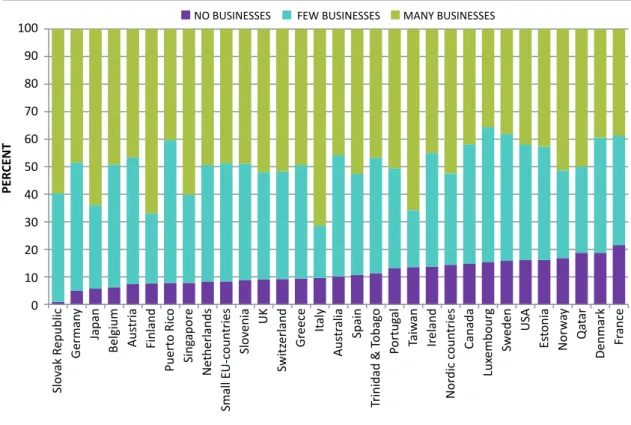
Figure 2.13a: Competition 2014
How many businesses offer the same product? Share of TEA
Note: Small EU-countries comprise Belgium, Ireland and the Netherlands; Nordic countries comprise Denmark, Finland and Norway.
PER CENT 100 90 80 70 60 50 40 30 20 10 0 Slo vak R epublic German y Japan Belgium Aus tria Finland Puert o Ric o Sing apor e Ne therlands Small EU-c oun tries Slo venia UK Switz
erland Greece Italy
Aus tr alia Spain Trinidad & T obag o Portug al Taiw an Ireland Nor dic c oun tries Canada Lux embour g Sw eden USA Es tonia N or w ay Qa tar Denmark Fr ance
NO BUSINESSES FEW BUSINESSES MANY BUSINESSES
of new employees and are consequently important for future growth (Henrekson and Johansson, 2010).
The most growth oriented nations report shares of TEA that exceed 15 percent, whereas the share of those at the other end of the spectrum is approxima-tely 3–5 percent. Countries with low growth expecta-tions have either been severely hurt by the economic crisis (e.g., Greece, Spain and Italy) or can be found among smaller countries and often belong to the group of welfare countries (Norway, the Netherlands and Sweden).10 Asian countries, some Anglo-Saxon countries and several Eastern European countries dominate the top performers.
MARKET CONDITIONS AND INNOVATIVENESS When asked about market conditions facing entrepre-neurs, all countries (except France) report that more than 80 percent of the entrepreneurs have at least a few competitors and about 50 percent are competing with many other firms in 2014 (Figure 2.13a). This
suggests that most entrepreneurship has an imita-tive character. Countries that report relaimita-tively large shares of entrepreneurs who face no competition are not necessarily characterized by high levels of inno-vativeness, as competition is highly contingent upon institutions and the extent to which competition is supported.
The data vary somewhat over the years. When the results are based on averages over the last three years, the shares remains more or less intact, but the position of the respective country may change (Figure 2.13b). For instance, France was shown to have a pole position in 2014, but when we implement averages for the last three years, France’s position falls conside-rably (eight out of 22 countries).
Market position is thus not necessarily associa-ted with innovativeness. Introducing new products or services into the market, thereby fostering pro-duct variety for customers and contributing to natio-nal competitiveness, is vital to growth and often
33 A cross-country analysis of entrepreneurial activity, ambition and attitudes
Figure 2.13b: Competition 2012–2014
How many businesses offer the same product? Share of TEA
Note: Small EU-countries comprise Belgium, Ireland and the Netherlands; Nordic countries comprise Denmark, Finland and Norway.
PER CENT 70 60 50 40 30 20 10 0 Japan Taiw an Italy Finland Slo vak R epublic Sing apor e Gr eece Trinidad & T obag o Nor dic c oun tries N or w ay Ne therlands Spain Belgium German y Small EU-c oun tries Switz erland Portug al Sw eden UK Slo
venia France Ireland
Es
tonia USA
NO BUSINESSES FEW BUSINESSES
attributed entrepreneurs, being the agents of change that introduce radical and disruptive innovations.
Complementing the above information about com-petitors, to capture novelty, GEM asks entrepreneurs whether their product or service is new to some or all their customers. Figure 2.14a reveals that a somewhat larger number of countries claim that their entrepre-neurs have developed innovative products that are new to all customers in 2014. Accordingly, in Taiwan, 50 percent of entrepreneurs launch products that are new to all customers, followed by six other countries reporting a share above 20 percent. Note that only 14 percent of Taiwanese firms said that no other busi-nesses offered the same product (Figure 2.13a), indi-cating that they operate in different markets or that they overstate their innovative capabilities. Smaller EU-countries and the Nordic countries rank fairly high when asked to estimate their innovativeness.
Taking three-year averages, the ranking does not change considerably, suggesting that innovation
performance does not change substantially over the years. Note, however, that the ranking in Figure 2.14b is based on countries where the product is new to at least some customers, whereas a stricter version (new to all customers) is applied in Figure 2.14a.
INTERNATIONALIZATION
Internationalization measures the extent to which early-stage entrepreneurs sell to customers outside their domestic markets. In general, serving interna-tional markets signals both high ambition and inter-national competitiveness of a country’s early stage entrepreneurs. As shown in Figure 2.15a, in 11 of the 29 countries, approximately 50 percent of new and young firms have no sales at all outside their domes-tic markets. And only in five countries does the share of entrepreneurs with more than 25 percent of their customers abroad exceed 30 percent. Hence, the degree of internationalization, overall, is quite low in the group of new and young firms (TEA).
THE ENTREPRENEURIAL CODE – A COMPARATIVE STUDY OF ENTREPRENEURIAL DYNAMICS IN CHINA, EUROPE AND THE U.S. 34
Figure 2.14a: Innovative products for early-stage entrepreneurs 2014
Share of TEA whose products are new to …
Figure 2.14b: Innovative products for early-stage entrepreneurs 2012–2014
Share of TEA whose products are new to …
Note Figure 14a and b: Small EU-countries comprise Belgium, Ireland and the Netherlands; Nordic countries comprise Denmark, Finland and Norway.
PER CENT 100 90 80 70 60 50 40 30 20 10 0 Japan Trinidad & T obag o UK N or w ay Portug al Aus tria Puert o Ric o Finland German y Gr eece Slo vak R
epublic Sweden Belgium Spain Austr
alia Ireland Switz erland Estonia Nor dic c oun tries Sing apor e Lux embour g U SA Canada Small EU-c oun tries Slo venia Qatar Ne therlands Fr ance Denmark Italy Taiw an
... ALL CUSTOMERS ... SOME CUSTOMERS ... NO CUSTOMERS
PER CENT 80 70 60 50 40 30 20 10 0 Trinidad & T obag o N or w ay UK Spain German y Portug al Gr eece Ne therlands Sing apor e Sw eden Switz erland Nor dic c oun tries Finland Small EU-c oun tries Belgium U SA
Ireland Estonia Japan Slovenia France
Slo
vak R
epublic Taiw
an
Italy
35 A cross-country analysis of entrepreneurial activity, ambition and attitudes
Figure 2.15a: International orientation for early-stage entrepreneurs 2014
TEA distributed on share of customers abroad
PER CENT 100 90 80 70 60 50 40 30 20 10 0 Lux embour g Slo vak R epublic U SA Aus tr alia Canada Sing apor e Portug al
Belgium Slovenia
Switz
erland Estonia Sweden Austria France Ireland
Small EU-c oun tries Gr eece German y Qa tar Ne therlands Italy Taiw an Finland Puert o Ric o UK Trinidad & T obag o Nor dic c oun tries N or w ay Spain Denmark Japan 1-25 PERCENT
0 PERCENT 25-75 PERCENT 75-100 PERCENT
Figure 2.15b: International orientation for early-stage entrepreneurs 2012–2014
TEA distributed on share of customers abroad
Note Figure 2.15a and b: Small EU-countries comprise Belgium, Ireland and the Netherlands; Nordic countries comprise Denmark, Finland and Norway.
PER CENT 100 90 80 70 60 50 40 30 20 10 0 Spain N or w ay Trinidad & T obag o Nor dic c oun tries Finland UK Italy Japan Ne therlands Taiw an Gr eece Sw eden German y Small EU-c oun tries Fr ance
Ireland Belgium Estonia Slovenia Portug
al Switz erland Slo vak R epublic U SA Sing apor e