SKI Report 02:55
Research
Experimantal Validation of UTDefect:
Scattering in Anisotropic Media and Near-field Behavior
Claudio Pecorari
November 2002
The SKI perspective
Background
A computer program UTDefect and a mathematical model behind it have been developed by the researches from CTH for almost a decade. The development efforts have been supported by SKI; SKI believes that the above program has a great potential and can be used for NDT qualification purposes and for training of NDT personnel. Obviously, the program can not be used as intended until the theoretical model is thoroughly validated. Though some initial efforts to validate the theory have been carried out at 90s, the further validation efforts are needed.
SKI goal
The goal of this research has been the experimental validation of two aspects of the model that have not yet been tested: the scattering in anisotropic media and the near-field behaviour.
Results
The experimental results were compared to theoretical predictions; a reasonable agreement was found.
Further research
Further efforts are needed to validate the aspects of the model that have not yet been validated.
Effect on SKI activity
After the program has been validated in all significant parts, it can be used for NDT
qualification purposes and for training of NDT personnel. This can reduce the qualification costs.
Project information
SKI project manager: Elena Österberg Project number: 01212
SKI Report 02:55
Research
Experimantal Validation of UTDefect:
Scattering in Anisotropic Media and Near-field Behavior
Claudio Pecorari
MWL
Department of Vehicle Engineering
Royal University of Technology
SE-100 44 Stockholm
Sweden
November 2002
This report concerns a study which has been conducted for the Swedish Nuclear Power Inspectorate (SKI). The conclusions and viewpoints presented in the report are
Table of Content
Summary ... 3
Sammanfattning ... 4
1 Introduction ... 5
2 Scattering by a strip-like crack in an anisotropic material ... 5
2.1 Background ... 5
2.2 Sample description ... 5
2.3 Experimental set-up ... 6
2.4 Results... 7
2.4.1 Position of the crack ... 7
2.4.2 Spectrum of the backscattered signal ... 10
3 Near-field behaviour of an ultrasonic beam... 11
3.1 Background ... 11 3.2 Sample description ... 12 3.3 Experimental set-up ... 12 3.4 Results... 12 4 Conclusions ... 13 5 Acknowledgements ... 14 6 References... 14
Summary
Theoretical models that simulate measurements of ultrasonic waves undergoing scattering by material defects have been developed by Prof. Anders Boström and co-workers at Chalmers Tekniska Högskolan for a variety of experimental configurations and defects. A software program named UTDefect has been developed at the same time, which gathers the theoretical results obtained so far in a single package. A discussion of the motivations behind such an effort and details concerning UTDefect can be found in Boström (1997 and 2000).
Following an initial effort to validate some of the theoretical predictions available at the time (see Eriksson et al., 1997), the present project has been conceived as a support to the on-going theoretical work. In fact, the goal of the project described in this report has been the experimental validation of two aspects of the above theory that have not yet been tested: the scattering of a finite ultrasonic beam by a surface-breaking crack in an anisotropic medium, and an improved model of the behaviour of a finite ultrasonic beam in the near-field region of the source. In the last case, the supporting medium is supposed to be isotropic.
To carry out the first task, a single crystal, silicon sample was employed. A surface-breaking notch with a depth of approximately 1.8 mm was introduced by means of a wire-cutting saw to simulate a scattering defect. Two kinds of measurements were performed of this sample. The first one considered the signal amplitude as a function of the transducer position. To this end, three wedges generating beams propagating in different directions were used. The second series of measurements concerned the frequency content of the backscattered signals at the position where the amplitude was maximum. All three wedges mentioned above were used also in this part of the work. The experimental results were compared to the values of the physical quantities of interest as predicted by UTDefect, with the only difference that UTDefect was run for a sub-surface rectangular crack instead of a strip-like, surface-breaking crack. Though differences between the theoretical predictions and the experimental results were found, they could be explained in terms of the high sensitivity of the measured quantities to the uncertainties associated to the orientation of the crystallographic axes of the material. Such a high sensitivity of the scattered waves to the axes orientation cast reasonable doubt on whether the position of crack can be accurately deduced from ultrasonic measurements if the anisotropic structure of the material is not known within a very high degree of precision.
To carry out the second task, a series of 19 steel samples of different thickness were prepared. The thickness range and transducer frequency were chosen so that the path travelled by the beam upon reflection from the back surface of each sample spanned the near-field region of the transducer. For each sample the amplitude of the component at 5 MHz was measured three times. Such an experimental configuration was simulated by considering the backscattering of an incident beam of longitudinal waves by a large crack with stress-free surfaces. Even in this case, a reasonable agreement between theory and experiment was found, with the maximum difference between the two of the order of 10 percent at a distance of 0.5 near-field lengths from the transducers.
4
Sammanfattning
Prof. Anders Boström med kollegor från Chalmers Tekniska Högskolan har utvecklat en teoretisk modell som simulerar ultraljudprovning av defekter för olika defekttyper och experimentella konfigurationer. Datorprogrammet UTDefect utvecklades samtidigt. Motivering av detta arbete och detaljerad beskrivning av UTDefect finns i Boström (1997 och 2000).
Avsikten med föreliggande projekt har varit att bygga vidare på de initiala försöken att validera vissa teoretiska förutsägelser (Erikson 1997) och därmed fungera som ett stöd för det pågående teoretiska arbetet. Målsättningen med projektet har varit en
experimentell validering av två hittills icke validerade aspekter hos modellen: spridningsproblemet för en ytbrytande spricka i en anisotrop komponent, samt en nyutvecklad modell av ett närfält. I det sista fallet är komponenten isotrop. För det första delmålet användes ett testblock av kisel monokristall. I blocket introducerades en ytbrytande 1.8 mm djup notch. Två olika mätserier utfördes på
testblocket. Den första mätserien studerade amplituden hos signalsvaret som funktion av positionen på ultraljudsökaren. Tre olika sökarhållare användes för att skicka in
ultraljudet under varierande vinklar. Den andra mätserien studerade frekvensinnehållet i den erhållna signalen för signalmaximum. De tre tidigare nämnda sökarhållarna
användes även för den andra mätserien. De experimentella resultaten jämfördes med motsvarande teoretiska förutsägelser; enda skillnaden var att UTDefects körningar gjordes för en rektangulär spricka som ligger nära ytan medan experimenten utfördes för en remslik ytbrytande spricka. Trots observerade avvikelser mellan de
experimentella resultaten och teorin kunde dessa avvikelser hänföras till de studerade storheternas höga känslighet mot osäkerhet i komponentens kristallografiska struktur. En fråga som naturligt följer ur det observerade fenomenet är huruvida det är möjligt att noggrant bestämma läge på en defekt i en anisotrop komponent vars kristallografisk struktur är långt ifrån känd.
För det andra delmålet tillverkades 19 testblock av stål med varierande tjocklekar. Materialtjockleken och sökarfrekvensen valdes så att bakytan skulle hamna innanför närfältet. Signalamplituden för en 5 MHz-komponent mättes upp tre gånger för varje block. Denna experimentella konfiguration simulerade en spridning med en
longitudinell våg för en stor spricka med stressfria ytor. Även i detta fall noterades en rimlig överensstämmelse mellan de experimentella resultaten och teorin; den högsta avvikelsen på ca 10% observerades för avståndet från sökare motsvarande halva närfältet.
1 Introduction
This document reports the results of an experimental validation of the software program UTDefect with regard to its modelling the near field of a beam of ultrasonic waves, and of the backscattering of an ultrasonic beam by a surface breaking crack in an anisotropic material.
2 Scattering by a strip-like crack in an
anisotropic material
2.1 Background
Similarly to the case of a hosting isotropic material, UTDefect describes the scattering of a finite beam by a strip-like crack when the properties of the hosting medium depend on the direction of propagation of the inspecting wave, that is, the medium is anisotropic [Boström, 1991]. At the present, UTDefect can handle cracks that are positioned near the back surface of the inspected component, but not cracks that are surface breaking. However, as Boström (2000) has shown, when the dimension of a sub-surface crack is larger than two shear wavelengths, for high frequencies, the backscattered field produced by such a crack does not differ significantly from that due to a similar breaking crack. In this section, ultrasonic backscattering measurements from a surface-breaking crack in a silicon single crystal sample are reported and compared with theoretical predictions.
2.2 Sample description
A silicon single crystal, a material with cubic symmetry, with dimensions equal to 100x50x20 mm2 was purchased for this project from MaTecK (Jülich, Germany). As MaTecK was unable to specify the orientation of the crystal, X-ray diffraction measurements were performed to determine the orientation of the crystallographic axes of the sample. Technical as well as personal assistance in such a task was kindly offered by Prof. Sven Lidin of the Inorganic Chemistry Division at the University of Stockholm. The result of this examination showed that the crystal has cubic symmetry, and the principal crystallographic axes can be considered parallel to the edges of the sample with an error of the order of a degree. The mass density, ρ, and the phase velocities of longitudinal and shear waves along one of the principal crystallographic axes were measured in our lab. The following values were found,
ρ = 2323.3 Kg / m3, V
L = 8452 m / s, VT = 5855 m / s.
They differ from those reported in the literature [Ylilammi, 1998] for -0.1 %, -0.2 %, and 0.1 %, respectively. The satisfactory agreement between the measured values and those found in the literature suggest the use of the following values of the three independent elastic constants:
6
A notch was introduced in the largest surface of the sample by means of a wire-cutting machine as shown in Figure 1. Thus, the length of the notch equalled the width of the sample, i.e., 50 mm. Considering that the diameter of the inspecting beam used in this work was of the order of 15 mm, such a defect can be considered as if it were of infinite extent. The width of the notch was estimated to be about 0.2 mm at its mouth,
narrowing progressively with its depth to reach a value of about 0.1 mm at the tip of the notch. The radius of curvature of the notch's tip was estimated to be of the order of 0.05 mm, that is, much smaller than the wavelength of the ultrasonic waves used in the experimental validation, λT ~ 1 mm. The depth of the cut varies uniformly along its
front from 1.9 mm to 1.5 mm, implying that the front of the notch is inclined with respect to the surface by an angle of approximately equal to 0.5 degrees. As the depth to width ratio of the notch is close to ten, the scattering properties of the notch are expected to simulate those of a crack very closely [Roberts, 1989].
Figure 1: Schematic representation of the sample's geometry and its simulated surface-breaking crack (in green).
2.3 Experimental set-up
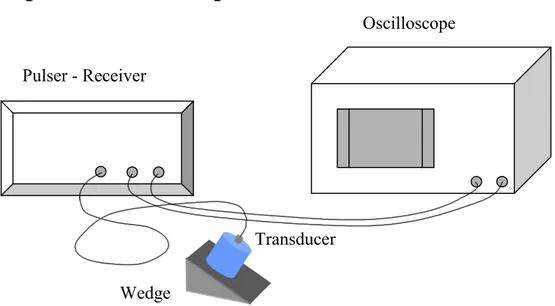
Figure 2: Schematic representation of the experimental setup.
Figure 2 schematically illustrates the experimental setup used in this part of the project. A conventional Pulser-Receiver (Panametrics, Model 5072) was used to excite
a longitudinal transducer (Panametrics, Model V541-SM) with nominal central frequency equal to 5 MHz, and diameter 1/2 inch. Three wedges of Plexiglas were manufactured in our lab to couple the transducer to the sample. The smaller of the two acute angles of the wedges, α, were measured to found equal to 22.5, 25, and 27.5 degrees. The longitudinal wave velocity of a pulse generated by the transducer in the wedge is 2737 m/s. The ultrasonic signal was displayed and analysed by means of a digital oscilloscope (Tektronix, Model TDS 5052).
Oscilloscope Pulser - Receiver
Transducer Wedge
2.4 Results
2.4.1 Position of the crack
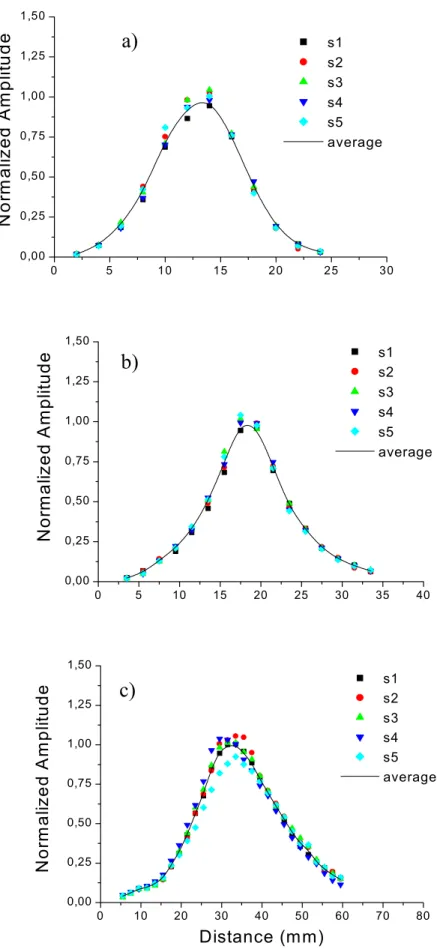
Five series of data were gathered with each wedge, by scanning the surface opposite that containing the crack by steps of 2 mm. Figure 3.a-c reports the normalised peak-to-peak amplitude of the back-scattered signal versus the position of the transducer with respect to the cut. Shown in each plot is also the average of the five series. The scattering of the experimental data can be attributed to the uncertainty of the transducer position, as well as to the variation of the coupling between the wedge and the silicon sample as the former was displaced. The maximum of the average curves falls at 14.0 mm for α = 22.5 deg, 17.5 mm for α = 25 deg, and 33.5 mm for α = 27.5 from the cut. Given that the measurements were acquired by displacing the transducer by steps of 2 mm, the values of the positions of the maxima can be considered affected by an absolute error of the order of 1 mm. Worth of notice is also the expected spread of the response measured as the width of the curve at half its maximum height - a) ∆ ~ 8 mm, b) ∆ ~ 10 mm, and c) ∆ ~ 22 mm – that increases with the distance as expected.
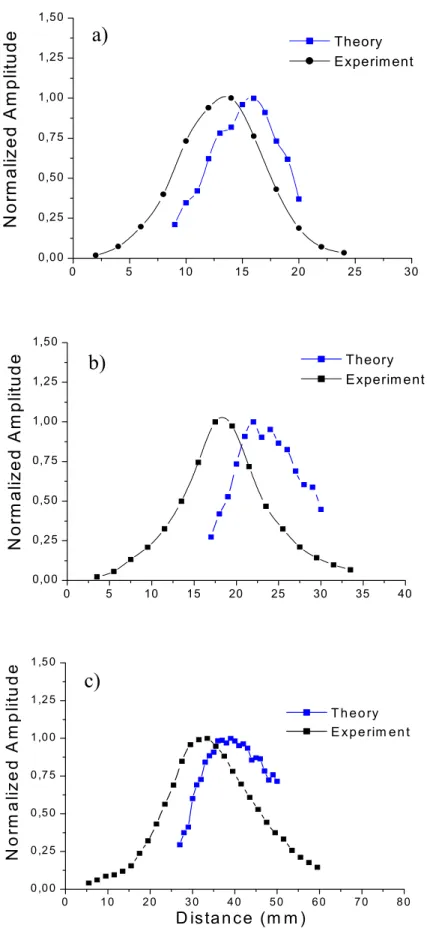
To reproduce these data, UTDefect was run assuming the crystallographic axes to be parallel to the edges of the sample, and the material elastic constants reported above. The crack was of rectangular shape with side lengths equal to 1.8 mm and 3.6 mm, respectively. The distance of the center of the crack from the back-surface was 1.3 mm, and its Euler angles equal to 0, 90, and 0 degrees. Numerical tests have shown the effect of such a distance to be minor for high ultrasonic frequencies. The simulated probe generated a monochromatic beam of longitudinal waves at a frequency of 5 MHz. Figure 4.a-c illustrates the comparison between the theoretical predictions and the average experimental curves that have already been presented in Fig. 3.a-c. The theoretical curves place the maxima at 16 mm for α = 22.5 deg, 22 mm for α = 25 deg, and 39 mm for α = 27.5 deg. A systematic difference between the positions of the maxima can be noticed, which increases with the angle of incidence: 2 mm for α = 22.5 deg, 4.5 mm for α = 25 deg, and 6 mm for α = 27.5 deg.
8 0 5 10 15 20 25 30 0,00 0,25 0,50 0,75 1,00 1,25 1,50 s1 s2 s3 s4 s5 average N o rm a liz e d Am pl itude 0 5 10 15 20 25 30 35 40 0,00 0,25 0,50 0,75 1,00 1,25 1,50 s1 s2 s3 s4 s5 average N o rm al iz ed Am p lit u d e 0 10 20 30 40 50 60 70 80 0,00 0,25 0,50 0,75 1,00 1,25 1,50 s1 s2 s3 s4 s5 average N o rm al iz ed A m pl itude Distance (mm)
Figure 3: Amplitude of the backscattered signal vs. distance from the crack. Angle of the wedge: a) α = 22.5 degrees, b) α = 25 degrees, c) α = 27.5 degrees.
a)
b)
0 5 10 15 20 25 30 0,00 0,25 0,50 0,75 1,00 1,25 1,50 Theory Experim ent N o rm al iz ed A m pl it ude 0 5 10 15 20 25 30 35 40 0,00 0,25 0,50 0,75 1,00 1,25 1,50 Theory Experim ent N o rm a liz ed Am pl it u d e 0 1 0 2 0 3 0 4 0 5 0 6 0 7 0 8 0 0 ,0 0 0 ,2 5 0 ,5 0 0 ,7 5 1 ,0 0 1 ,2 5 1 ,5 0 T h eo ry E xpe rim en t N o rm al iz ed A m pl it ude D istan ce (m m )
Figure 4: Comparison between theoretical predictions and experimental data. Angle of the wedge: a) α = 22.5 degrees, b) α = 25 degrees, c) α = 27.5 degrees.
a)
b)
10
To explain such a discrepancy, sensitivity tests were performed with respect to the orientation of the crystallographic axes, and to the Euler angles of the crack. Considering a configuration with α = 22.5 deg, it was found that variations of the second Euler angle from 90 degrees to 88 degrees and to 85 degrees cause a negligible variation of the signal amplitude, and do not affect the position of the maximum. On the other hand, variations of ± 5 degrees of the orientation of the crystallographic axes with respect to the scanning surface cause the position of the maximum to shift by about 5 mm in each direction. Bearing in mind that the orientation of crystallographic axes of the sample are known with an experimental error of the order of 1 degree, it seems reasonable to explain the discrepancy between theoretical and experimentally determined positions of the maximum in terms of the uncertainty of this quantity. In particular, it seems likely that an error of the order of +1 degree or more on the second Euler angle relative to the scanning surfaces may be responsible for the different values. Finally, the finer variations of the signal amplitude predicted by UTDefect, which are not observed in the experimental signals, can be attributed in part to the monochromatic nature of beam the experimental signals were obtained by using a broadband pulse -and in part to the coarser sampling used in the experiment, which reduces the sensitivity to finer signal oscillations.
2.4.2 Spectrum of the backscattered signal
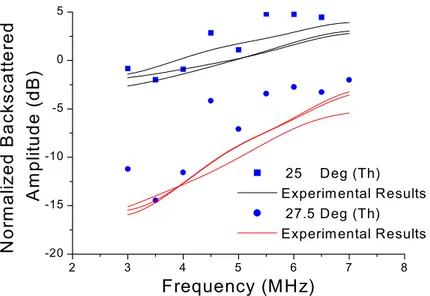
In order to validate the predictions of UTDefect regarding the scattering of an ultrasonic beam by a crack in an anisotropic material, an additional test was carried out on the frequency content of the signal backscattered by the crack as a function of the angle of incidence. For this purpose all three wedges previously described were used. The signals were gathered at the position where the peak-to-peak amplitude of the time domain signal is maximum. The power spectrum of each signal was recorded, and that which was obtained by using the wedge with an angle α = 22.5 degrees was used as a reference. Figure 5 shows the difference between the power spectra acquired at 25 deg, and 27.5 deg with respect to the reference spectrum. The normalisation is expected to eliminate, at least in part, the contribution from the measuring apparatus to the detected spectra. Although systematic differences can be observed for both series of data, the general trend and the order of magnitude of the experimental and theoretical results are the same.
2 3 4 5 6 7 8 -20 -15 -10 -5 0 5 25 Deg (Th) Experimental Results 27.5 Deg (Th) Experimental Results N o rm a liz ed B a cksca tt e red A m pl itud e ( d B ) Frequency (MHz)
Figure 5: Spectra of the signals backscattered by a surface-breaking cut in a single crystal silicon sample (continuous lines) and by a sub-surface crack (symbols). The power spectrum of the signal acquired by using the wedge with α = 22.5 wedge is used to normalise the other two.
3 Near-field behaviour of an ultrasonic
beam
3.1 Background
In a previous version of the software UTDefect, the ultrasonic beam emitted by a finite transducer was modelled by employing a mathematical technique (stationary phase approximation), which is valid only when the observation point is sufficiently far away from the transducer [Bövik and Boström, 1997]. As experience shows, finding cracks and other scatterers in close proximity to the transducer where the mathematical approximation no longer applies is not unusual. Sensible difference between the wave amplitudes as predicted by such a model and as determined experimentally were also reported in a recent experimental validation [Eriksson et al., 1997].
Such discrepancy between theory and experiment was partially attributed to the inability of the model to properly describe the near-field behaviour of the ultrasonic beam.
For these reasons, the model of the ultrasonic source considered in Version 3 of UTDefect was modified to make its description of the beam valid over a wider range of values of the distance between the transducer and the observation point [Boström, 2000]. The strategy followed to improve the model requires the surface of the source to be divided into sufficiently small elements, the near-field limit of which, N, is much smaller than that of the original transducer. Note that N scales down with the second power of element’s radius, a: N = a2/λ, where λ is the wavelength of the emitted wave. By applying the superposition principle to the partial beams, the field emitted by the original transducer is recovered. This model is expected to provide a better description of the beam’s behaviour in its near-field region.
12
UTDefect is designed to model a measurement process consisting of a transducer generating a finite beam that, after undergoing scattering by a defect, is finally detected, in general, by a second transducer. In other terms, UTDefect does not provide the response of a transducer directly insonified by a finite beam, without any intervening scattering event. However, a crack that is larger than the beam cross-section can be used to simulate the reflection of a finite beam from a stress-free surface. Therefore, in order to the test the validity of UTDefect in the near-field region of a transducer, an experimental set-up was conceived in which a finite beam is generated by a flat transducer, is reflected by a stress-free surface that is normal to its propagation direction and placed within the near-field region of the source, and finally is detected by the same transducer.
3.2 Sample description
To carry out this part of the project, 19 steel samples with thickness ranging from 7 mm to 25 mm and with lateral dimension measuring 30x50 mm2 were prepared for the purpose.
3.3 Experimental set-up
An experimental set-up similar to that described in the previous section was utilised here. The only difference worth reporting is that no wedge was used in this instance and the 5 MHz, ½ inch diameter, longitudinal transducer was placed in direct contact with one of the largest surfaces of each sample.
3.4 Results
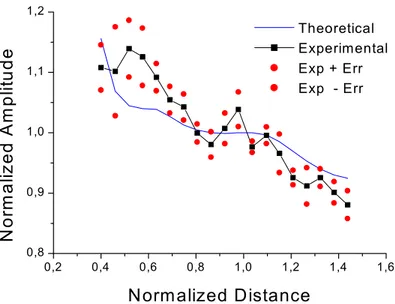
To determine the near-field behaviour of the finite beam, the first reflection from the back surface of each sample was recorded and decomposed into its Fourier components. Of these, the intensity, i.e., the modulus square, of the Fourier component at 5 MHz was measured and plotted against the travelled distance. This procedure was repeated three times for each sample and the average (black symbols) results are reported in Figure 6. The red symbols define a region of maximum variation of the experimental results obtained in this test. In Figure 6 the distance is normalised with respect to the near-field distance at the specified frequency, while the amplitude is normalised with respect to its value at 1 near-field length.
The typical large oscillations expected in the near-field region and along the beam axis are not revealed here, since the transducer provides a response that depends on the value of the field integrated over the face of the transducer. Instead, a nearly monotonic decrease of the signal amplitude of the signal amplitude is observed.
0,2 0,4 0,6 0,8 1,0 1,2 1,4 1,6 0,8 0,9 1,0 1,1 1,2 Theoretical Experimental Exp + Err Exp - Err N o rm al iz e d Am pl itude Normalized Distance
Figure 6: Symbols: experimental data showing the near field signal generated and detected by a flat, ½ inch diameter transducer upon reflection from a stress-free surface; Curve: theoretical prediction of the signal backscattered by a circular crack.
Figure 6 also reports the theoretical behaviour of the signal scattered by a large crack placed at the same distances as the back-wall of the samples used in the experimental part. The diameter of the crack is 15 mm, that is slightly larger that that of the beam, and its surface is orthogonal to the direction of propagation of the beam. Above this value of the diameter, numerical simulations showed that the amplitude of the signal do not change significantly. The distance of the crack is normalised with respect to that of the near-field region of the transducer. Here, again, a generally reasonable agreement between measurements and theory is observed, with a maximum difference between the two of the order of 10 %, i.e., less than 1 dB, at d / N = 0.5.
4 Conclusions
The theoretical predictions by the software UTDefect regarding the scattering of a finite beam of ultrasonic waves by a sub-surface crack in an anisotropic medium with cubic symmetry have been positively compared to measurements carried out on a simulated surface-breaking crack. However, the strong dependence of the scattered field on the material structure, and in particular, on the orientation of the crystallographic axes, raises the question whether the position of a crack can be determined with a reasonable accuracy in anisotropic materials having a structure which is not well characterised. The behaviour of an ultrasonic beam within the near-field region of the source as predicted by UTDefect has been tested and found to be in a reasonable agreement (less than 1 dB) with the experimental observations.
In view of the present results, an experimental investigation concerning the behaviour of a finite ultrasonic beam propagating in cladding material and cladded plates is suggested as a continuation of the validation program. In particular, the investigation should
14
concern measurements of the scattering-induced attenuation as a function of the propagation direction of a finite beam.
5 Acknowledgements
The theoretical data presented in this report were kindly provided by Prof. A. Boström, whose help and insight are here acknowledged. Also, the financial support by SKI is also acknowledge.
6 References
1. Boström, A., Ultrasonic probe radiation and crack scattering in anisotropic media, SKI Report 97:27, Swedish Nuclear Power Inspectorate, Stockholm 1997.
2. Boström, A., On the importance of edge conditions in an elastodynamic crack problem, in "Festskrift till Staffan Ström", eds A Karlsson och G. Kristensson, Lund, 1999.
3. Ylilammi, M., Properties of Silicon, 1998,
http://www.geocities.com/SiliconValley/Bay/4104/silicon.html.
4. Roberts, R.A., Elastodynamic scattering by a surface-breaking void, J. Acoust. Soc. Am. 85, pp. 561-566 (1989).
5. Bövik, P., Boström, A., A model of ultrasonic nondestructive testing for internal and subsurface cracks, J. Acoust. Soc. Am. 102, 2723-2733 (1997).
6. Eriksson, A.S., Boström, A., Wirdelius, H., Experimental validation of UTDefect, SKI Report 97:03, Swedish Nuclear Power Inspectorate, Stockholm 1997.
7. Boström, A., User guide to UTDefect, Version 3, SKI Report 00:44, Swedish Nuclear Power Inspectorate, Stockholm 2000.