FOCUS ON KINETICCS OF REMOVAL
ANTIBIOTICS WASTEWATER BY NANO-ZERO
VALENT IRON IN OXIDATION AND
PHOTOXIDATION PROCESS
1,2Parisa Hassanzadeh, Ph.D.
2Hossein Ganjidoust, Ph.D.
2Bita Ayati, Ph.D.
1William Hogland, Ph.D.
1Faculty of Health and Life Sciences, Dept. of Biology and Environmental Science,
Linnaeus University, Sweden
2
Civil and Environmental engineering Faculty, Tarbiat Modares University, Iran
ABSTRACT
Pharmaceutical wastewater can be difficult to treat with conventional physical/chemical and biological treatment systems. The presence of antibiotics in sewage selects for resistance markers that are able to spread through the microbial community and as a result, antibiotic resistant bacteria can potentially disseminate their resistance genes widely among members of the endogenous microbial community. The sludge products of urban and rural wastewater treatment plants are increasingly used to fertilize agricultural crops, dispersing unknown amounts of resistance genes and antibiotics that withstand standard sewage treatment. Pharmaceutical wastewater effluents are well known for their difficult elimination by traditional biotreatment methods and their important contribution to environmental pollution due to its fluctuating and recalcitrant nature. OTC is one of the nonbiodegradable antibiotics that makes antibiotic-resistant, so it can make be high risk for environment. NZVI can be a good choice for removal of OTC in aqueous solution. Response surface methodology (RSM) was used to optimize the amounts of NZVI and OTC to be used at pH 3 and under 200 W, UV-A irradiation. The responses were removal percent of absorption at 290 and 348 nm, TOC and COD of OTC. In the optimum condition, Linear model was performed 155 ppm of OTC were removed by 1000 ppm NZVI after 6.5 hours and the removal efficiency of absorption at 290 and 348 nm, TOC and COD were 87, 95, 85 and 89 percent, respectively. In the similar process, there is no organic compound after 14 hours. The parameters ORP, DO and pH were investigated for 6:30 hours to study the type of NZVI reaction in process. In the beginning of reaction, oxidation was the dominant reaction after 3 hours, photo catalytic reaction was remarkable. The mechanism of OTC degradation is proposed by HPLC/ESI-MS and four by products were found. Also the rate constants (first order kinetic chain reaction model) were 0.0099, 0.0021, 0.0010, 0.0049 and 0.0074 min-1, respectively.
KEYWORDS
Response Surface Methodology, Photocatalyic Reaction, UV- Irradiation, HPLC, ORP.
1. INTRODUCTION
The release of pharmaceuticals such as tetracyclines (TCs) into the environment poses a potential risk to human health. Tetracyclines especially oxytetracycline (OTC) as one of the TCs, has been used extensively in human therapy and to livestock as additives to combat diseases. In natural soils, the sorption and transport behaviors of this chemical is similar despite its structural variances (Hua 2011, Crane 2012 and Huang 2011 a). The presence of low levels of antibiotics such as OTC and their transformation products in the environment could facilitate the transfer and spread of antibiotic-resistant determinants among microorganisms, an emerging issue in public health. The levels of TCs in domestic wastewater and the effluent of WWTPs are 0.98–700 µg L−1, which might pose potential environmental risks (Huang 2011 a). Removal of TCs from the aqueous phase can be achieved through different ways such as physical operations such as absorption and photolysis, biological and chemical processes such as ozonation, UV/TiO2, UV/H2O2 and Fenton have been
used. In Thailand, the land previously used for shrimp were infected by OTC, soybean seeds as an adsorbent was used for remediation. The amount of OTC in soil was 105 mg/kg Soil, and after 10 days 80% is removed (Boonsaner 2010). By photolysis of 40 mg/L OTC at pH = 9 and 500 W, UV irradiation, 13.5% of TOC and 90% of OTC were removed after 240 min (Shaojun 2008). By using phosphoric acid and micro-wave the active surface of activated carbon was proved and at pH = 8.2 absorption of 537 mg/g OTC was promoted to 564 mg/g (Huang 2011 b). In activated sludge process with the 3000 mg/L sludge at pH value 7, 2 ppb OTC 74% were removed after 120 min (Huang 2011 a). Anaerobic digesters can remove 60% of 10 mg/L OTC in 64 days at 350C and pH value 7 (Arikan 2006). 100 mg/L OTC concentration during 60 min ozonation at pH =11 and 24 g/hr ozone value, was removed 99%. In 5 to 30 minutes of ozonation, the products were much more toxic than the initial material (Li 2008). The concentration of 1000 mg/L OTC in the photocatalytic process of TiO2/UV at pH =7 after 210 min, 88% have been removed (Zhao 2010). In Fenton
process, Iron and Hydrogen peroxide in a ratio of 1 to 10, after 120 min 70% of OTC with 100 mg/L initial concentration was removed (Uslu 2009).
It has been suggested that highly reactive nano scale zero valent iron (NZVI) could be applied in groundwater remediation and other environmental applications. For example, NZVI can effectively transform many environmental contaminants (Hua 2011). Chlorinated solvents, organochlorine pesticides, polychlorinated biphenyls, organic dyes, inorganic pollutants, heavy metals, antibiotics have been removed by NZVI. The mechanism of removal was oxidation and reduction in most cases (Kassaee 2011, Nowack 2007, Shan 2008 and Ghauch 2009). The oxides and Hydroxide Iron Oxide (FeOOH) have also been used in photocatalytic processes to removal pollutant molecules, for example the 20 mg/L bisphenyl by 200 mg/L α- Fe2O3 and 8 W, UV radiation at pH value of 7, 60
min of the 24% was removed after 60 min (Li 2007). 10 mg/L by Reactive Black 5 dye with 500 mg/L FeOOH and 300W, UV radiation at pH = 7 was reacted and during 480 min 45% of dye was removed (Hsueh 2006). 10 mg/L estradiol (hormone therapy) was also destroyed completely with 500 mg/L FeOOH, 5mg/L H2O2, 15W UV power and pH value of 7,
during 1320 min (Rodriguez 2003). The 30 mg/L hexachlorocyclo hexan a by 400 mg/L by Fe3O4, UV value 300W at pH = 6 and 60% removal was achieved in a period of 720 min (Fu
2005). 20 mg/L humic acid with 400 mg/L Fe3O4, 5mM H2O2, UV power value 300W and
pH = 7 was reacted completely at 180 min and 100% removal was obtained (Nie 2010).
The core-shell structure has important implications for the chemical properties of nZVI. The defective and disordered nature of the oxide shell renders it potentially more reactive than a simple
passive oxide layer formed on bulk iron materials. The relative composition of the oxide and the metal in nZVI is also markedly different from that of bulk ZVI. These considerations make the core-shell structure a highly important aspect to consider when studying the reactivity of nZVI for various remediation processes. The presence of two nano-constituents in the core-shell structure may impart combinational properties for contaminant removal: the metallic iron acts as the electron source and exerts a reducing character, while the oxide shell facilitates sorption of contaminants via electrostatic interactions and surface complexation, and at the same time, permits electron passage from the metal core (Yan 2010).
In several investigation of the oxidation properties of Iron nano particles for degradation of various pollutants used during the removal process, Iron two or three oxides is produced. The oxide layer on the surface of nano Iron particles causes it passive. So, the oxidation reaction is stopped. In most of these studies removal of contaminants did not completely, and in some cases toxic byproducts are also produced. No new applications for passive nano Iron oxide have also been suggested (Shan 2008, Ghauch 2009, Li 2007 and Hsueh 2006). But in this study, photocatalytic properties of Iron oxide have been employed during the process of oxidation properties of Iron nano particles to remove the OTC. The removal of OTC was completely and no toxic byproducts were produced. The ORP and DO changes and the mechanism of OTC degradation proved photocatalytic reaction. The kinetic model of process was also studied.
2. MATERIALS AND EXPRIMENTAL METHODS
2.1 Materials
In this study the materials were oxytetracycline from Sigma Aldrich with a purity of 99 %, Iron particles in the particle size of 20-80 nm with a purity of 90% from Research Institute of Petroleum Industry. Hydrochloric acid and sodium hydroxide were made by Merck method.
2.2 Experimental methods
In present study oxytetracycline, molecular formula C22H24N2O9.2H2O, molecular weight 496
g/mol, soluble in water, pH equal to 6.5 and the absorption wavelengths of 290 and 348 nm was used (Fig.1). Two peaks are corresponding to the aromatic system and carbonyl functional groups (C = O) (Pavia 1987).
Figure1. Structure and absorption spectrum of the OTC
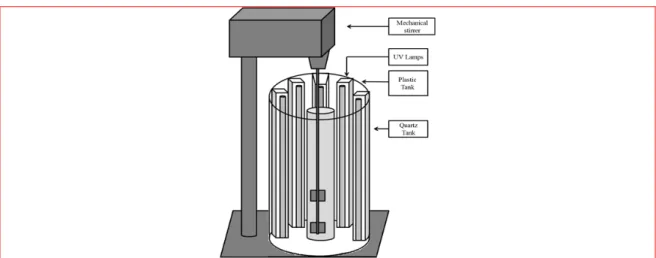
In this study, the 500 ml aqueous solution of OTC was drawn into the quartz tank with length 60 cm and the inner diameter 5.5 cm, the pH set by sodium hydroxide and hydrochloric acid. The solution is stirred by a glass shaft that attached to the mechanical stirrer with speed 300
rpm. Ten UV-A lamps with power value 20W are fixed vertically, around the reactor in 7 cm distance. The external plastic tank includes lamps and quartz tank, is covered by Aluminum plates for reduce of loss of energy (Fig.2).
Figure 2. Overview of system of process, oxidation / photoxidation of Iron nanoparticles
In order to find appropriate pH and irradiation power, some initial experiments were carried out by samples of OTC concentrations, 100 ppm, pH of 2, 3, 4, 5, 6, 7, 8, 9 and 11 nano particles Iron 1000 ppm, and the value power of radiation 60, 200 and 240 W in 10 hours. For RSM design the range of concentration of OTC and NZVI were 10 to 300 and 10 to 1000 respectively. Also time of reaction was fixed 1 to 10 hours. pH and UV power were 3 and 200W respectively. The ORP, pH and DO parameters and also mechanism and kinetic model of OTC degradation were studied in optimal condition of reaction.
All experiments were repeated three times at 22-24 °C, The measurement methods were based from the book of standard methods of testing water and wastewater (Greenberg 2005). It should be noted that the relative standard deviation (RSD) were less than 2.33 percent, reflecting the high reproducibility of the data. The process for determining appropriate levels of energy consumption for each concentration tested remove the ppm (mg/L) emissions were calculated according to Eq. (1) (Anousha 2009).
Energy Consumption/C= W.t/(Cin-Cout) (1)
In this equation, W is power consumption (kW), t the time of irradiation (hr), Energy Consumption / C power to remove any contaminants ppm (milligrams per kilo - watt hours per liter), Cin and Cout
are initial and final concentration of sample (ppm). The instruments that used in various stages of testing include a spectrophotometer (DR4000, Hach) for determination of absorbance, COD and TOC, XRD (Philips) for determination of oxide layer, pH meter (Metrohm), DO and ORP meter (HQ30d, HACH) CO2 Analyzer (EXTECH, CO250), HPLC/ESI-MS (Agilent 6410-QQQ) for
detecting by products,37T32T37Tdigital scale32T37T32T37TKern32T37T32T37Tmodel32T37T32T37TPLS360-332T37T.
3. RESULTS AND DISCUSSION
3.1 pH effect
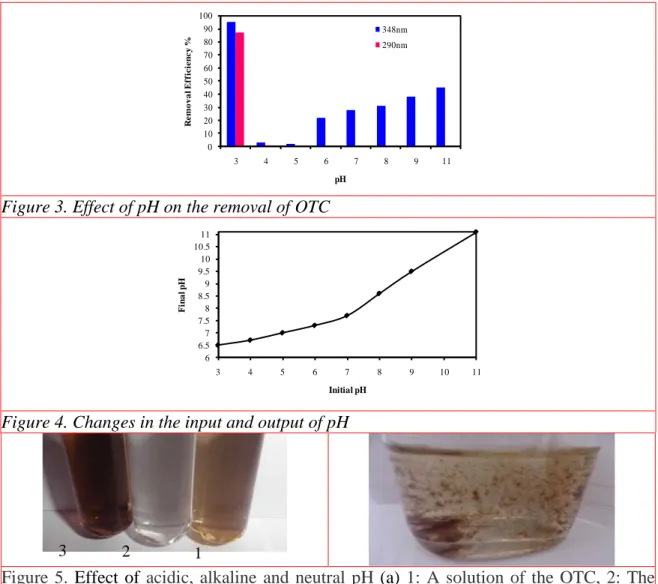
At pH=2, all the Iron particles were dissolved and no reaction happened. As shown in figure 3, at pH=3, hydroxyl and amine functional groups of OTC were removed (Hua 2011) and the high removal efficiency in both wavelengths was observed and the output was achieved at
pH=6.5. as shown in figure 4 the output pH is not changed in neutral and alkaline pH, so dissociation of OTC was less than acidic pH. The samples were prepared at alkaline and neutral pH (Fig. 5-a) had complex of Iron with OTC (Hua 2011) which has a darker color than the first solution and particles of Iron was dissolved completely (non-reusable).
0 10 20 30 40 50 60 70 80 90 100 3 4 5 6 7 8 9 11 R e m o v a l E ff ic ie n c y % pH 348nm 290nm
Figure 3. Effect of pH on the removal of OTC
6 6.5 7 7.5 8 8.5 9 9.5 10 10.5 11 3 4 5 6 7 8 9 10 11 F ina l pH Initial pH
Figure 4. Changes in the input and output of pH
Figure 5. Effect of acidic, alkaline and neutral pH (a) 1: A solution of the OTC, 2: The product of the process in the acidic pH, 3: The product in the alkaline and neutral pH (b) Flukes of Iron and OTC complex in the process of refining, the pH to alkaline and neutral, after add hydrochloridric acid
By adding 1 mL concentrated hydrochloridric acid after 12 hours the complex was coagulated and precipitated (Fig.5-b). The volume of residue was 10%. Note that the removal efficiency at pH=3 was 95%, and pH in both the 290 and 348 nm peak have been changed. The Iron oxide particles, the deposition of insoluble residues and their separation, centrifuge with 30 00 rpm at 10 min. was applicable. So pH=3 was chosen as optimum.
3.2 UV Irridiation effect
According to the figure 6, the power emitted at 200 and 240 watts at acidic pH=3, concentration of 100 mg/L OTC and 1000 mg/L rail for 10 hours, the highest removal efficiency at the wavelengths 290 and 348 nm, COD and TOC was 87, 95, 89 and 85 percent, respectively. 60 and 140 watts of radiant power absorbed at wavelengths 290 and 348 removal efficiency was less than 80% to 95% with increasing radiation intensity has
been great. While the TOC and COD removal
efficiency increased with increasing irradiation with gentler slopes. This indicates that a more effective role in UV damage than the OTC molecule reaction byproducts was removed. With regard to the relationship of energy to remove 1 mg/L OTC equal to 8.82 W at any time, in order to reduce the cost of electricity, radiation could be emitted as the 200 W was considered optimal.
Figure 6. Effect of UV irradiation
3.3 Response surface methodology
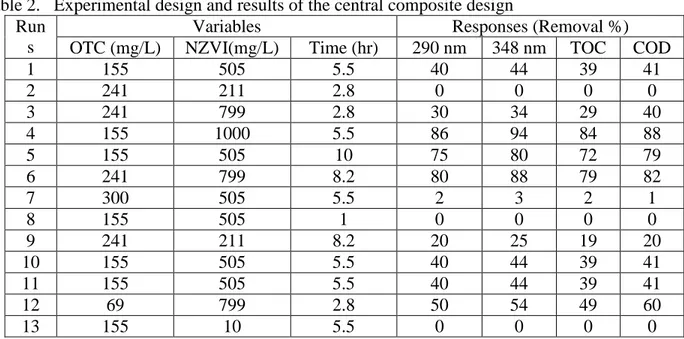
Response surface methodology (RSM) has been used to determination of optimal conditions for the removal of OTC by iron nano particles. In Table 1, the variable concentrations of parameters OTC, the nano iron particles and time of reaction have been shown with the levels (±1) and concentration range (±α). By the results of previous experiments, the value of pH must be 3 and the radiation power because of minimum energy consumption should be 200 W. In Table 2, 20 runs have been designed and four responses removal percents of OTC in wavelengths 290 and 348 nm TOC and COD should be obtained.
Table 1. Independent variables and their levels in the experimental design
Factors Units -1 Level +1 Level -α +α
OTC Concentration mg/L 68.78 241.22 10 300
NZVI Concentration mg/L 210.67 799.33 10 1000
Time hr 2.82 8.18 1 10
Table 2. Experimental design and results of the central composite design Run
s
Variables Responses (Removal %) OTC (mg/L) NZVI(mg/L) Time (hr) 290 nm 348 nm TOC COD
1 155 505 5.5 40 44 39 41 2 241 211 2.8 0 0 0 0 3 241 799 2.8 30 34 29 40 4 155 1000 5.5 86 94 84 88 5 155 505 10 75 80 72 79 6 241 799 8.2 80 88 79 82 7 300 505 5.5 2 3 2 1 8 155 505 1 0 0 0 0 9 241 211 8.2 20 25 19 20 10 155 505 5.5 40 44 39 41 11 155 505 5.5 40 44 39 41 12 69 799 2.8 50 54 49 60 13 155 10 5.5 0 0 0 0
14 69 799 8.2 85 93 83 87 15 10 505 5.5 90 100 95 98 16 69 211 2.8 3 7 6 7 17 155 505 5.5 40 44 39 41 18 155 505 5.5 40 44 39 41 19 155 505 5.5 40 44 39 41 20 69 211 8.2 70 74 68 82
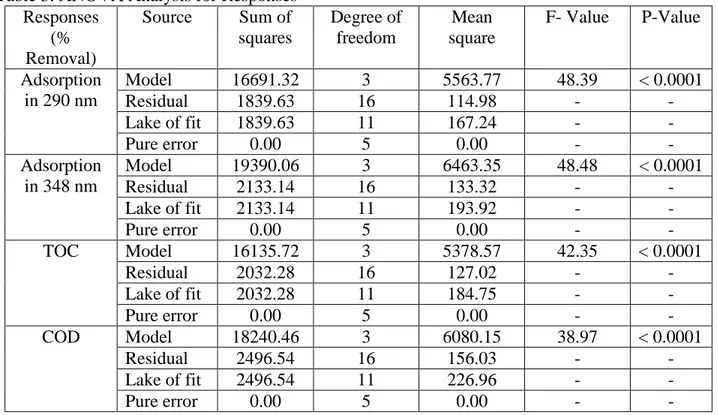
Table 3 shows Analysis of variance (ANOVA) provided consistent results for all four responses, P values of the data were less than 0.05 (Prob> F-Values), so linear model with a confidence level more than 95 percent was suitable. The correlation coefficient (R2) for each of the four responses absorption in 290 nm and 348 nm, TOC and COD were 0.90, 0.90, 0.89 and 0.88 respectively and the correlation coefficient adjusted (Adj. R2) were 0.88, 0.88, 0.87 and 0.86 respectively, which was due to the large difference in coefficient model was acceptable. A perfect fit for all four levels of the P-Values that indicate poor adaptation of the model to the data. The responses were fitted with linear Eqs. (2)-(5).
Removal efiiciency at 290 nm=-10.84013-0.19194 * OTC+0.073797 * NZVI+8.15871 * Time (2) Removal efiiciency at 348 nm= -10.49732-0.20734 * OTC+0.079881 * NZVI+8.74458 * Time (3) Removal efficiency of TOC = -7.28781-0.19993 * OTC+0.071716 * NZVI+7.82908 * Time (4) Removal efficiency of COD = -5.02747-0.21838 * OTC+0.076624 * NZVI+8.12388 * Time (5)
Table 3. ANOVA Analysis for Responses Responses (% Removal) Source Sum of squares Degree of freedom Mean square F- Value P-Value Adsorption in 290 nm Model 16691.32 3 5563.77 48.39 < 0.0001 Residual 1839.63 16 114.98 - - Lake of fit 1839.63 11 167.24 - - Pure error 0.00 5 0.00 - - Adsorption in 348 nm Model 19390.06 3 6463.35 48.48 < 0.0001 Residual 2133.14 16 133.32 - - Lake of fit 2133.14 11 193.92 - - Pure error 0.00 5 0.00 - - TOC Model 16135.72 3 5378.57 42.35 < 0.0001 Residual 2032.28 16 127.02 - - Lake of fit 2032.28 11 184.75 - - Pure error 0.00 5 0.00 - - COD Model 18240.46 3 6080.15 38.97 < 0.0001 Residual 2496.54 16 156.03 - - Lake of fit 2496.54 11 226.96 - - Pure error 0.00 5 0.00 - -
The Eqs. (2)-(5) have been shown that by increasing the NZVI concentration and decreasing OTC concentration, the removal efficiency will increase. Also removal of functional groups is easier than aromatic rings and by increasing the time of reaction, the photocatalytic reaction is more efficient than oxidation reaction, so degradation of OTC will be more. In figure 7 optimizing the process for removal efficiency (%) 80 to 100 of all responses during 6.5 hours, the yellow zone is the optimized condition. The validation of the model by two experiments have been done, both show confidence
level more than 95 percent. 10 82 155 228 300 10 258 505 752 1000 y A: OTC B : N ZV I 290 nm: 80 290 nm: 100 348 nm: 80 348 nm: 100 TOC: 80 TOC: 100 COD: 80 COD: 100
Figure7. Optimized condition in 6.5 hr
3.4 Photocatalytic efficiency
Degradation of OTC was used to evaluate the photocatalytic reactivity of the catalysts. The initial concentration of the OTC was 155 mg/l and the dosage of NZVI, was kept at 1000 mg/l. The pH was 3 and irradiation was carried out at 200 W UV-A (a run of the optimized condition). After 6.5 hr the oxide layer over the NZVI was analyzed by XRD, FeOOH was detected and the photocatalytic mechanism is explained by Eqs. (6) – (9) (Nie 2010).
FeOOH +hν→ e− +h+ (6)
H2O + h+ → OH• + H+ (7)
O2 +e−→ O2•− (8)
O2•− +2H+→ 2OH• (9)
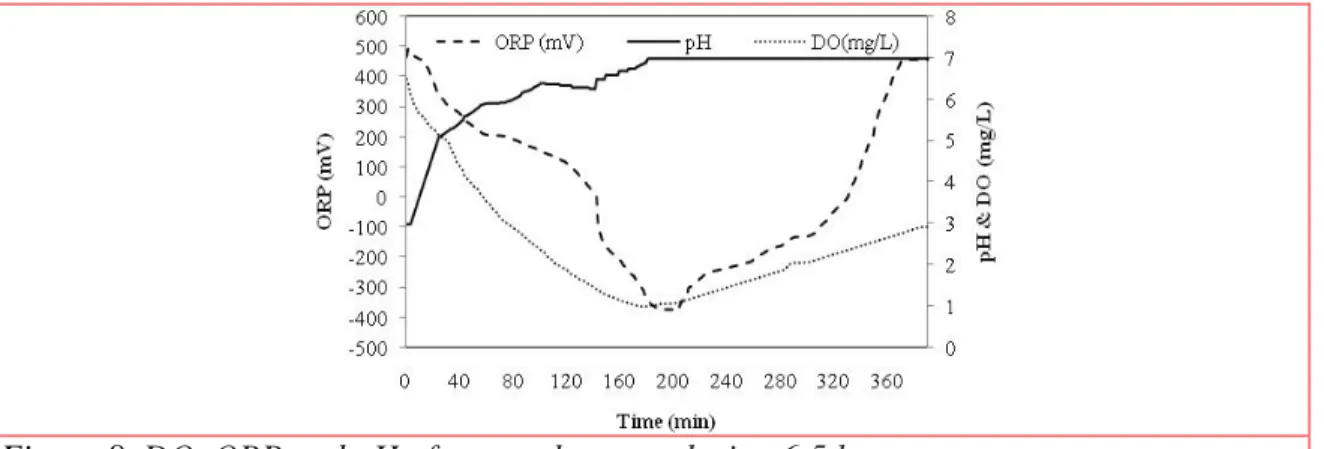
Also the oxidation reduction potential (ORP), DO and pH were determined to find the photocatalytic reaction time. In the Fig.8 we see that the DO and ORP in system dropped from 6.48 mg/L and 465.64 mV to 1.08 and -378.88 mV respectively. During this reaction, Iron oxidized and OTC reduced (Eqs. (10)-(14)) (Chen 2012). 2Fe0 + 4H+ + O2 → 2Fe2+ + 2H2O (10)
2Fe2+ + 2H2O → 2Fe3+ + H2 + 2OH- (11)
Fe3+ + 3OH-→ Fe(OH)3 (12)
Fe3+ + 2H2O → FeOOH + 3H+ (13)
Figure 8. DO, ORP and pH of removal system during 6.5 hr
During next 3 hours, the DO and ORP were raised to 2.92 mg/L and 456.00 mV respectively, this time iron was reduced and the byproducts of OTC were oxidized. The pH increased from 3 to 7 because of separation hydroxyl groups (Eqs. (15)-(16)) (Crane 2012).
FeOOH + 3H+ + e → Fe2+ + 2H2O (15) O2 + 2H2O + 4e → 4OH- (16)
3.5 Mechanism of degradation
By destroying the OTC molecule during the reaction, some major by produces have been detected by HPLC/MS and CO2 Analyzer (Fig. 9). P1 (C22H23N2O5) and P2 (C19H26) were produced during
oxidation of NZVI and P3 (C9H8O3), P4 (C3H4O5) and P5 (CO2) were produced in photocatalytic
reaction.
Figure 9. By products of OTC degradation
The mechanisms of producing P1 to P5 explain by two processes. In the Figure10 we find the removal of functional groups from rings of OTC during oxidation of NZVI (Morgan 2012).
OH OH O O NH2 OH OH N CH3 H3C OH OH H3C O O O H3C O -OH -NH2 -CH3 -CHO H3C
Figure 10. Production of P1 and P2 in oxidation system
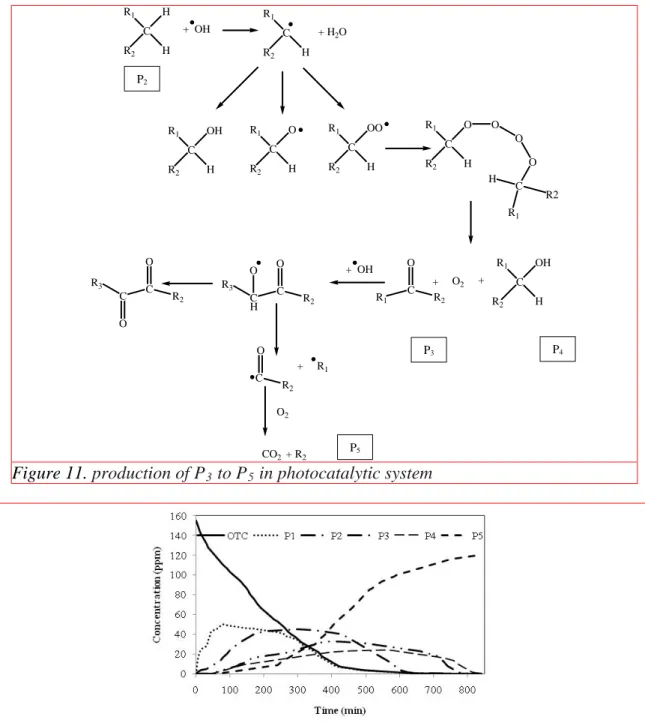
In photocatalytic reaction (Fig. 11) the hydroxyl radicals destroy the byproducts by Eqs. (17)- (20). R1, R2 and R3 are carbon chains or rings.
R-H + •OH → H2O + •R (17)
•R + O2 → RO2 (18)
R + •R → R-R (19)
R + •OH → R-OH (20)
3.6 Kinetic Study Look at Figure 12 and see the concentration changes of OTC and it's byproducts during the reaction. Production of P1 and P2 were started in the 15 min of reaction, after 460 and 580 min their concentration became 5 ppm respectively. P3 and P4 were produced in the 150 min of reaction and after 740 and 790 min their concentration became 5 ppm respectively. The Carbon dioxide produced after 160 min of reaction. The kinetic constant of OTC and it's by products removals calculate were first order chain reactions that have shown by Eqs. (21)-(26). The Central numerical determination was used to solve the equations (House 2007). d[OTC]/dt = -K1[OTC] (21) d[P1]/dt = K1[OTC]- K2[P1] (22) d[P2]/dt = K2[P1]- K3[P2] (23) d[P3]/dt = K3[P2]- K4[P3] (24) d[P4]/dt = K4[P3]- K5[P4] (25) d[P5]/dt = K5[P4] (26) P1 OTC P2
C R1 R2 H H C R1 R2 H + OH + H2O C R1 R2 H OH C R1 R2 H O C R1 R2 H OO C R1 R2 H O O O O C H R1 R2 C O R1 R2 C R1 R2 H OH + + O2 C O C H R2 R3 O + OH C O R2 + R1 O2 CO2 + R2 C O C R2 R3 O
Figure 11. production of P3 to P5 in photocatalytic system
Figure 12. The concentration changes of OTC and it's by products during the reaction
P1 and P2 were produced when all the functional groups (hydroxyl and carbonyl) removed
completely from OTC structure, K1 and K2 depend on Production of P1 and P2 were calculated
0.0099 and 0.0021 min-1 respectively. K2 is less than K1, because the carbonyl group has stronger
bond rather than amines and hydroxyl groups. P3 and P4 are the photocatalytic production. K3 is the
most less kinetically constant of converting P2 to P3 (0.0010 min-1), because the rings of P2 had to
break, so it took much time (Yuan 2011). Converting P3 to P4 was done by kinetic constant K4
(0.0049 min-1). K4 is faster than K3, because the structure of P4 is simple than P3. K5 (0.0074 min -1
) is the kinetic constant of converting P4 to CO2.
4. CONCLUSIONS
• The removal of OTC as a hard biodegradable compound by Nano zero valent Iron particles as a suitable remediation subject, was happened at pH 3. The optimal UV-A irradiation was obtained 200 W, because the more removal yield (90%) and the less consumption energy (8.82 W/hr for removal of 1 ppm
P2
P3 P4
OTC) was obtained.
• The layer oxide over the NZVI particles was detected as FeOOH. This chemical compound has photocatalytic properties to produce hydroxyl radicals. The ORP, DO and pH changes and structure of by products, during the reaction have confirmed that. After 3 hours of removal reaction the photocatalytic reaction by FeOOH was highlighted.
• In this process there were no toxic byproducts but in photolysis (Shaojun 2008), Ozonation (Li 2008 and Uslu 2009) and UV/TiO2 (Zhao 2010), the byproducts were toxic. The biological treatments for OTC removing were not very successful, because of the toxicity of OTC for microorganism and low yield of removing by them (Huang 2011a and Arikan 2006).
• The rate of removal reaction in this process was faster than photolysis and UV/TiO2 reactions. In photolysis and UV/TiO2 reactions, just hydroxyl and amines groups of OTC were removed by 0.0075 and 0.0018 min-1 respectively (Shaojun 2008 and Zhao 2010).
REFRENCES
Arikan, A., Sikora, L., Mulbry, W., Khan, S., Rice, C. and Foster, D. (2006), “The fate and effect of oxytetracycline during the anaerobic digestion of manure from therapeutically treated calves”,
Process Biochemistry , 41 (3), 1637–1643.
Boonsaner, M. and Hawker, D.W. (2010), “Accumulation of oxytetracycline and norfloxacin from saline soil by soybeans, Science of the Total Environment, 408 (7), 1731–1737.
Chen, J., Qiu, X., Fang, Z., Yang, M., Pokeung, T., Gu, F., Cheng, W. and Lan, B. (2012),
“Removal mechanism of antibiotic metronidazole from aquatic solutions by using nanoscale zero-valent iron particles”, Chemical Engineering Journal, (181– 182), 113– 119.
Crane, R.A. and Scott, T.B. (2012), “Nanoscale zero-valent iron: Future prospects for an emerging water treatment technology”, Journal of Hazardous Materials, 211– 212 (1), 112– 125.
Fu, H., Quan, X. and Zhao, H. (2005) , “Photodegradation of γ-HCH by α-Fe2O3 and the influence
of fulvic acid”, Journal of Photochemistry and Photobiology A: Chemistry, 173(1), 143–149.
Ghauch, A., Tuqan, A. and Assi, H.A. (2009), “Antibiotic removal from water: Elimination of amoxicillin and ampicillin by microscale and nanoscale iron particles”, Environmental Pollution,
157(2), 1626–1635.
House, J. E. (2007), Principles of Chemical Kinetics, Academic Press is an Imprint of Elsevier, San Diego, CA 92101-4495, USA.
Hsueh, C., Huang, Y., Wang, C. and Chen, C. (2006),“Photoassisted fenton degradation of
nonbiodegradable azo-dye (Reactive Black 5) over a novel supported iron oxide catalyst at neutral pH”, Journal of Molecular Catalysis A: Chemical , 245 (1-2), 78–86.
Hua, C., Hanjin, L., Yuecun, L., Tingting, D., Bingjie, H. and Yiping, W. (2011), “Removal of tetracycline from aqueous solutions using poly vinyl pyrrolidone (PVP-K30) modified nano scale zero valent iron”, Journal of Hazardous Materials, 192 (1), 44– 53.
Huang, M., Yang, Y., Chen, D., Chen, L. and Guo, H. (2011 a), “Removal mechanism of trace oxytetracycline by aerobic sludge”, Process Safety and Environmental Protection, 90 (2), 141-146. Huang, L., Sun, Y., Wang, W., Yue, Q. and Yang, T. (2011 b), “Comparative study on
application in removal of oxytetracycline (OTC) ”, Chemical Engineering Journal , 171 (3), 1446– 1453.
Kassaee, M.Z., Motamedi, E., Mikhak, A. and Rahnemaie, R. (2011), “Nitrate removal from water using iron nanoparticles produced by arc discharge vs. reduction”, Chemical Engineering Journal,
166 (1), 490–495.
Li, F.B., Li , X.Z., Liu, C.S. and Liu T.X. (2007), “Effect of alumina on photocatalytic activity of iron oxides for bisphenol A degradation”, Journal of Hazardous Materials, 149 (1), 199–207. Li, K., Yediler, A., Yang, M., Hostede, S. and Wong, M. (2008), “Ozonation of oxytetracycline and toxicological assessment of its oxidation by-products”, Chemosphere, 72 (2), 473–478.
Morgan, P. E., Pattison, D. I. and Davies, M. J. (2012), “Quantification of hydroxyl radical-derived oxidation products in peptides containing glycine, alanine, valine, and proline”, Free Radical
Biology & Medicine, 52 (2), 328–339.
Nie, Y., Hu, C., Zhou, L., Qu, J., Wei, Q. and Wang, D.(2010), “Degradation characteristics of humic acid over iron oxides/Fe0 core–shell nanoparticles with UVA/H2O2”, Journal of Hazardous Materials , 173 (1-3), 474–479.
Nowack, B. and Bucheli, T. D. (2007), “Occurrence, behavior and effects of nanoparticles in the environment”, Environmental Pollution, 150(2), 5-22.
Rodringuez, M., Timokhin, V., Contreras, S., Chamarro, E. and Esplugus,S. (2003), “Rate equation for the degradation of nitrobenzene by Fenton-Like reagent”, Advances in Environmental Research,
7(2), 583-595.
Shan, Z. Z., Fu, L. J., Chao, T., Fang, Z. Q., Tian, H. J. and Bin, J. G. (2008), “Rapid decolorization of water soluble azo-dyes by nanosized zero-valent iron immobilized on the exchange resin”, Sci. China B-Chem, 51(2),186-192.
Shaojun, J., Shourong, Z., Daqiang, Y., Lianhong, W. and Liangyan, C. (2008), “Aqueous
oxytetracycline degradation and the toxicity change of degradation compounds in photoirradiation process”, Journal of Environmental Sciences , 20 (7), 806–813.
Uslu, M. and Balcıoğlu, I. (2009), Comparison of the ozonation and Fenton process performances for the treatment of antibiotic containing manure”, Science of the Total Environment, 407 (11), 3450–3458.
Yan, W., Herzing, A. A., Kiely, C. J. and Zhang, W. (2010), “Nano-scale zero-valent iron (nZVI): Aspects of the core-shell structure and reactions with inorganic species in water”, Journal of
Contaminant Hydrology, 118 (3-4), 96–104.
Yuan, F., Hu, C., Hu, X., Wei, D., Chen, Y. and Qu, J. (2011) , “Photo-degradation and toxicity changes of antibiotics in UV and UV/H2O2 process”, Journal of Hazardous Materials, 185 (2),
1256–1263.
Zhao, C., Deng, H., Li, L. and Liu, Z. (2010), “Photodegradation of oxytetracycline in aqueous by 5A and 13X loaded with TiO2 under UV irradiation”, Journal of Hazardous Materials , 176 (1-3), 884–892.
Greenberg, A.E., Eaton, A.D., Mary Ann and Franson, H. (2005), Standard methods for the
examination of water & wastewater, APHA, AWWA, WPCF, Washington, DC, USA.
Pavia. D. L.(1987), Introduction to spectroscopy, Department of chemistry western Washington university, Bellingham, Washington by W. B. Saunders Company.
Anousha, M., Samadi, M., Samarghandi, M., Hoseini, N., Khodadi, M. (2009), “Comprision of Advanced oxidation processes Ozonation with TiO2/UV to remove acidic dyes Acid Black 10B,