LNAPLs do not Always Float: An Example Case of a
Viscous LNAPL under Variable Water Table Conditions
M. Oostrom1Environmental Technology Division, Pacific Northwest National Laboratory, Richland, Wash-ington
C. Hofstee
TNO, Geo-Energy Division, Utrecht, The Netherlands
T.W. Wietsma
Environmental Molecular Sciences Laboratory, Pacific Northwest National Laboratory, Richland, Washington
Abstract. An intermediate-scale experiment was conducted to investigate the behavior of a viscous LNAPL under variable water table conditions. Two LNAPL volumes were released from a small source zone on top of the flow cell into a partly saturated, homogenously packed porous medium. Following a 30-day redistribution period, the water table was increased 0.5 m in 50 min-utes. After the water table rise, LNAPL behavior was monitored for an addi-tional 45 days. Fluid saturation scans were obtained periodically with a fully automated dual-energy gamma radiation system. Results show that both spills follow similar paths downwards. LNAPL drainage from the unsaturated zone was relatively slow and a considerable residual LNAPL saturation was ob-served after 30 days of drainage. Most of the mobile LNAPL moved into the capillary fringe during this period. After the water table rise, LNAPL moved up in a delayed fashion. After 45 days, the LNAPL has moved up only ap-proximately 0.2 m. Since the LNAPL has only moved up a limited amount, nonwetting fluid entrapment was also limited. The experiment was simulated using the STOMP multifluid flow simulator. A comparison indicates that the simulator is able to predict the observed phenomena well, including residual saturation formation in the vadose zone, and limited upward LNAPL move-ment after the water table rise. The results of this experimove-ment show that viscous mobile LNAPL, subject to variable water table conditions, does not necessarily float on the water table and may not appear in an observation well.
………..
1
Hydrology Group
Environmental Technology Division Pacific Northwest National Laboratory P.O. Box 999, MS K9-33
Richland, WA 99352 Tel. (509) 375-0737
1. Introduction
Based on their density compared to water, NAPLs are usually divided into two categories, Dense Nonaqueous Phase Liquids (DNAPLs) and Light Nonaqueous Phase Liquids (LNAPLs). LNAPLs in the subsurface are found at, among others, petroleum tank farms, gasoline service stations, and oil refin-eries. LNAPLs are generally distributed near the water table or capillary fringe and can migrate laterally as an immiscible fluid in a direction approximately parallel to the water table (Marinelli and Durnford, 1996).
Field investigations of LNAPL sites usually include monitoring wells in the LNAPL distribution zone. LNAPL, floating on top of water, might be ob-served in the wells. Under these conditions, the elevations of the air-LNAPL and LNAPL-water interfaces can be measured. From these elevations, the posi-tion of the water table can be computed if the densities of water and the
LNAPL are known (Marinelli and Durnford, 1996). Equivalent relationships between LNAPL thickness in a well and the volume of LNAPL in the adjacent porous medium has been developed by Farr et al. (1990) and Lenhard and Parker (1990). To our knowledge, none of published work relating observable LNAPL in wells to presence and volumes in adjacent porous media has in-cluded a discussion of the effects of LNAPL viscosity. The viscosity of petro-leum hydrocarbon LNAPL might be considerably larger than that of water (Cole, 1994) with reported kinematic viscosities over 0.4 Pa s for heavy fuel oil and even larger for used oils. Viscous LNAPL are expected to move slowly through the subsurface and exhibit apparent delayed responses to aqueous phase pressure changes. For instance, in a rising water table system, a viscous LNAPL might not rise as fast as the water table and can be completely by-passed by the less viscous water.
The main objective of this research is to investigate the behavior of infil-trating and redistributing viscous LNAPL in a partly saturated porous medium and its response to a rapid water table elevation. The study, which took over three months to complete, was conducted in an intermediate-scale flow cell us-ing a dual-energy gamma system to measure fluid saturations (Oostrom et al., 2005b). A second objective is to test if a multifluid flow simulator (STOMP; White and Oostrom, 2000, 2004) would be able to predict the behavior of the viscous LNAPL, including the formation of residual and entrapped saturation. Laboratory experiments have shown that formation of residual NAPL might be an important process under certain conditions and needs to be considered in modeling NAPL migration, redistribution, dissolution and volatilization (Oos-trom et al., 2005a; Oos(Oos-trom and Lenhard, 2003). In modeling NAPL infiltra-tion experiments, neglecting residual NAPL yields under estimainfiltra-tions of the NAPL retained in the vadose zone and over estimation of the NAPL volumes reaching the capillary fringe. The theory of Lenhard et al. (2004) currently provides the most complete description of the formation of residual NAPL and is incorporated into the STOMP simulator.
2. Materials and Methods
The viscous LNAPL experiment was performed in a 1.02-m-long, 0.75-m-high, and 0.055-m-wide flow cell. The x- and z-coordinates of the lower left hand corner of the cell are denoted as (0, 0). A dual-energy (americium and ce-sium) gamma radiation system was used to determine water and LNAPL satu-rations values at 1887 locations. The 1887 measurement locations are on a 51 x 37 uniform grid with a distance of 0.02 m between each horizontal and vertical location. The flow cell was packed under saturated conditions with 40/50 mesh Accusand. The water table level in the flow cell was controlled by two end chambers, each of which was connected to a constant head reservoir. After the packing procedure, the water table was lowered from z = 0.75 m to z = 0.04 m with a constant rate of 0.01 m/min. Water was then allowed to drain out of the flow cell for ten days. It was observed that 99% of the total collected water was drained after 6 hours and 99.9 % after 24 hours. No measurable drainage was observed after three days. Dual-energy gamma measurements were ob-tained after five and 10 days of draining to determine water saturations. The differences in water saturations between the two scans were within the error of the measurement technique.
After the 10-day drainage period, considered to be sufficiently long for quasi-hydraulic equilibrium conditions to exist, the first 0.4 L LNAPL spill was released into the variable saturated sand through a 0.02-m-wide stainless steel source. The LNAPL consisted of 90 % (by volume) of Peacock lard oil and 10% 1-iodoheptane. The latter component was added to increase the at-tenuation coefficient of the LNAPL, allowing sufficient gamma atat-tenuation differentiation between the LNAPL and the aqueous phase. For observational purposes, the LNAPL was dyed with 0.1 g/L Sudan IV dye. The source was placed on top of the sand, and extended over the width of the flow cell. The LNAPL level in the source was kept at a constant 0.03 m above the top of the sand using a Marriott bottle. After 0.4 L infiltrated, the source was quickly re-moved. The infiltrated LNAPL was allowed to redistribute for seven days. At the end of this period, a gamma scan was obtained to determine fluid satura-tions. Next, a second 0.4 L spill was released, following the same method as for the first one. After the second LNAPL addition, redistribution was allowed for 30 days. At the end of this period, another gamma scan was obtained. Sub-sequently, the water table was raised from z = 0.04 m to z = 0.54 m with a con-stant rate of 0.01 m/min. After the water table elevation, fluid redistribution occurred for 45 days until the experiment was terminated. Gamma scans were obtained after 15, 30, and 45 days after the water table rise.
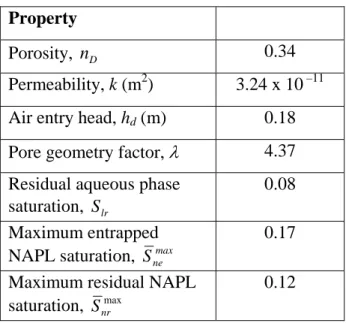
Hydraulic properties of the sand are presented in Table 1. The listed poros-ity is the average value of all measurement locations and was determined with the dual-energy gamma system as part of the calibration procedure. The per-meability was obtained using a constant-head method (Klute and Dirksen, 1986). The Brooks and Corey (1964) retention parameters (pore geometry fac-tor, λ, air-entry head, hd, and irreducible water saturation, Slr) were obtained
applying the RETC program (Van Genuchten, 1985) to the water saturation data after the 10-day drainage period of the flow cell. For this exercise, it was
assumed that hydraulic equilibrium existed and that the air-water capillary head was equal to the distance of a measurement location to the water table at z = 0.04 m. For each elevation, the saturation data from 51 locations were aver-aged. The maximum entrapped and residual LNAPL saturation parameters were obtained in the laboratory using saturation-pressure apparatus techniques discussed by Lenhard (1988) and Oostrom et al. (2005b).
Table 1. Hydraulic properties of 40/50 Accusand
Property
Porosity, nD 0.34
Permeability, k (m2) 3.24 x 10 –11 Air entry head, hd (m) 0.18
Pore geometry factor, λ 4.37 Residual aqueous phase
saturation, Slr
0.08 Maximum entrapped
NAPL saturation, Snemax
0.17 Maximum residual NAPL
saturation, max nr
S
0.12
Measured properties of the LNAPL are listed in Table 2. The properties were obtained at a laboratory temperature of 22o C.
Table 2. Fluid Properties of Viscous LNAPL
Property
LNAPL density, ρn (kg/m3) 971
LNAPL viscosity, µn (Pa s) 3.23 x 10 –2
Gas-Aqueous surface tension (clean water), σgl (N/m)
0.072 Gas-Aqueous surface tension
(contaminated water), σgl (N/m) 0.057 NAPL-aqueous interfacial tension, σnl (N/m) 0.015 Gas-NAPL surface
ten-sion,
σgn (N/m)
The governing equations solved by the STOMP simulator (White and Oos-trom, 2000) are those for water and oil mass conservation, transported over the aqueous phase and NAPL. The aqueous phase comprises liquid water with dis-solved oil, while the NAPL comprises a single organic liquid. Water disdis-solved in the NAPL and transport of water and oil vapor through the gas phase are ig-nored. Equilibrium dissolution is assumed to occur in the presence of NAPL. For the simulations described in this paper, the Brooks and Corey (1964) satu-ration – capillary pressure relations are used which honor a distinct nonwetting fluid entry pressure where the relative permeability of the nonwetting fluid goes to zero. The relations for two- and three-phase conditions are outlined in White et al. (2004). A more complete description of the constitutive equations and numerical solution schemes is provided in the theory guide for the STOMP simulator (White and Oostrom, 2000).
Entrapped NAPL saturation is computed using the approach outlined by Kaluarachchi and Parker (1992). Residual NAPL saturation is computed using the formulation of Lenhard et al. (2004), which recognizes residual NAPL formation within the pore-space region between the apparent aqueous saturation and the maximum apparent total-liquid saturation. This theory is based on fluid displacement physics in pore spaces. The Lenhard et al. (2004) model allows for residual NAPL collocated with mobile NAPL, which can re-duce the mobile NAPL relative permeability. As with the theories for en-trapped and residual NAPL, the formulation of Kaluarachchi and Parker (1992) is used for the aqueous relative permeability and simplified formulations of Lenhard et al. (2004) for the NAPL relative permeability.
A computational grid of 51 x 37 = 1887 cells was chosen so that the cell centers coincide with the gamma measurement locations. During the two NAPL infiltration periods, a constant pressure representing a NAPL head of 0.03 m was imposed on the top surface of grid cell (26, 37). The upper and lower boundaries of the domain were zero-flux boundaries for the aqueous phase. Hydraulic head boundaries were imposed on the west and east bounda-ries.
3. Results and Discussion
After drainage, the capillary fringe has uniform thickness of approximately 0.18 m across the flow cell. The first 0.4-L spill took 32 minutes and 24 sec-onds to infiltrate. A picture of the LNAPL body at the end of the first release is shown in Fig. 1. The infiltrated area is almost circular and the color intensity is the same throughout. After the infiltration has ceased, mobile LNAPL contin-ued to move downward while residual LNAPL remained behind. The final capillary fringe height was approximately 0.14 m, which is 0.04 m (22%) smaller than the fringe in an uncontaminated system. The fringe reduction is primarily the result of the decrease in the air-aqueous phase interfacial tension from 0.072 N/m to 0.057 N/m upon contamination with dissolved component in the aqueous phase (21%). It is likely that the top of the capillary fringe not
in direct contact with the LNAPL got contaminated by movement of vapors through the gas phase and subsequent partitioning into the aqueous phase.
Fig. 1. LNAPL body after first release.
The second 0.4-L release took 33 minutes and 32 seconds to infiltrate. This time is similar to what was recorded for the first release. The redistribution process was also similar to what happened after the first release. The LNAPL in the capillary fringe moved very slowly in a lateral direction. After 15 days, total lateral movement was approximately 0.09 m in each direction and after 30 days (Fig. 2), the LNAPL body had traveled an additional 0.03 m.
The gamma scan representing the situation after 30 days is shown in Fig. 3a. An integral volume computation using the gamma data yielded 0.775 L, which is 0.025 L (3.1%) less than the actual released total LNAPL volume. The simulated LNAPL saturations after 30 days are shown in Fig. 3b. A com-parison of Figs. 3a and 3b shows that the residual saturation formation and the lateral extent of the LNAPL body in the capillary fringe are predicted reasona-bly well.
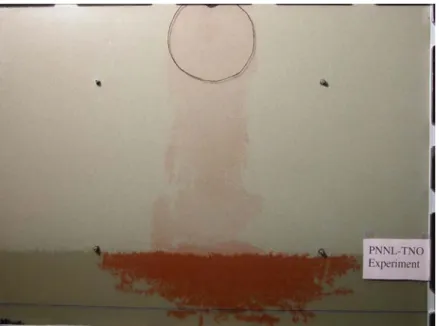
The water table rise was completed in 50 minutes. At this point in time, the viscous LNAPL remained virtually unchanged in appearance. Only a slight rise was observed in the upper center part of the oil body. The capillary fringe after the rise was reduced from 0.14 to 0.08 m. This reduction was expected because water is imbibing into the porous media. Over time, the LNAPL started to move slowly upwards. A picture demonstrating the delayed response after 45 days is shown in Fig. 4. The LNAPL moves up only through the zone that was previously wetted by the LNAPL after the two releases. The LNAPL does not move up outside that 0.2-m wide zone. The primary reason for that behavior is that the upward moving LNAPL is not able to exceed the nonwetting fluid en-try pressure outside the region that already contains small amounts of LNAPL. After 45 days, the LNAPL has moved up only about 0.2 m. The gamma scan of the situation after 45 days is shown in Fig. 5a. The integrated volume for this plot is 0.783 L, which is 2.2% less than the total release of 0.8 L. Fig. 5b shows the simulated LNAPL saturations. Fig. 5b indicates that the simulator is able to predict the main features of the delayed LNAPL movement due to the water table rise. The predicted upward movement of about 0.2 m matches the observed movement well. The simulation also confirms the restricted upward flow on both sides of the LNAPL body. For illustrative purposes, the simula-tion was carried out to one year. At that point in time, some LNAPL started to appear on top of the new capillary fringe with considerable LNAPL was still present in the original capillary fringe.
4. Summary and Conclusions
Results show that both spills follow similar paths downwards. Upon arrival of the LNAPL on top of the capillary fringe, desaturation started to occur. Within two hours after the first LNAPL arrival, the capillary fringe was re-duced across the cell by approximately 0.04 m (22%). This reduction is di-rectly related to the decrease in the air-water surface tension from 0.072 to 0.057 N/m. LNAPL drainage from the unsaturated zone was relatively slow and a considerable residual LNAPL saturation, up to 0.13, was observed after 30 days of drainage. Most of the mobile LNAPL moved into the capillary fringe during this phase, while the outer edge of the LNAPL moved laterally with an average velocity of less than 0.01 m/day. After the water table rise, the LNAPL moved up in a delayed fashion.
(a)
(b) Fig. 3. Measured (a) and simulated (b) LNAPL saturations 30 days after the
second release.
The LNAPL used the same path upwards as it used coming down during the infiltration phase. It appeared that the LNAPL was not able to exceed the non-wetting fluid entry pressure needed to displace water from the largest water filled pores. After 45 days, the LNAPL has moved up only approximately 0.2
m. Since the LNAPL has only moved up a limited amount, nonwetting fluid entrapment is limited.
Fig. 4. Photograph of LNAPL distribution 45 days after the rise. The lower and upper blue lines indicate the location of the initial and final water table.
The experiment was simulated using the STOMP multifluid flow simula-tor, which includes entrapped and residual LNAPL saturation formation. All of the parameters values needed in simulations were independently obtained. A comparison indicates that the simulator is able to predict the observed phe-nomena reasonably well, including residual saturation formation in the vadose zone, and limited upward LNAPL movement through pores that contain mo-bile LNAPL. The results of this experiment show that viscous momo-bile LNAPL, subject to variable water table conditions, does not necessarily float on the wa-ter table and may not appear in an observation well.
It is quite clear that the results described experiment have limited applica-bility due to the LNAPL fluid properties (density, viscosity), hydraulic proper-ties of the porous medium, and imposed initial and boundary conditions. Ex-perimental investigation of LNAPL behavior for several different conditions is not practical. The acceptable performance of the STOMP simulator provides some level of confidence that the code is able to simulate LNAPL behavior in fluctuating water table systems. This positive result will be helpful in the analysis of LNAPL behavior of LNAPLs in such systems. In a current research program, the STOMP simulator is used to evaluate several LNAPL flow sce-narios in homogeneous and heterogeneous systems undergoing water table changes at the laboratory and the field scale.
(a)
(b) Fig. 5. Measured (a) and simulated (b) LNAPL saturations 45 days after the
water table rise.
5. Acknowledgements
Memorial Institute for the Department of Energy (DOE) under Contract DE-AC06-76RLO 1830. This research is part of the Groundwater/Vadose Zone In-tegration Project funded through the DOE’s Richland Operations Office. The intermediate-scale experiment was performed in the Environmental Molecular Sciences Laboratory (EMSL), a national scientific user facility sponsored by the DOE's Office of Biological and Environmental Research and located at PNNL. Scientists interested in conducting experimental work in the EMSL or using the STOMP simulator are encouraged to contact the senior author. References
Brooks, R.H., and A.T. Corey. 1964. Hydraulic properties of porous media.
Hydrol-ogy Papers 3, Colorado State University, Fort Collins, Colorado.
Cole, G.M. 1994. Asssessment and Remediation of Petroleum Contaminated Sites. CRC Press, Boca Raton, FL.
Farr, A.M., Houghtalen, R.J., and McWhorter, D.B. 1990. Volume estimate of light nonaqueous phase liquids in porous media. Ground Water 28:48-56.
Kaluarachchi, J.J., and Parker, J.C. 1992. Multiphase flow with a simplified model for oil entrapment. Transport in Porous Media 7:1-14.
Klute, A., and Dirksen, C. 1986. Hydraulic conductivity and diffusivity: Laboratory methods. p. 687-734. In: Methods of soil analysis. Part 1. (A. Klute, Ed.) SSSA, Madison, WI.
Lenhard, R.J., Oostrom, M. and Dane, J.H. 2004. A constitutive model for air-NAPL-water flow in the vadose zone accounting for residual NAPL in strongly air-NAPL- water-wet porous media. J. of Contam. Hydrol. 71:261-282.
Lenhard, R.J. and Parker, J.C. 1990. Estimation of free product hydrocarbon volume from fluid wells in monitoring wells. Ground Water 28: 57-67.
Marinelli, F., and Durnford, D.S. 1996. LNAPL thickness in monitoring wells consid-ering hysteresis and entrapment. Ground Water 34: 405-414.
Oostrom, M. and Lenhard, R.J. 2003. Carbon tetrachloride flow behavior in unsatu-rated Hanford caliche material: An investigation of residual NAPL. Vadose Zone
J. 2: 25-33.
Oostrom, M., White, M.D., Lenhard, R.J., van Geel, P.J., and Wietsma, T.W. 2005a. A comparison of models describing residual NAPL formation in the vadose zone.
Vadose Zone J. 4:163-174.
Oostrom, M., Dane, J.H., and Wietsma, T.W. 2005b. Flow behavior and remediation of a multicomponent DNAPL in a heterogeneous, variable saturated porous me-dium. Vadose Zone J. 4:1170-1182.
tension and hydraulic conductivity data. U.S. Salinity Lab. Spec. Rep. U.S.
Salin-ity Lab., Riverside, CA.
White, M.D., and Oostrom, M. 2000. STOMP Subsurface Transport Over Multiple
Phases, Version 2.0, Theory Guide. PNNL-12030, Pacific Northwest National
Laboratory, Richland, Washington.
White, M.D., and Oostrom, M. 2004. STOMP Subsurface Transport Over Multiple
Phases, Version 3.1, User’s Guide. PNNL-14478, Pacific Northwest National
Laboratory, Richland, Washington.
White, M.D., Oostrom, M., and Lenhard, R.J. 2004. A practical model for mobile, re-sidual, and entrapped NAPL in water-wet porous media. Ground Water 42:734-746.