This is the published version of a paper published in Environmental Research Letters.
Citation for the original published paper (version of record):
Abbott, B W., Jones, J B., Schuur, E A., Chapin, F S., Bowden, W B. et al. (2016)
Biomass offsets little or none of permafrost carbon release from soils, streams, and wildfire: an
expert assessment.
Environmental Research Letters, 11(3): 034014
http://dx.doi.org/10.1088/1748-9326/11/3/034014
Access to the published version may require subscription.
N.B. When citing this work, cite the original published paper.
Permanent link to this version:
LETTER
Biomass offsets little or none of permafrost carbon release from
soils, streams, and wildfire: an expert assessment
Benjamin W Abbott1,2
, Jeremy B Jones2
, Edward A G Schuur3
, F Stuart Chapin III2
, William B Bowden4 , M Syndonia Bret-Harte2 , Howard E Epstein5 , Michael D Flannigan6 , Tamara K Harms2 ,
Teresa N Hollingsworth7, Michelle C Mack3, A David McGuire8, Susan M Natali9, Adrian V Rocha10,
Suzanne E Tank11, Merritt R Turetsky12, Jorien E Vonk13, Kimberly P Wickland14, George R Aiken14,
Heather D Alexander15, Rainer M W Amon16, Brian W Benscoter17, Yves Bergeron18, Kevin Bishop19,20,
Olivier Blarquez21, Ben Bond-Lamberty22, Amy L Breen23, Ishi Buffam24, Yihua Cai25,
Christopher Carcaillet26, Sean K Carey27, Jing M Chen28, Han Y H Chen29, Torben R Christensen30,31,
Lee W Cooper32, J Hans C Cornelissen33, William J de Groot34, Thomas H DeLuca35, Ellen Dorrepaal36,
Ned Fetcher37, Jacques C Finlay38, Bruce C Forbes39, Nancy H F French40, Sylvie Gauthier41,
Martin P Girardin41, Scott J Goetz9, Johann G Goldammer42, Laura Gough43, Paul Grogan44, Laodong Guo45,
Philip E Higuera46, Larry Hinzman47, Feng Sheng Hu48, Gustaf Hugelius49, Elchin E Jafarov50, Randi Jandt51,
Jill F Johnstone52 , Jan Karlsson36 , Eric S Kasischke53 , Gerhard Kattner54 , Ryan Kelly55 , Frida Keuper36,56 , George W Kling57 , Pirkko Kortelainen58 , Jari Kouki59 , Peter Kuhry60 , Hjalmar Laudon61 , Isabelle Laurion62 , Robie W Macdonald63 , Paul J Mann64 , Pertti J Martikainen65 , James W McClelland66 , Ulf Molau67 , Steven F Oberbauer68 , David Olefeldt69 , David Paré41 , Marc-André Parisien70 , Serge Payette71 , Changhui Peng72,73 , Oleg S Pokrovsky74,75 , Edward B Rastetter76 , Peter A Raymond77 , Martha K Raynolds78 , Guillermo Rein79 , James F Reynolds80,81 , Martin Robards82 , Brendan M Rogers9 , Christina Schädel3 , Kevin Schaefer83, Inger K Schmidt84, Anatoly Shvidenko85,86, Jasper Sky87, Robert G M Spencer88,
Gregory Starr89, Robert G Striegl14, Roman Teisserenc90, Lars J Tranvik91, Tarmo Virtanen92,
Jeffrey M Welker93and Sergei Zimov94
1 Université de Rennes 1, OSUR, CNRS, UMR 6553 ECOBIO, France
2 Institute of Arctic Biology and Department of Biology & Wildlife, University of Alaska Fairbanks, USA 3 Center for Ecosystem Science and Society, Northern Arizona University, USA
4 The Rubenstein School of Environment and Natural Resources, University of Vermont, USA 5 Department of Environmental Sciences, University of Virginia, USA
6 Department of Renewable Resources, University of Alberta, Canada
7 USDA Forest Service, PNW Research Station, University of Alaska Fairbanks, USA
8 US Geological Survey, Alaska Cooperative Fish and Wildlife Research Unit, University of Alaska Fairbanks, USA 9 Woods Hole Research Center, USA
10 Department of Biological Sciences and the Environmental Change Initiative, University of Notre Dame, USA 11 Department of Biological Sciences, University of Alberta, Canada
12 Department of Integrative Biology, University of Guelph, Canada 13 Department of Earth Sciences, VU University Amsterdam, The Netherlands 14 US Geological Survey, National Research Program, Boulder, CO, USA
15 Mississippi State University, Forest and Wildlife Research Center, MS 39762, USA 16 Texas A&M University at Galveston, USA
17 Florida Atlantic University, USA
18 Forest Research Institute, Université du Québec en Abitibi-Témiscamingue, Canada 19 Department of Earth Sciences, Uppsala University, Sweden
20 Department of Aquatic Sciences and Assessment, Swedish University of Agricultural Sciences, Sweden 21 Département de Géographie, Université de Montréal, Canada
22 Pacific Northwest National Lab, USA
23 Scenarios Network for Alaska & Arctic Planning, International Arctic Research Center, University of Alaska Fairbanks, USA 24 University of Cincinnati, USA
25 State Key Laboratory of Marine Environmental Science, Xiamen University, People’s Republic of China 26 Ecole Pratique des Hautes Etudes, UMR5023 CNRS Lyon 1, France
27 McMaster University, Canada 28 University of Toronto, Canada
29 Faculty of Natural Resources Management, Lakehead University, Canada 30 Lund University, Arctic Research Centre, Sweden
31 Aarhus University, Denmark
32 University of Maryland Center for Environmental Science, USA 33 Systems Ecology, VU University, The Netherlands
34 Canadian Forest Service, Natural Resources Canada, Canada
OPEN ACCESS RECEIVED
26 November 2015
REVISED
15 February 2016
ACCEPTED FOR PUBLICATION
16 February 2016
PUBLISHED
7 March 2016
Original content from this work may be used under the terms of theCreative Commons Attribution 3.0 licence.
Any further distribution of this work must maintain attribution to the author(s) and the title of the work, journal citation and DOI.
35 School of Environmental and Forest Sciences, University of Washington, USA
36 Climate Impacts Research Centre, Department of Ecology and Environmental Science, Umeå University, Sweden 37 Institute for Environmental Science and Sustainability, Wilkes University, USA
38 Department of Ecology, Evolution and Behavior, University of Minnesota, USA 39 Arctic Centre, University of Lapland, Finland
40 Michigan Tech Research Institute, Michigan Technological University, USA
41 Natural Resources Canada, Canadian Forest Service, Laurentian Forestry Centre, Canada 42 Global Fire Monitoring Center, Max Planck Institute for Chemistry, Germany
43 Department of Biological Sciences, Towson University, USA 44 Department of Biology, Queen’s University, Canada
45 University of Wisconsin-Milwaukee, School of Freshwater Sciences, USA 46 Department of Ecosystem and Conservation Sciences, University of Montana, USA 47 University of Alaska Fairbanks, USA
48 Department of Plant Biology and Department of Geology, University of Illinois, USA 49 Department of Physical Geography, Stockholm University, Sweden
50 Institute of Arctic and Alpine Research, University of Colorado Boulder, USA 51 Alaska Fire Science Consortium, University of Alaska Fairbanks, USA 52 Biology Department, University of Saskatchewan, Canada
53 Department of Geographical Sciences, University of Maryland, USA
54 Alfred Wegener Institute Helmholtz Center for Polar and Marine Research, Germany 55 Neptune and Company Inc., USA
56 INRA, AgroImpact UPR1158, France 57 University of Michigan, USA 58 Finnish Environment Institute, Finland
59 School of Forest Sciences, University of Eastern Finland, Finland 60 Department of Physical Geography, Stockholm University, Sweden
61 Department of Forest Ecology and Management, Swedish University of Agricultural Sciences, Umeå, Sweden 62 Centre Eau Terre Environnement, Institut national de la recherche scientifique, Canada
63 Department of Fisheries and Oceans, Institute of Ocean Sciences, Canada 64 Department of Geography, Northumbria University, UK
65 Department of Environmental and Biological Sciences, University of Eastern Finland, Finland 66 University of Texas at Austin, Marine Science Institute, USA
67 Department of Biological and Environmental Sciences, University of Gothenburg, Sweden 68 Department of Biological Sciences, Florida International University, USA
69 Department of Revewable Resources, University of Alberta, Canada
70 Natural Resources Canada, Canadian Forest Service, Northern Forestry Centre, Canada 71 Centre d’études Nordiques, Université Laval, Canada
72 Center of CEF/ESCER, University of Quebec at Montreal, Canada
73 State Key Laboratory of Soil Erosion and Dryland Farming on the Loess Plateau, College of Forestry, Northwest A&F University, People
’s Republic of China
74 Georesources and Environment, CNRS, Toulouse, France 75 BIO-GEO-CLIM Laboratory, Tomsk State University, Russia
76 The Ecosystems Center, Marine Biological Laboratory, Woods Hole, USA 77 Yale School of Forestry and Environmental Studies, USA
78 Institute of Arctic Biology, University of Alaska Fairbanks, USA 79 Department of Mechanical Engineering, Imperial College London, UK 80 School of Life Sciences, Lanzhou University, People’s Republic of China 81 Nicholas School of the Environment, Duke University, USA
82 Wildlife Conservation Society, Arctic Beringia Program, USA
83 National Snow and Ice Data Center, Cooperative Institute for Research in Environmental Sciences, University of Colorado
Boulder, USA
84 Department of Geosciences and Natural Resource Management, University of Copenhagen, Denmark 85 International Institute for Applied Systems Analysis, Laxenburg, Austria
86 Sukachev Institute of Forest, Russia
87 Cambridge Centre for Climate Change Research, UK
88 Department of Earth, Ocean & Atmospheric Science, Florida State University, USA 89 Department of Biological Sciences, University of Alabama, USA
90 ECOLAB, Université de Toulouse, CNRS, INPT, UPS, Toulouse, France 91 Limnology, Department of Ecology and Genetics, Uppsala University, Sweden 92 Department of Environmental Sciences, University of Helsinki, Finland 93 University of Alaska Anchorage, USA
94 Northeast Science Station of the Russian Academy of Sciences, Russia
E-mail:benabbo@gmail.com
Keywords: permafrost carbon, Arctic, boreal, wildfire, dissolved organic carbon, particulate organic carbon, coastal erosion Supplementary material for this article is availableonline
Abstract
As the permafrost region warms, its large organic carbon pool will be increasingly vulnerable to
decomposition, combustion, and hydrologic export. Models predict that some portion of this release
will be offset by increased production of Arctic and boreal biomass; however, the lack of robust
estimates of net carbon balance increases the risk of further overshooting international emissions
targets. Precise empirical or model-based assessments of the critical factors driving carbon balance are
unlikely in the near future, so to address this gap, we present estimates from 98 permafrost-region
experts of the response of biomass, wild
fire, and hydrologic carbon flux to climate change. Results
suggest that contrary to model projections, total permafrost-region biomass could decrease due to
water stress and disturbance, factors that are not adequately incorporated in current models.
Assessments indicate that end-of-the-century organic carbon release from Arctic rivers and collapsing
coastlines could increase by 75% while carbon loss via burning could increase four-fold. Experts
identified water balance, shifts in vegetation community, and permafrost degradation as the key
sources of uncertainty in predicting future system response. In combination with previous
findings,
results suggest the permafrost region will become a carbon source to the atmosphere by 2100
regardless of warming scenario but that 65%–85% of permafrost carbon release can still be avoided if
human emissions are actively reduced.
Introduction
Permafrost zone carbon balance
The United Nations has set a target of limiting warming to 2°C above pre-industrial temperatures to mitigate risk of the most damaging consequences of climate change (UNEP 2013). Maintaining global
climate within this target depends on understanding ecosystem feedbacks to climate change so that ade-quate limits on human emissions can be set. As high latitudes warm, more of the large permafrost carbon pool will be exposed to decomposition, combustion, and hydrologic export (Harden et al 2012, Schuur et al2015). Up to 220 Petagrams (Pg) carbon could be
released from permafrost-region soil by 2100, and 500 Pg by 2300(MacDougall et al2012, Schuur et al2013),
representing 10%–30% of greenhouse gas emissions required to push the global climate system beyond the 2°C target (Schaefer et al2014). Models project that
some permafrost carbon release will be offset by increases in Arctic and boreal primary productivity due to extended growing season, CO2fertilization, and
nutrient release from decomposing soil organic mat-ter. However, many processes and dynamics known to influence biomass accumulation, such as ecosystem disturbance and nutrient limitation, are incompletely represented or absent in current models (Qian et al2010, Koven et al2011, Schaefer et al2011, Koven et al2015b). Likewise, only a few models projecting
future permafrost carbon release consider wildfire emissions, and none include hydrologic carbonflux (Qian et al2010, Koven et al2011, Schaefer et al2011, MacDougall et al2012, Schaefer et al 2014), though
past hydrologic flux has been simulated (McGuire et al2010, Laudon et al2012, Kicklighter et al2013).
Despite clear policy implications of this climate feed-back, considerable uncertainty of both carbon inputs
and outputs limits our ability to model carbon balance of the permafrost region. To bring to bear the best available quantitative and qualitative scientific infor-mation(Joly et al2010) on this climate feedback, we
present results from expert assessment surveys indi-cating that there is little consensus on the magnitude and even sign of change in high-latitude biomass, whereas most researchers expect fire emissions and hydrologic organic carbon flux to substantially increase by the end of the century.
Expert assessment
When data are sparse but management decisions are pressing, expert judgements have long been used to constrain possible system response and risk of danger-ous or undesired outcomes(Zickfeld et al2010, Mor-gan2014). There are multiple methods for collecting
and combining expert opinion including formal expert elicitation interviews, interactive software, and surveys (Aspinall2010, Javeline et al2013, Morgan2014). While
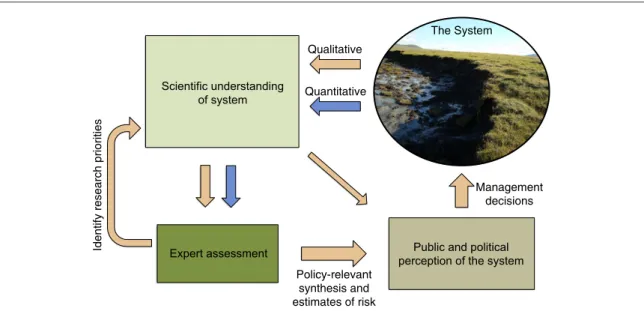
expert assessment cannot definitively answer questions of future system response, it complements modeling and empirical approaches by allowing the synthesis of formal and informal system information and by identifying research priorities (figure 1; Sutherland et al2013, Morgan2014). The approach is similar to the
concept of ensemble models where multiple estimates built on different assumptions and data provide a more robust estimate and measure of variance. Because the experimental unit is an individual researcher, each data point represents an integration of quantitative knowl-edge from modeling,field, and laboratory studies as well as qualitative information based on professional opinion and personal experience with the system. Expert assessment has been used in risk assessment and forecasting of natural disasters, human impacts on ecosystems, and tipping points in the climate system
(Halpern et al2008, Lenton et al2008, Aspinall2010).
In a data-limited environment such as the permafrost region, expert assessment allows formal consideration of a range of factors known to affect carbon balance but insufficiently quantified for inclusion in models. For permafrost carbon balance, these factors include nutri-ent dynamics, nonlinear shifts in vegetation commu-nity, human disturbance, land–water interactions, and the relationship of permafrost degradation with water balance.
Because precise empirical or model-based assess-ments of the critical factors driving permafrost-region carbon balance are unlikely in the near future(Harden et al2012), we collected estimates of the components
of net ecosystem carbon balance from 98 permafrost-region experts(table1). We had two major goals: (1)
Assess current understanding of the timing and mag-nitude of non-soil biomass accumulation, hydrologic organic carbon flux, and wildfire carbon emissions, and(2) Identify major sources of uncertainty in high-latitude carbon balance to inform future research.
Methods
Survey development and design
In the fall of 2013 we administered three expert assessments to address knowledge gaps concerning the response of permafrost-region biomass, wildfire, and hydrologic carbonflux to climate change. Develop-ment of assessDevelop-ment methodology began in early 2009 as a part of the Dangerous Climate Change Assessment Project administered by the University of Oxford. We iteratively revised questions, response format, and background information based on four rounds of input from participants, including at the Vulnerability
of Permafrost Carbon Research Coordination Net-work meeting in Seattle 2011(Schuur et al2013). To
help survey participants consider all of the evidence available fromfield and modeling studies, we distrib-uted a system summary document for each question-naire including regional and pan-Arctic estimates of current carbon pools andfluxes, a brief treatment of historical trends, and a summary of model projections Figure 1. Conceptual model of the role of expert assessment in generating and communicating scientific understanding. Modeling andfield research generate quantitative and qualitative understanding of the system (in this case the permafrost zone). Expert assessment synthesizes current understanding including qualitative information not yet included in numerical models orfield studies. These syntheses provide perspective to the scientific community and wholistic summaries of the state of the knowledge to the non-scientific community with the goal of improving management of the system.
Table 1. Composition and characteristics of participant group. Biomass Wildfire Hydrologicflux Number of
respondents
46 34 35
Average responses per questiona
41 28 32
Primary region of study
Asia 10 3 8
Europe 12 5 9
North America 27 27 18
Circumpolar 12 6 9
Primary biome of study
Arctic 31 13 27
Boreal 27 29 18
Both 14 9 12
Average modeling/ field self ratingb
3.6 3.7 4.1
Combined years of experience
762 533 521
Ratio male:female 2.6 2.8 4.9 Background information on survey participants. Experts could indicate multiple regions and biomes of study.
aNot all experts provided estimates for all questions.
bExperts rated themselves on a 1–5 scale where 1=exclusive
where available(table2; supplementary information questionnaires and system summaries).
Participants were selected based on contribution to peer-reviewed literature or referrals from other experts and had experience in all major boreal and Arctic regions(table1). We identified potential
parti-cipants by querying Thomas Reuters Web of Science (webofknowledge.com) with applicable search terms (e.g. Arctic, boreal, biomass, dissolved organic carbon, fire, permafrost). To reach researchers with applicable expertise who were underrepresented in the literature, we supplemented the list with personal referrals from lead experts and all participants. In total 256 experts were invited to participate. We distributed the surveys and system summaries via email with a two-week deadline. After sending out three reminders and accepting responses for three months after initial invi-tation, we received 115 responses from 98 experts (38% response rate), with 15 experts participating in more than one survey(supplementary information list
of experts). Experts who provided estimates and input to this paper are coauthors.
Experts provided quantitative estimates of change in biomass, hydrologicflux, or wildfire for three time points (2040, 2100, and 2300), and four regional warming scenarios based on representative concentra-tion pathway(RCP) scenarios from the IPCC Fifth Assessment Report(Moss et al2010). Warming
sce-narios ranged from cessation of human emissions before 2100(RCP2.6) to sustained human emissions (RCP8.5) and corresponded to permafrost-region mean annual warming of 2°C–7.5 °C by 2100. All sur-veys were driven by the same scenarios of high-latitude warming generated from RCP2.6, 4.5, 6.0, and 8.5 with the National Center for Atmospheric Research's Community Climate System Model 4 (Lawrence et al2012). For the purposes of this survey, warming
was assumed to stabilize at 2100 levels for all scenarios so that estimates for the 2300 time point would account for lags in ecosystem responses to climate dri-vers. While climate scenarios were defined by Table 2. Estimates of current permafrost region organic carbon pools andfluxes. Literature-based estimates of belowground biomass were calculated from aboveground or total biomass with ratios from Saugier et al(2001). POC delivery to freshwater ecosystems was calculated
from ocean POC delivery with downscaled global ratio of 0.75 for sedimentation. POC from coastal erosion is the sum of Vonk et al(2012)
and McGuire et al(2009). Considerable uncertainty remains around many of these estimates.
Biomass
Aboveground biomass
Belowground
biomassa Dead woodb Litter
Total non-soil biomass Boreal forest(Pg C) 43.6c 16.1 16 27b 102.7 Arctic Tundra(Pg C) 2.4d 4.0 2e 8.4 Wildfire Boreal forest (Eurasia) Boreal forest (N. America) Total Boreal forestf Total Tundra Area burned(km2yr−1) 62 100 22 500 84 600 4200g
CO2emissions fromfire (Tg C yr−1)
194 56 250 8h
Hydrologic organic carbonflux
DOC POC
(Riverine)
POC (coastal)
Total OC Delivery to freshwater
eco-systems(Tg yr-1)
100c 20i na 120
Delivery to Arctic Ocean and surrounding seas (Tg yr-1) 36j 6c 18ck 60 aSaugier et al(2001). bPan et al(2011). cMcGuire et al(2009). dEpstein et al(2012). ePotter and Klooster(1997).
fBalshi et al(2007), Giglio et al (2010), Hayes et al (2011), van der Werf et al (2010). gRocha et al(2012).
hMack et al(2011).
iAufdenkampe et al(2011), Battin et al (2009). jHolmes et al(2012).
temperature, we asked experts to consider all accom-panying direct climate effects(e.g. temperature, pre-cipitation, and atmospheric CO2) and indirect effects
(e.g. vegetation shifts, permafrost degradation, inva-sive species, and disturbance). Experts were encour-aged to consider all available formal and informal information when generating their estimates includ-ing published and unpublished modeled and empiri-cal data as well as professional judgment. Participants listed the major sources of uncertainty in their esti-mates, self-rated their confidence and expertise for each question, described rationale for their estimates, and provided background information (table 1
and S1).
The biomass survey consisted of a single question asking for cumulative change in tundra and boreal non-soil biomass including above and belowground living biomass, standing deadwood, and litter. The wildfire survey asked for estimates of change in wild-fire extent and CO2emissions for the boreal and
tun-dra regions to assess changes in bothfire extent and severity. The hydrologic flux survey asked for esti-mates of dissolved and particulate organic carbon (DOC and POC, respectively) delivery to freshwater ecosystems in the pan-Arctic watershed and delivery to the Arctic Ocean and surrounding seas via riverine flux and coastal erosion, allowing the calculation of losses during transport due to burial or mineraliza-tion. Dissolved inorganic carbon fluxes were not included in this survey.
The original questionnaires in 2009 asked for par-ticipants to estimate subjective 95% confidence inter-vals of the whole system response(e.g. total change in high-latitude biomass). Based on expert input during subsequent testing we disaggregated the system into different components to encourage detailed con-sideration of possibly competing dynamics(e.g. asking for separate estimates of boreal forest and Arctic tun-dra response; Morgan2014). This resulted in a large
response table for each question(72–102 quantitative estimates), which we found caused respondent fatigue and decreased the number of experts willing to partici-pate. As a compromise, we asked respondents to pro-vide a single best estimate and indicate confidence with afive-point scale (table S1). While analysis of best estimates can return narrower uncertainty ranges than subjective probability distributions (Morgan 2014),
we believe this tradeoff resulted in broader expert par-ticipation, better representing diversity of opinion across disciplines and compensating for possible underestimation of variability and uncertainty. Analysis and calculations
We calculated basic summary statistics, using median values to estimate center and interquartile ranges (IQR) to estimate spread. To calculate the portion of permafrost carbon release offset by biomass accumu-lation, we combined estimates from this study with
reanalyzed data from Schuur et al(2013). The low IQR
for carbon release offset by biomass growth was calculated by dividing the low IQR of uptake by the upper IQR of carbon release and conversely for the high IQR(figure3). All analyses were performed in R
3.0.2. The complete dataset of quantitative estimates and comments from survey participants stripped of personal identifiers is available atwww.aoncadis.org/ dataset/Permafrost_carbon_balance_survey.html.
Results
Carbon pools andfluxes
Expert estimates revealed diverging views on the response of boreal biomass to warming, with over a third of estimates predicting a decrease or no change in boreal biomass across scenarios and time periods (figure2). While median change in boreal biomass was
similar across warming scenarios for each time step (3%, 9%, and 11% increases by 2040, 2100, and 2300, respectively; figure 2 and S1), variability was much higher for warmer scenarios. Consequently, all of the IQR of change in boreal biomass for RCP6.0 and RCP8.5 included zero. Experts projecting a decrease in boreal biomass attributed their estimates primarily to water-stress and disturbance such asfire and perma-frost degradation. In contrast, there was general agreement that tundra biomass would respond posi-tively to warming, with end-of-century increases of 6%–30% projected for RCP2.6 and 10%–90% for RCP8.5. Because of these contrasting responses to increased warming, tundra accounted for 40% of total biomass gain by 2300 for RCP8.5, though it currently constitutes less than 10% of total permafrost region biomass(based on median values in figures2,3(a) and
table2). Estimates of boreal biomass were generally
symmetrically distributed while tundra biomass esti-mates were right-skewed, and most datasets had 1–4 estimates beyond 1.5 times the interquartile range (figure S2). Self-rated confidence was higher for tundra than for boreal forest, but was below 3(moderately confident) in both cases (table S1), highlighting considerable uncertainty of individual estimates in addition to variability among respondents.
Experts projected major shifts in both fire and hydrologic carbon regimes, with up to a 75% increase of riverine organic carbonflux to the ocean and a four-fold increase in fire emissions by 2100 for RCP8.5 based on IQR(figure2and S1). Fire and hydrologic carbon release estimates peaked at 2100, followed by a 10%–40% decrease by 2300. In contrast to biomass, the response of bothfire-driven and hydrologic car-bon flux varied strongly by warming scenario, with RCP8.5 resulting in 2–6 times more carbon release than RCP2.6. While the boreal forest dominated total wildfire emissions, the relative change in tundra fire emissions was 1.5- and 2-fold greater than the relative boreal response for 2100 and 2300, respectively(figure
S1). Increases in fire emissions were attributed to changes infire extent rather than severity, which var-ied less than 5% among scenarios and time periods. Though dissolved organic carbon(DOC) represented the majority of total hydrologic organic carbon release, experts projected higher relative increases for coastal POC, with end-of-the-century increases of 6%–50% for RCP2.6 and 13%–190% for RCP8.5. There was a lack of consensus on the response of DOC delivery to the ocean, with 21% of estimates predicting a decrease or no change. Experts predicting a decrease attributed their estimates to increased mineralization, changes in hydrologicflowpath, and changes in DOC photo- and bio-lability (Cory et al 2014, Abbott et al 2014). Responses indicated no change in the
proportion of organic carbon mineralized or trapped in sediment before reaching the ocean, with 63%–69% of DOC and 68%–74% of POC lost in transport. Fire and hydrologic carbon flux estimates were strongly right-skewed with a few experts projecting extreme change well beyond 1.5 times the interquartile range for each timestep and warming scenario combination (figures S3 and S4). Average self-rated confidence was between 2 and 3 for all questions except tundrafire emissions which had average confidence of 2.0 and 1.7 (table S1).
Sources of uncertainty
Along with quantitative estimates of carbon balance, experts identified sources of uncertainty currently Figure 2. Estimates of change in non-soil biomass, wildfire emissions, and hydrologic carbon flux from the permafrost region for four warming scenarios at three time points. All values represent change from current pools orfluxes reported in table2. Biomass includes above and belowground living biomass, standing deadwood, and litter. Dissolved and particulate organic carbon(DOC and POC respectively) fluxes represent transfer of carbon from terrestrial to aquatic ecosystems. ‘Coast’ represents POC released by coastal erosion. Representative concentration pathway(RCP) scenarios range from aggressive emissions reductions (RCP2.6) to sustained human emissions(RCP8.5). Box plots represent median, quartiles, and minimum and maximum within 1.5 times the interquartile range. Relative change(percent change from current state) is presented in figure S1 and full distributions are presented in figures S2–S4.
limiting the prediction of system response to climate change(table3). Water balance, including
precipita-tion, soil moisture, runoff, infiltration, and discharge, was the most frequently mentioned source of uncer-tainty for both biomass and hydrologic organic carbon
flux, and the second most mentioned for wildfire. Many experts noted that water balance is as or more important than temperature in controlling future carbon balance, yet projections of water balance are less well constrained(Zhang et al2013, Bintanja and Figure 3. Total change in non-soil biomass(a) and percentage of permafrost region carbon release offset by change in non-soil
biomass(b). Estimates of permafrost carbon release used in estimating percentage offset are recalculated from data presented in Schuur et al(2013). See figure2for definition of RCP scenarios and symbology. Error bars represent propogated error between the interquartile ranges of carbon release from permafrost soil and carbon uptake by biomass(see methods).
Table 3. Sources of uncertainty in system response to climate change.
Biomass Wildfire Hydrologic OCflux
Source of uncertainty % Source of uncertainty % Source of uncertainty % Water balance 56 Vegetation shift 73 Water balance 41
Wildfire 47 Water balance 58 Hydrologicflowpath 39
Permafrost degradation 40 Human disturbance 27 Permafrost degradation 24 Human disturbance 29 Permafrost degradation 18 Photo and bio-lability 24
Insect damage 27 Seasonality 15 Vegetation shift 20
Vegetation shift 24 Regional differences 12 Fluvial erosion 11 Treeline dynamics 16
Nutrient availability 13 Non-insect herbivores 11
Major factors contributing uncertainty to projections of future system response based on expert comments. Rank is based on percent of experts who listed each factor in their responses. All sources listed by 10% or more of each group are included here. Water balance includes comments mentioning precipitation, soil moisture, runoff, infiltration, or discharge. Permafrost degradation includes comments referring to permafrost collapse (thermokarst) and active layer deepening.
Selten2014). Almost three-quarters of wildfire experts
identified the future distribution of vegetation as the primary source of uncertainty in projecting wildfire, noting strong differences in flammability between different boreal and tundra species. Permafrost degra-dation was identified as an important source of uncertainty for biomass, hydrologicflux, and wildfire, due to both disturbance from ground collapse (ther-mokarst) and interactions with water-table dynamics and surface soil moisture as deeper thaw affects soil drainage.
Discussion
Carbon balance
Arctic tundra and boreal forest have accumulated a vast pool of organic carbon, twice as large as the atmospheric carbon pool and three times as large as the carbon contained by all living things (Hugelius et al2014, Schuur et al 2015). Over the past several
decades, the permafrost region has removed an average of 500 Tg carbon yr−1from the atmosphere (McGuire et al2009, Pan et al2011, Hayes et al2011).
Combining our estimates of biomass uptake with a recent projection of permafrost soil carbon release
(Schuur et al2013) suggests that the permafrost region
will become a carbon source to the atmosphere by 2100 for all warming scenarios(figure3(b)). Experts
predicted that boreal and Arctic biomass could respond more quickly to warming than soil carbon release, offsetting −33% to 200% of mid-century emissions from permafrost-region soil (figure3(b)).
However, because estimates of change in biomass are similar across warming scenarios but permafrost carbon release is strongly temperature-sensitive, the emissions gap widens for warmer scenarios, resulting infive-times more net carbon release under RCP8.5 than RCP2.6. This suggests that 65 to 85% of permafrost carbon release could be avoided if human emissions are actively reduced—i.e. if emissions follow RCP2.6 instead of RCP8.5(figure4).
Comparison with quantitative models
Model projections of future boreal and Arctic biomass agree in sign but vary widely in magnitude, with increases of 9–61 Pg carbon projected by 2100 (Qian et al2010, Koven et al2011, Schaefer et al2011, Falloon et al2012). While some of these models fall within the
range estimated here of−20 to 28 Pg carbon by 2100, none include zero or negative change in biomass as Figure 4. A comparison of soil carbon release recalculated from Schuur et al(2013) and non-soil biomass uptake in the permafrost
region from this study for the business as usual scenario(RCP8.5) and the active reduction of human emissions scenario (RCP2.6). Polygons represent median cumulative change and dotted lines represent the interquartile range. Biomass carbon uptake is overlayed on soil carbon release to show the proportion of carbon release potentially offset by biomass. Linear rates of change were assumed between the three dates where estimates were provided.
predicted by over a third of participants in our expert assessment. Two potential reasons for this disagree-ment are an overestimation of the effect of CO2
fertilization or an underestimation of the role of disturbance in some models. Firstly, CO2fertilization
exerts a larger effect on carbon balance than all other climate effects in many models(Balshi et al2009), with
up to 88 Pg carbon difference between model runs with and without CO2 fertilization effects for some
models(Koven et al2011). However, there is little field
evidence that CO2 fertilization results in long-term
biomass accumulation in tundra and boreal ecosys-tems (Hickler et al 2008, Gedalof and Berg 2010, Peñuelas et al2011). Additionally, many models with
large CO2effects do not include other limiting factors,
such as nutrients and water, known to interact with CO2 fertilization (Hyvonen et al 2007, Thornton
et al 2007, Yarie and Van Cleve 2010, Maaroufi
et al2015, Koven et al2015a). Secondly, models that
do not account for disturbance such as wildfire, permafrost collapse, insect damage, and human resource extraction likely overestimate the positive response of biomass to climate change (Kurz et al2008, Abbott and Jones2015, Hewitt et al2015).
Considering the scenario of a complete biome shift is useful in evaluating both model projections of change and estimates from our expert assessment. If all boreal forest became temperate forest, living bio-mass would increase by 27%, resulting in the uptake of 16 Pg carbon based on average carbon densities from both ecosystems(Pan et al2011). However, 22 Pg
car-bon would be lost due to decreases in dead wood and litter, resulting in a net circumboreal loss of 6 Pg car-bon. If all tundra became boreal forest, non-soil bio-mass would increase by 205% (Saugier et al 2001, Epstein et al 2012, Raynolds et al 2012), taking up
17 Pg carbon. This scenario may not represent the upper limit of possible carbon uptake if other unfore-seen shifts in C allocation take place; however, it high-lights the relatively modest carbon gains probable on century timescales.
While regional projections from models of boreal wildfire vary in sign and magnitude (supplementary information system summaries), most models agree that at the circumboreal scale, fire emissions will increase several-fold, with increases of 200%–560% projected by the end of the century (Flannigan et al2009, Kloster et al2012). IQR from our study are
somewhat lower(40% to 300%, median 170%), but participant confidence in these estimates was low, sug-gesting considerable uncertainty in the future response of borealfire. The 60%–480% increase in tundrafire projected by our study would represent an even larger ecological shift than experienced by the boreal forest, with implications for regional biomass, habitat, and carbon balance, though there are few models that project changes in tundra fire (Rupp et al 2000) and none at a circumarctic scale (Mack
et al2011).
The production of Arctic DOC and POC depends on abundance of carbon sources in terrestrial ecosys-tems (influenced by biomass, wildfire, temperature, and permafrost degradation) and the ability of hydro-logicflow to transport that carbon (determined by fac-tors such as precipitation, runoff, depth of flow through soil, and coastal erosion; Guo et al2007, Kick-lighter et al 2013, Abbott et al 2015, Larouche et al2015). Due to these complexities and others, there
are currently no quantitative projections of future DOC and POCflux from the circumarctic. However, estimates from our study suggest a substantial depar-ture from historical rates of change. For RCP8.5, hydrologic organic carbon loading would increase 4–20 times faster in the 21st century than it did in the 20th(Kicklighter et al2013), representing a nonlinear
response to high-latitude warming. The lack of con-sensus on the response of DOC, the largest component of hydrologic organic carbon flux, highlights the importance of developing and testing conceptual fra-meworks to be incorporated into models (Laudon et al2012).
An alternative explanation for differences between expert estimates and modeled projections is the possi-bility of bias in the group of experts. Participants in our assessment tended to have morefield than model-ing experience(table1) and may have therefore been
skeptical of simulated ecosystem responses that have not been observed in thefield such as CO2fertilization
and rapid migration of treeline(McGuire et al2009).
Because future dynamics cannot always reliably be predicted on the basis of past system behavior, this bias may or may not result in overly conservative estimates. Furthermore, because experts are likely to base projec-tions on the study areas with which they are most familiar, regional differences could be a source of bias. Fundamental differences among regions in the response of DOC flux and fire-regime to warming have been observed(Kicklighter et al2013, de Groot et al2013; supplementary information system sum-maries). Asia, which represents more than half of the total permafrost region, was under-represented in all three surveys, particularly wildfire (table1). However,
the regional bias in this study may not be greater than that of model projections, which depend on observa-tional and experimental data that are not evenly dis-tributed throughout the permafrost region.
Reducing uncertainty surrounding the permafrost carbon feedback
Experts identified water balance, vegetation distribu-tion, and permafrost degradation as the most impor-tant sources of uncertainty in predicting the timing and magnitude of the permafrost carbon feedback (table3). These three processes are closely
intercon-nected by several internal feedbacks(Anisimov and Reneva 2006, Shur and Jorgenson 2007, Jorgenson et al2013, Girardin et al2016). For example, wildfire
or drought can trigger a transition from coniferous to deciduous dominance, warming permafrost by up to 7°C due to loss of insulating moss and associated changes(Sturm et al2001, Shur and Jorgenson2007, Yarie and Van Cleve2010). The subsequent recovery
trajectories of vegetation and permafrost, as well as the proportion of thawed carbon released CO2 or CH4,
then depend largely on near-surface hydrologic condi-tions (Payette et al 2004, Myers-Smith et al 2008, Jorgenson et al2010, Chapin et al2010, O'Donnell et al2011, Lawrence et al2015). These interdepencies
mean that improving projections of the permafrost carbon feedback will require conceptualizing these parameters together. The question of water balance is additionally important in Arctic and boreal ecosys-tems where hydrologic carbonflux can be the deter-mining factor causing net carbon uptake or release (Kling et al1991, Aufdenkampe et al2011, Raymond et al2013). The lack of model projections of hydrologic
carbonfluxes is a major gap in our ability to estimate the permafrost carbon feedback.
The permafrost region has responded differently to various climatic perturbations in the past, repre-senting another tool to constrain possible future response(Zachos et al2008). During the Paleocene–
Eocene thermal maximum, high-latitude temperature warmed more than 10°C, causing almost complete loss of permafrost and the mineralization of most per-mafrost soil organic matter(Bowen and Zachos2010, DeConto et al 2012). More recently, the 2 °C–4 °C
warming at high-latitudes during the early Holocene caused active-layer deepening throughout the perma-frost region but did not trigger complete permaperma-frost loss or widespread carbon release (French 1999, Schirrmeister et al2002, Jorgenson et al2013). While
there are many differences between the Paleozoic and Holocene warming events, one clear distinction is the degree of warming. There may have been a threshold between 4°C and 10 °C high-latitude warming due to positive feedbacks such as a shift from a coniferous to a deciduous dominated system or an abrupt change in hydrology. If a tipping point does exist between 4 and 10°C high-latitude warming, it would fall between scenarios RCP4.5 and RCP8.5, representing max-imum atmospheric CO2 of 650 ppm and 850 ppm,
respectively(Moss et al 2010, Lawrence et al 2012).
RCP4.5 is still widely accepted as politically and tech-nically attainable, though it assumes global CO2
emis-sions peak before 2050 and decrease by half by 2080 (Moss et al2010).
Conclusions
The permafrost climate feedback has been portrayed in popular media (and to a lesser extent in peer-reviewed literature) as an all-or-nothing scenario. Permafrost greenhouse gas release has been described as a tipping point, a runaway climate feedback, and,
most dramatically, a time bomb(Wieczorek et al2011, Treat and Frolking,2013, Whiteman et al2013). On
the other extreme, some have dismissed the impor-tance of this feedback, asserting that increases in biomass will offset any carbon losses from soil, or that changes will occur too slowly to concern current governments(Idso et al 2014). Our study highlights
that Arctic and boreal biomass should not be counted on to offset permafrost carbon release and suggests that the permafrost region will become a carbon source to the atmosphere by 2100 regardless of warming scenario. Perhaps more importantly, our results indicate a 5-fold difference in emissions between the business as usual scenario(RCP8.5) and active reduction of human emissions(RCP2.6), sug-gesting that up to 85% of carbon release from the permafrost region can still be avoided, though the window of opportunity for keeping that carbon in the ground is rapidly closing. Models projecting a strong boreal carbon sink and models that do not consider hydrologic and fire emissions may substantially underestimate net carbon release from the permafrost region. If such projections are used as the basis for emissions negotiations, climate targets are likely to be overshot.
Acknowledgments
Peter J Fix provided valuable input on the methods and manuscript. This work was supported by the National Science Foundation ARCSS program and Vulnerability of Permafrost Carbon Research Coordi-nation Network(grants OPP-0806465, OPP-0806394, and 955713) with additional funding from SITES (Swedish Science Foundation), Future Forest (Mistra), and a Marie Curie International Reintegration Grant (TOMCAR-Permafrost #277059) within the 7th European Community Framework Programme. This work complies with the US HHS Policy for Protection of Human Research Subjects. Any use of trade, firm, or product names is for descriptive purposes only and does not imply endorsement by the US Government.
References
Abbott B W and Jones J B 2015 Permafrost collapse alters soil carbon stocks, respiration, CH4, and N2O in upland tundra Glob. Change Biol.21 4570–87
Abbott B W, Jones J B, Godsey S E, Larouche J R and Bowden W B 2015 Patterns and persistence of hydrologic carbon and nutrient export from collapsing upland permafrost Biogeosciences12 3725–40
Abbott B W, Larouche J R, Jones J B, Bowden W B and Balser A W 2014 Elevated dissolved organic carbon biodegradability from thawing and collapsing permafrost J. Geophys. Res.: Biogeosciences119 2049–63
Anisimov O and Reneva S 2006 Permafrost and changing climate: the Russian perspective AMBIO: J. Hum. Environ.35 169–75
Aspinall W 2010 A route to more tractable expert advice Nature463 294–5
Aufdenkampe A K, Mayorga E, Raymond P A, Melack J M, Doney S C, Alin S R, Aalto R E and Yoo K 2011 Riverine coupling of biogeochemical cycles between land, oceans, and atmosphere Frontiers Ecology Environ.9 53–60
Balshi M S et al 2007 The role of historicalfire disturbance in the carbon dynamics of the pan-boreal region: a process-based analysis J. Geophys. Res.—Biogeo.112 G02029
Balshi M S, McGuire A D, Duffy P, Flannigan M,
Kicklighter D W and Melillo J 2009 Vulnerability of carbon storage in North American boreal forests to wildfires during the 21st century Glob. Change Biol.15 1491–510
Battin T J, Luyssaert S, Kaplan L A, Aufdenkampe A K, Richter A and Tranvik L J 2009 The boundless carbon cycle Nat. Geosci.2 598–600
Bintanja R and Selten F M 2014 Future increases in Arctic precipitation linked to local evaporation and sea-ice retreat Nature509 479–82
Bowen G J and Zachos J C 2010 Rapid carbon sequestration at the termination of the Palaeocene–Eocene thermal maximum Nat. Geosci.3 866–9
Chapin F S et al 2010 Resilience of Alaska's boreal forest to climatic change Can. J. Forest Res.—Rev. Can. Rech. Forestiere 40 1360–70
Cory R M, Ward C P, Crump B C and Kling G W 2014 Sunlight controls water column processing of carbon in arctic fresh waters Science345 925–8
DeConto R M, Galeotti S, Pagani M, Tracy D, Schaefer K, Zhang T J, Pollard D and Beerling D J 2012 Past extreme warming events linked to massive carbon release from thawing permafrost (vol 484, pg 87, 2012) Nature490 292
de Groot W J, Cantin A S, Flannigan M D, Soja A J, Gowman L M and Newbery A 2013 A comparison of Canadian and Russian boreal forestfire regimes Forest Ecology Manage.294 23–34
Epstein H E, Raynolds M K, Walker D A, Bhatt U S, Tucker C J and Pinzon J E 2012 Dynamics of aboveground phytomass of the circumpolar Arctic tundra during the past three decades Environ. Res. Lett.7 015506
Falloon P D, Dankers R, Betts R A, Jones C D, Booth B B B and Lambert F H 2012 Role of vegetation change in future climate under the A1B scenario and a climate stabilisation scenario, using the HadCM3C Earth system model Biogeosciences9 4739–56
Flannigan M, Stocks B, Turetsky M and Wotton M 2009 Impacts of climate change onfire activity and fire management in the circumboreal forest Glob. Change Biol.15 549–60
French H M 1999 Past and present permafrost as an indicator of climate change Polar Res.18 269–74
Gedalof Z E and Berg A A 2010 Tree ring evidence for limited direct CO2fertilization of forests over the 20th century Glob. Biogeochem. Cycles24 GB3027
Giglio L, Randerson J T, van der Werf G R, Kasibhatla P S, Collatz G J, Morton D C and DeFries R S 2010 Assessing variability and long-term trends in burned area by merging multiple satellitefire products Biogeosciences7 1171–86
Girardin M P, Hogg E H, Bernier P Y, Kurz W A, Guo X J and Cyr G 2016 Negative impacts of high temperatures on growth of black spruce forests intensify with the anticipated climate warming Glob. Change Biol.22 627–43
Guo L D, Ping C L and Macdonald R W 2007 Mobilization pathways of organic carbon from permafrost to arctic rivers in a changing climate Geophys. Res. Lett.34 L13603
Halpern B S et al 2008 A global map of human impact on marine ecosystems Science319 948–52
Harden J W et al 2012 Field information links permafrost carbon to physical vulnerabilities of thawing Geophys. Res. Lett.39 L15704
Hayes D J, McGuire A D, Kicklighter D W, Gurney K R, Burnside T J and Melillo J M 2011 Is the northern high-latitude land-based CO2sink weakening? Glob. Biogeochem. Cycles25 GB3018
Hewitt R, Bennett A, Breen A, Hollingsworth T, Taylor D L, Chapin F S III and Rupp T S 2015 Getting to the root of the
matter: landscape implications of plant–fungal interactions for tree migration in Alaska Landscape Ecol.6 1–17
Hickler T, Smith B, Prentice I C, Mjofors K, Miller P, Arneth A and Sykes M T 2008 CO2fertilization in temperate FACE experiments not representative of boreal and tropical forests Glob. Change Biol.14 1531–42
Holmes R M et al 2012 Seasonal and annualfluxes of nutrients and organic matter from large rivers to the Arctic ocean and surrounding seas Estuaries Coasts35 369–82
Hugelius G et al 2014 Estimated stocks of circumpolar permafrost carbon with quantified uncertainty ranges and identified data gaps Biogeosciences11 6573–93
Hyvonen R et al 2007 The likely impact of elevated CO2, nitrogen deposition, increased temperature and management on carbon sequestration in temperate and boreal forest ecosystems: a literature review New Phytol.173 463–80
Idso C D, Idso S B, Carter R M and Singer S F 2014 Climate Change Reconsidered: Biological Impacts Report of the
Nongovernmental International Panel on Climate Change (NIPCC) (Chicago, IL: Heartland Institute)
Javeline D, Hellmann J J, Cornejo R C and Shufeldt G 2013 Expert opinion on climate change and threats to biodiversity Bioscience63 666–73
Joly J L, Reynolds J and Robards M 2010 Recognizing when the‘best scientific data available’ isn't Stanford Environ. Law J. 29 247–82
Jorgenson M T, Romanovsky V, Harden J, Shur Y, O’Donnell J, Schuur E A G, Kanevskiy M and Marchenko S 2010 Resilience and vulnerability of permafrost to climate change Can. J. Forest Res.—Rev. Can. Rech. Forestiere40 1219–36
Jorgenson T et al 2013 Reorganization of vegetation, hydrology and soil carbon after permafrost degradation across
heterogeneous boreal landscapes Environ. Res. Lett.8 035017
Kicklighter D W, Hayes D J, McClelland J W, Peterson B J, McGuire A D and Melillo J M 2013 Insights and issues with simulating terrestrial DOC loading of Arctic river networks Ecological Appl.23 1817–36
Kling G W, Kipphut G W and Miller M C 1991 Arctic lakes and streams as gas conduits to the atmosphere - implications for tundra carbon budgets Science251 298–301
Kloster S, Mahowald N M, Randerson J T and Lawrence P J 2012 The impacts of climate, land use, and demography onfires during the 21st century simulated by CLM-CN Biogeosciences
9 509–25
Koven C D, Lawrence D M and Riley W J 2015a Permafrost carbon −climate feedback is sensitive to deep soil carbon decomposability but not deep soil nitrogen dynamics Proc. Natl Acad. Sci.112 3752–7
Koven C D et al 2015b A simplified, data-constrained approach to estimate the permafrost carbon–climate feedback Phil. Trans. R. Soc. A373 20140423
Koven C D, Ringeval B, Friedlingstein P, Ciais P, Cadule P, Khvorostyanov D, Krinner G and Tarnocai C 2011 Permafrost carbon–climate feedbacks accelerate global warming Proc. Natl Acad. Sci. USA108 14769–74
Kurz W A, Stinson G and Rampley G 2008 Could increased boreal forest ecosystem productivity offset carbon losses from increased disturbances? Phil. Trans. R. Soc.B363 2259–68
Larouche J R, Abbott B W, Bowden W B and Jones J B 2015 The role of watershed characteristics, permafrost thaw, and wildfire on dissolved organic carbon biodegradability and water chemistry in Arctic headwater streams Biogeosciences12 4221–33
Laudon H, Buttle J, Carey S K, McDonnell J, McGuire K, Seibert J, Shanley J, Soulsby C and Tetzlaff D 2012 Cross-regional prediction of long-term trajectory of stream water DOC response to climate change Geophys. Res. Lett.39 L18404
Lawrence D M, Koven C D, Swenson S C, Riley W J and Slater A G 2015 Permafrost thaw and resulting soil moisture changes regulate projected high-latitude CO2and CH4emissions Environ. Res. Lett.10 094011
Lawrence D M, Slater A G and Swenson S C 2012 Simulation of present-day and future permafrost and seasonally frozen ground conditions in CCSM4 J. Clim.25 2207–25
Lenton T M, Held H, Kriegler E, Hall J W, Lucht W,
Rahmstorf S and Schellnhuber H J 2008 Tipping elements in the Earth's climate system Proc. Natl Acad. Sci. USA105 1786–93
Maaroufi N I, Nordin A, Hasselquist N J, Bach L H, Palmqvist K and Gundale M J 2015 Anthropogenic nitrogen deposition enhances carbon sequestration in boreal soils Glob. Change Biol.21 3169–80
MacDougall A H, Avis C A and Weaver A J 2012 Significant contribution to climate warming from the permafrost carbon feedback Nat. Geosci5 719–21
Mack M C, Bret-Harte M S, Hollingsworth T N, Jandt R R, Schuur E A G, Shaver G R and Verbyla D L 2011 Carbon loss from an unprecedented Arctic tundra wildfire Nature475 489–92
McGuire A D et al 2010 An analysis of the carbon balance of the Arctic Basin from 1997 to 2006 Tellus B62 455–74
McGuire A D, Anderson L G, Christensen T R, Dallimore S, Guo L, Hayes D J, Heimann M, Lorenson T D, Macdonald R W and Roulet N 2009 Sensitivity of the carbon cycle in the Arctic to climate change Ecological Monogr.79 523–55
Morgan M G 2014 Use(and abuse) of expert elicitation in support of decision making for public policy Proc. Natl Acad. Sci. USA
111 7176–84
Moss R H et al 2010 The next generation of scenarios for climate change research and assessment Nature463 747–56
Myers-Smith I H, Harden J W, Wilmking M, Fuller C C, McGuire A D and Chapin F S 2008 Wetland succession in a permafrost collapse: interactions betweenfire and thermokarst Biogeosciences5 1273–86
O’Donnell J A, Harden J W, McGuire A D, Kanevskiy M Z, Jorgenson M T and Xu X M 2011 The effect offire and permafrost interactions on soil carbon accumulation in an upland black spruce ecosystem of interior Alaska: implications for post-thaw carbon loss Glob. Change Biol.17 1461–74
Pan Y et al 2011 A large and persistent carbon sink in the world's forests Science333 988–93
Payette S, Delwaide A, Caccianiga M and Beauchemin M 2004 Accelerated thawing of subarctic peatland permafrost over the last 50 years Geophys. Res. Lett.31 L18208
Peñuelas J, Canadell J G and Ogaya R 2011 Increased water-use efficiency during the 20th century did not translate into enhanced tree growth Glob. Ecology Biogeography20 597–608
Potter C S and Klooster S A 1997 Global model estimates of carbon and nitrogen storage in litter and soil pools: Response to changes in vegetation quality and biomass allocation Tellus B
49 1–17
Qian H, Joseph R and Zeng N 2010 Enhanced terrestrial carbon uptake in the Northern High Latitudes in the 21st century from the Coupled Carbon Cycle Climate Model Intercomparison Project model projections Glob. Change Biol.16 641–56
Raymond P A et al 2013 Global carbon dioxide emissions from inland waters Nature503 355–9
Raynolds M K, Walker D A, Epstein H E, Pinzon J E and Tucker C J 2012 A new estimate of tundra-biome phytomass from trans-Arcticfield data and AVHRR NDVI Remote Sens. Lett.3 403–11
Rocha A V, Loranty M M, Higuera P E, Mack M C, Hu F S, Jones B M, Breen A L, Rastetter E B, Goetz S J and Shaver G R 2012 The footprint of Alaskan tundrafires during the past half-century: implications for surface properties and radiative forcing Environ. Res. Lett.7 044039
Rupp T S, Starfield A M and Chapin I I I F S 2000 A frame-based spatially explicit model of subarctic vegetation response to climatic change: comparison with a point model Landscape Ecol.15 383–400
Saugier B, Roy J and Mooney H A 2001 Terrestrial Global Productivity ed J Roy et al(San Diego: Academic) pp 543–57 Schaefer K, Lantuit H, Romanovsky V E, Schuur E A G and Witt R 2014 The impact of the permafrost carbon feedback on global climate Environ. Res. Lett.9 085003
Schaefer K, Zhang T, Bruhwiler L and Barrett A P 2011 Amount and timing of permafrost carbon release in response to climate warming Tellus B(doi:10.1111/j.1600-0889.2011.00527.x)
Schirrmeister L, Siegert C, Kuznetsova T, Kuzmina S, Andreev A, Kienast F, Meyer H and Bobrov A 2002 Paleoenvironmental and paleoclimatic records from permafrost deposits in the Arctic region of Northern Siberia Quatern. Int.89 97–118
Schuur E A G et al 2013 Expert assessment of vulnerability of permafrost carbon to climate change Clim. Change119 359–74
Schuur E A G et al 2015 Climate change and the permafrost carbon feedback Nature520 171–9
Shur Y L and Jorgenson M T 2007 Patterns of permafrost formation and degradation in relation to climate and ecosystems Permafrost Periglacial Process.18 7–19
Sturm M, McFadden J P, Liston G E, Chapin F S, Racine C H and Holmgren J 2001 Snow-shrub interactions in Arctic tundra: a hypothesis with climatic implications J. Clim.14 336–44
Sutherland W J et al 2013 Identification of 100 fundamental ecological questions J. Ecol.101 58–67
Thornton P E, Lamarque J-F, Rosenbloom N A and Mahowald N M 2007 Influence of carbon-nitrogen cycle coupling on land model response to CO2fertilization and climate variability Glob. Biogeochem. Cycles21 GB4018
Treat C C and Frolking S 2013 Carbon storage: a permafrost carbon bomb? Nat. Clim. Change3 865–7
UNEP 2013 The Emissions Gap Report 2013 United Nations Environment Programme(UNEP) Nairobi
van der Werf G R, Randerson J T, Giglio L, Collatz G J, Mu M, Kasibhatla P S, Morton D C, DeFries R S, Jin Y and van Leeuwen T T 2010 Globalfire emissions and the contribution of deforestation, savanna, forest, agricultural, and peatfires (1997–2009) Atmos. Chem. Phys.10 11707–35
Vonk J E et al 2012 Activation of old carbon by erosion of coastal and subsea permafrost in Arctic Siberia Nature489 137–40
Whiteman G, Hope C and Wadhams P 2013 Climate science: vast costs of Arctic change Nature499 401–3
Wieczorek S, Ashwin P, Luke C M and Cox P M 2011 Excitability in ramped systems: the compost-bomb instability Proc. R. Soc. A
467 1243–69
Yarie J and Van Cleve K 2010 Long-term monitoring of climatic and nutritional affects on tree growth in interior Alaska Can. J. Forest Res.—Revue Can. Rech. Forestiere40 1325–35
Zachos J C, Dickens G R and Zeebe R E 2008 An early Cenozoic perspective on greenhouse warming and carbon-cycle dynamics Nature451 279–83
Zhang X, He J, Zhang J, Polyakov I, Gerdes R, Inoue J and Wu P 2013 Enhanced poleward moisture transport and amplified northern high-latitude wetting trend Nat. Clim. Change3 47–51
Zickfeld K, Morgan M G, Frame D J and Keith D W 2010 Expert judgments about transient climate response to alternative future trajectories of radiative forcing Proc. Natl Acad. Sci. USA107 12451–6