DOCT OR AL DISSERT A TION JILDIZ HAMIT EMIN O VSKI MALM ö H ög SK OL A 20 1 1 MALMö HögSKOLA 205 06 MALMö, SwEDEN www.MAH.SE
JILDIZ HAMIT EMINOVSKI
INTERACTIONS OF BIOPOLYMERS
AND METAL COMPLEXES
AT BIOLOgICAL INTERFACES
isbn/issn 978-91-7104-249-1/1653-5583 INTER A CTIONS OF BIOPOL YMERS AND MET AL C OMPLEXES A T BIOL O g IC AL INTERF A CES-
--
-- -- --
-
-Al Loss in mass and Re-swelling
--
--
--
--
-
--
- - -
-
---
-Compaction -Time Concentration Rinsing Time Layer growthI N T E R A C T I O N S O F B I O P O L Y M E R S A N D M E T A L C O M P L E X E S A T B I O L O G I C A L I N T E R F A C E S
Malmö University
Health and Society, Doctoral Dissertation 2011:3
© Jildiz Hamit-Eminovski 2011 ISBN 978-91-7104-249-1 ISSN 1653-5383
JILDIZ HAMIT-EMINOVSKI
INTERACTIONS OF BIOPOLYMERS
AND METAL COMPLEXES
AT BIOLOGICAL INTERFACES
Malmö University, 2011
Faculty of Health and Society
CONTENTS
ABBREVIATIONS AND SYMBOLS ... 9
ABSTRAcT ... 11
LIST OF pApERS ... 13
INTRODUcTION ... 15
Background and aims ... 15
Bacterial Biofilms ... 16
Wastewater... 17
Bacteria and bacterial surfaces ... 17
Biopolymers at interfaces ... 18
Systems studied ... 22
Microthrix parvicella ... 22
Aluminium and iron compounds ... 23
Mucin ... 24
Saliva ... 25
Surfaces – solid substrates ... 26
Silica ... 26
Gold ... 27
Hydroxyapatite ... 27
ExpERIMENTAL TEcHNIqUES ... 31
Ellipsometry ... 31
quartz crystal Microbalance with Dissipation ... 34
Atomic force microscopy (AFM) ... 38
contact Mode Imaging ... 38
Force measurements ... 39
RESULTS AND DIScUSSION ... 43
Adsorption ... 43
Effect of electrolyte... 49
Surface forces ... 57
Normal forces ... 57
Normal and lateral forces between macroscopic surfaces ... 61
Relation to applications ... 62
Errors in the used methods ... 63
SUMMMARY AND cONcLUDING REMARkS ... 65
FUTURE WORk ... 69
pOpULäRVETENSkApLIG SAMMANFATTNING ... 71
AckNOWLEDGEMENTS ... 75
ABBREVIATIONS AND SYMBOLS
D Ellipsometric angle related to the relative phase shift of the light components
db Penetration depth of the shear wave in bulk liquid. Related to QCM-D
Gellips Adsorbed amount per unit area from ellipsometry experiment
h Viscosity
k-1 Debye length
m Shear elasticity
mfric Friction coefficient r Density
Y Ellipsometric angle related to the relative amplitude change of the light components
y Electrical surface potential z-potential Zeta potential
AFM Atomic Force Microscopy
BSM Bovine submaxillary glands mucin D Dissipation
DLVO Derjaguin, Landau, Verwey and Overbeek
d Ellipsometric thickness, subscripts indicated film thickness (df) or silicon oxide thickness (d1)
dn/dc Refractive index increment with concentration EDL Electrostatic double layer
EPS Extracellular polymeric substances F Force
FEC Ferric chloride compound. Commercially known as PIX-111.
FISH Fluorescent In Situ Hybridization FvdW The van der Waals force
f Frequency
G Gibbs free energy
G’ Storage modulus
G’’ Loss modulus
H Enthalpy
hf QCM-D thickness obtained from modelling using the Voigt model HA Hydroxyapatite
HPAC High hydrolysis degree polyaluminium compound. Commercially available as PAX-XL19
HWS Unstimulated human whole saliva k Imaginary part of the refractive index LCFA Long chain fatty acids
LPAC Low hydrolysis degree polyaluminium compound. Commercially available as PAX-14.
M. parvicella Microthrix parvicella
mVoigt Voigt mass, obtained from modelling of QCM-D data
N Complex refractive index
n Refractive index (real part)
PAC polyaluminium chloride
PAX-14 Commercial low hydrolysis degree polyaluminium compound. PAX-XL19 Commercial high hydrolysis degree polyaluminium compound.
pI Isoelectric point
pzc Point of zero charge
PIX-111 Commercial ferric chloride compound
QCM-D Quartz Crystal Microbalance with Dissipation S Entropy
SDS Sodium dodecyl sulphate
SS Suspended solids
T Temperature
vdW van der Waals
W Interaction energy
w Water content in QCM-D film
WW Wastewater
ABSTRACT
The present work concerns interaction between biopolymers at interfaces. Examples from real systems such as saliva and bacterial surfaces as well as model systems have been studied.
Using atomic force microscopy (AFM), normal forces between the surface of the filamentous bacterium Microthrix parvicella and AFM-tips have been studied, before and after treatment with specific polyaluminium compounds used at wastewater treatment plants to control the growth of the bacterium. Measurements were performed using hydrophobized and hydrophilic tips in order to explore the interactive spectrum of the bacterium and also the changes of which, if any, on treatment with polyaluminium chloride. No preferential interaction was found to any of the tips. However, the studies revealed that long-range steric repulsion dominates the interaction on approach. It was also found that the steric repulsion is reduced by addition of polyaluminium compounds, indicating a compaction of the polymer layer on the surface of the bacterium. A mucin model system, i.e. Bovine Submaxillary Mucin (BSM), with BSM adsorbed at solid surfaces have been studied using ellipsometry and quartz crystal microbalance with dissipation (QCM-D). Using the optical method ellipsometry, time resolved data on the adsorbed amount per unit area and the average layer thickness of adsorbed BSM films were determined. From QCM-D measurements the Voigt mass per unit area and viscoelastic properties of an adsorbed BSM film (including coupled water) were determined. Combining these two methods the water content of BSM adsorbed at gold, hydrophobized, and hydrophilic silica surfaces was estimated. From the results structures for BSM adsorbed on gold, hydrophobized, and hydrophilic silica were proposed. Furthermore, effects by the addition of polyaluminium chloride of different hydrolysis
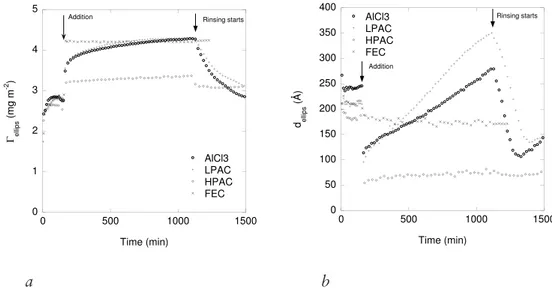
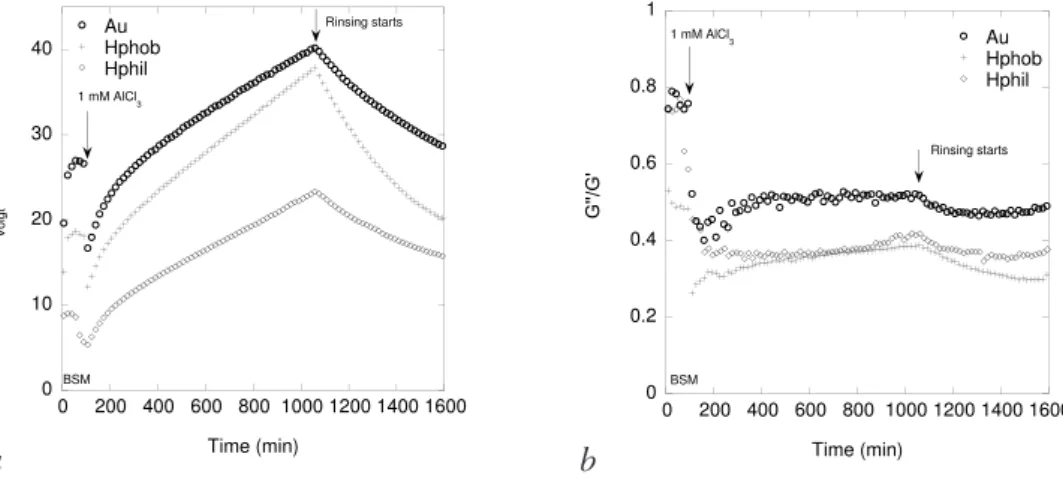
ratio were investigated and compared to those of AlCl3 and a ferric chloride formulation. Hence, compaction of the BSM film was initiated at concentrations as low as 0.001 mM AlCl3. At higher concentrations, related to those used at wastewater treatment plants, addition of polyaluminium chloride formulations and AlCl3 induced an initial rapid decrease in thickness followed by an increase. An increasing adsorbed mass was also observed. Combining ellipsometry and QCM-D data it was determined that aluminium species precipitate in or on top of the pre-adsorbed BSM film and the ensemble swells over time. By rinsing the precipitate layer was removed, but with some fraction remaining associated to the film. The rate of removal was slow and proceeded over a period of tens of hours. Combining the data, the swelling of the precipitate was monitored and the water content calculated. It was obvious that the increase on adsorption and decrease on depletion is mainly related to swelling. The impact of surface characteristics was also investigated and surface charge influences in terms of electrostatic interactions between the surface and the cationic aluminium compound were inferred.
Friction forces between hydroxyapatite surfaces coated with human whole salivary (HWS) films were measured and the friction coefficient of the salivary films was determined. Measurements were performed using AFM-colloidal probe using two hydroxyapatite spheres. The salivary film was found to show high compressibility and mechanical resistance. Treatment with an anionic surfactant, sodium dodecyl sulphate, however induced desorption and an irreversible structural change of the film.
LIST OF PAPERS
Papers included in the thesis:
I. Interactions of hydroxyapatite surfaces: Conditioning films of human whole saliva.
Cardenas M, Valle-Delgado JJ, Hamit J, Rutland MW, Arnebrant T
Langmuir 2008, 24, 7262-7268
II. Change in surface properties of Microthrix parvicella upon addition of polyaluminium chloride.
Hamit-Eminovski J, Eskilsson K, Arnebrant T, Biofouling. 2010, 26(3)323-331
III. An ellipsometry study on the effect of aluminium chloride and ferric chloride formulations on mucin layers adsorbed at hydrophobic surfaces. Hamit-Eminovski J, Eskilsson K, Arnebrant T, Biofouling. 2010, 26(5)511-518
IV. Compaction/decompaction of bovine submaxillary mucin layers adsorbed at model surfaces studied with Quartz Crystal Microbalance with Dissipation. Hamit-Eminovski J., Macakova L. and Arnebrant T., Manuscript
Reprint permissions have been granted by American Chemical Society for Paper I and from Taylor & Francis, Ltd for Paper II and III.
Contributions by the respondent
In Papers II, III, and IV, I was responsible for the planning and executed all experimental work. The papers are written mainly by me with support from the co-authors. My contribution to Paper I was to take part in the experimental
INTRODuCTION
Background and aims
Interactions in and between biopolymers occur in a wide range of biological settings and applications. Common examples include interactions between bacteria, proteins and particles in solution and at interfaces. In the oral cavity biopolymers account for lubrication in order to reduce friction, on bacterial surfaces rigidity among other properties is provided by biopolymers. Attractive and repulsive interactions keep structures together or prevent them from dissolving or collapsing. Disruption of intermolecular interactions in biopolymers can be accomplished by changing the physiochemical conditions. Changes in ionic strength and pH can induce irreversible coagulation impairing the functionality of a particular biopolymer. In addition, low molecular weight compounds can inhibit the function of a biopolymer by a specific or non-specific binding to a functional site of the biopolymer. More often than not stabilizing interactions are localized and may be thwarted by addition of chemicals or components targeting a specific interaction. In some applications, biopolymer destabilization is successful but the precise mechanism of action is not known. Treatment of foaming caused by extensive growth of the filamentous bacteria M. parvicella at wastewater treatment plants (WWTPs) by addition of polyaluminium chloride compounds is a typical example. The treatment has been successfully deployed for years without a known mechanism of action. Using different surface sensitive techniques the interactions can be quantified. A completely different, well-known phenomenon is lubrication in the oral cavity. Using surface analytical techniques and model surfaces mimicking the properties of the tooth enamel, the lubrication and reduced friction induced by the presence of a salivary film containing biopolymers can be elucidated and quantified.
The content of this thesis can be divided into two parts:
The first part details the effect of complex multivalent electrolytes on preadsorbed BSM layers at different surfaces (Paper III and IV). One aim was to understand the interactions involved in the adsorption process of BSM films onto surfaces of different characteristics (Paper IV). The influence of surface characteristics on the adaptations of the film when subjected to complex ions of different valency was of particular interest (Paper IV). Specifically the deposition and depletion of metal complexes on BSM was of interest as such compounds are used in WWTP applications (Paper III and IV).
The second part describes surface forces between macroscopic surfaces. Surface forces between a bacterial surface and an approaching or retracting AFM-tip were investigated in order to understand the interaction mechanisms and effects of aluminium chloride (Paper II). Lateral surface forces between macroscopic surfaces covered with a salivary film have been investigated in order to determine the lubricating properties of the latter (Paper I).
Bacterial Biofilms
Microbial biofilms are often defined as a population of microorganisms concentrated at an interface and surrounded by an extracellular polymeric matrix (EPS). Biofilms exist at interfaces, usually at the solid-liquid interface but also as flocks in solution1. Biofilms are found in different systems such as the oral
cavity, implants or catheters in the human body, rivers and pipelines in industry; more relevant to the present work, biofilms are found at WWTPs. Regardless of environment, the formation of a biofilm follows a particular sequential pattern. When a clean surface is immersed in a bio-fluid adsorption of organic molecules, such as proteins and other polymers, takes place within a few seconds, forming a conditioning film. Bacteria then adhere to the conditioning film, interacting primarily with the conditioning film and not directly with the surface, indicating that biofilms can grow on all kinds of surface if a favourable conditioning film is present. The next step is subject to controversy, but a prevalent theory states that bacteria remain adhered to the surface by secretion of exopolymers, and multiply forming a colony surrounded and protected by the slimy EPS matrix2. Nutrients
are transported to the bacteria through the matrix generating further growth. By exchange of molecular signals (i.e. quorum sensing) within the microbial colony, the bacteria may adapt to the surrounding conditions3.
Wastewater
Contaminated water, wastewater (WW) or sewage, is produced in every inhabited environment and is treated at WWTPs to degrade or reduce the semi-solid content precipitated as sludge, before water is released to the recipient. Treatment of WW is performed in several steps with diversity in setup among plants. Addition of air in the sludge treatment is necessary for organic content degradation by microorganisms, a process that takes place in biofilms growing in flocks or on carriers. A wide diversity of bacteria and other microorganisms are responsible for this process, e.g. nitrifiers, denitrifiers, phosphate accumulating organisms, glycogen accumulating bacteria, and also others such as iron and sulphate reducers4. Other bacteria, such as the filamentous M. parvicella investigated
in the present study, are also present, causing problems in the WW treatment process when the bacterial growth exceeds a certain level.
Bacteria and bacterial surfaces
The bacterial cell wall provides the bacteria with structural integrity5,6 with a
primary function to limit osmotic overpressure in the cell. Further, bacteria have an inner cytoplasmic membrane built-up as a bilayer of phospholipids, with membrane anchored proteins7. Immediately on the outside of the cytoplasmic
membrane, bacteria also have a peptidoglycan matrix providing the cell wall with rigidity and cell shape. Cross-linked chains of the two alternating amino sugars, N-Acetyl glucosamine and N-Acetyl muramic acid build up the peptidoglycan matrix. Bacteria are divided into gram positive and gram negative bacteria respectively. The difference between those two categories is that gram-negative bacteria have a thin layer of peptidoglycans adjacent to the cytoplasmic membrane followed by an additional outer membrane composed of phospholipids and lipopolysaccharides. Apart from peptidoglycans anchored to the cytoplasmic membrane, a variety of other extracellular substances, or exopolymers, are secreted by bacteria8.
The behaviour of bacteria at interfaces is often related to the structure, chemical composition, and physicochemical properties of the bacterial surface9. The
presence of proteins, carbohydrates, and lipids in the bacterial cell wall influences the behaviour of bacteria at interfaces, such as their adhesion, and may also contribute to aggregation of bacteria10. Attempts to theoretically predict and
model bacterial adhesion to surfaces using models such as the DLVO theory11
and extended DLVO theory (accounting for hydrophobic contributions)12,13 have
energies qualitatively, but a quantitative interpretation of the components of the interactions should be done with care14.
Biopolymers at interfaces
Polymers are composed of repeating structural units connected by covalent bonds. When the units carry charges, the polymers are referred to as polyelectrolytes. Polyampholytes carry both positive and negative charges and typical examples are proteins and glycoproteins. Proteins are copolymers built from about 20 different a-amino acids of different characteristics, such as acidic, alkaline and with varying polarity (hydrophobicity). Thus the primary structure, which defines the particular sequence of amino acids, results in a polypeptide chain which posses both ampholytic and amphiphilic characteristics that will be of importance for the folding of the polypeptide as well as adsorption at interfaces. Hydrogen bonding between N-H and C=O functional groups of the peptide units realizes the secondary structure, i.e. a-helix, b-plated sheet, and random coil15.
The tertiary structure is the three dimensional structure of the polypeptide chain in which the folded motifs of a-helix and b-sheets together with random coil motifs are arranged with respect to each other.
Polymers and proteins spontaneously adsorb at interfaces when the Gibbs free energy of adsorption, DGads is less than zero, that is:
DGads = DHads – TDSads < 0 Eq. 1
DHads and DSads are the changes in enthalpy and entropy, respectively, and T is the
absolute temperature. The adsorption is driven by a combination of interactions acting between the adsorbing entities, the surrounding solvent and the surface. Electrostatic interactions, van der Waals interactions (vdW), the hydrophobic effect and hydrogen bonds together with the conformational and translational entropy are the main contributions to the adsorption process16,17.
Coulomb interactions
Electrostatic or coulomb interactions act between individual charges and can be either attractive or repulsive depending on the charge of the interacting objects. Interactions between charges in polymers or proteins in aqueous media are considered to be short-range; the strength decreases rapidly with increasing electrolyte concentration.
Van der Waals interactions
vdW interactions operate between all materials. The interaction is of electro-magnetic origin and accounts for interactions between fixed and/or induced dipoles. Interactions between molecules and entities of similar constituents are always attractive whereas interactions between molecules and entities of dissimilar constituents may in some cases be repulsive. Between molecules the interaction is considered to be short range and decreases approximately with the inverse of the separation to the sixth power. For macroscopic bodies however, the interaction is long range and depends on the separation and properties of the interacting surfaces, as well as the interaction medium. The vdW interaction between macroscopic surfaces decreases with the inverse square of the separation.
Hydrophobic interactions and hydrophobic effect
Hydrophobic interactions occur in mixtures of polar and apolar components inducing a dehydration of apolar parts to reduce the polar-apolar interaction. In aqueous media, the contribution of the hydrophobic interactions often dominates over other kinds of intermolecular interaction and increase with increasing size and/or increasing apolar domains.
Hydrogen bonds
Hydrogen bonds are formed between nitrogen or oxygen (fluorine) bound hydrogen and the most electronegative atoms, i.e. N, O, F. Hydrogen bonds are short range attractive interactions spanning over a few Å. Hydrogen bonds are not contributing directly to the adsorption process but account for the tree dimensional structure of some polymers and the secondary structure of proteins. Hydrogen bonds do not influence the adsorption of larger molecules such as proteins since the reduction of the number of hydrogen bonds in the adsorbate is compensated for by new adsorbate-surface and adsorbate-solvent hydrogen bonds.
Entropy effects
Conformational and translational entropy is associated with the physical arrange-ment of polymers and proteins i.e. the number of possible conformations the polymer chain can adopt and how the molecule is moving in space. As an in-crease in entropy contributes to a dein-crease in the Gibbs free energy, adsorption processes are hence favoured when the entropy change is maximized. Conforma-tional entropy opposes folding of polymers and proteins and translaConforma-tional and conformational entropy will in general decrease for polymers upon adsorption.
However, for globular proteins conformational entropy may increase due to loss of secondary structure, promoting adsorption17. Even though the entropy change
upon adsorption of macromolecules is unfavourable, adsorption may still take place since the translational entropy for solvent molecules or counterions in-creases.
In addition to the interactions discussed above, steric and electrostatic double layer (EDL) forces are important and have to be taken into account when considering interactions between macroscopic surfaces and adsorption at interfaces.
Steric interactions
Steric interactions, in most cases referred to as repulsion, arise from the overlap of entities extending from two surfaces approaching each other. The repulsion is of entropic origin due to reduction in conformational freedom of the extensions. The length of the protruding extension determines the range. However, it is important to note that steric interactions can be attractive (bridging) if the surface coverage is low16.
Electrostatic double layer forces
Due to electroneutrality reasons counterions will accumulate on a charged surface creating an EDL. The distribution of ions will be dependent on the surface charge density and the electrolyte concentration. The thickness of the diffuse double layer, as reflected by the Debye length, will depend on the properties of the electrolyte and the solvent16,17.
DLVO theory
The DLVO theory18,19 describes the interaction of objects in terms of the van der
Waals attractions and the electrostatic double layer repulsion. The theory can be used to quantitatively describe the stability of lyophobic colloids but also to calculate the interaction force between surfaces of different geometry.
Adsorption
Upon adsorption, the van der Waals and electrostatic interactions will contribute to the enthalpy whereas hydrophobic interactions, conformational changes of polymers, dehydration of polymers and/or surfaces, and liberation of ions from the surfaces or polymer chains contribute to the entropy. Polymers in solution are flexible and can adopt several conformations due to rotational freedom of the bonds between the atoms in the backbone. Interactions between the segments
and the surrounding medium will determine the conformation and translation in solution. Charged polymers such as polyelectrolytes and polyampholytes will adopt an extended conformation in solution due to solvation of the charged groups. The point of zero charge (pzc) is referred to as the condition where the net charge on the surface is zero. For polyampholytes, the isoelectric point (pI) is the pH where the net charge is zero. Globular proteins may adsorb as spheres despite some rearrangement in their interior due to interactions between subunits of the protein and the surface. Flexible proteins however, can also behave as extended polymers in solution. Mucins, are typical examples, with protruding sugar groups that for sterical reasons oppose the folding of the protein backbone. They also carry hydrated negative charges on the glycosylated parts and will thus adsorb similarly to weakly charged polyelectrolytes. Electrostatic interactions are of main importance when weakly charged polymers adsorb at charged surfaces. The surface charge density, the charge of the polymer, and the ionic strength of the solution will determine the strength of the interaction. Flexible polymers adsorb with loops, trains and tails and the ratio of these structures depends on the interaction between the polymer and solvent. Polyampholytes are attracted to almost any charged surface. They have a tendency to find short-range electrostatic attractions even when the net surface charge should render the interaction repulsive20. In the presence of other non-electrostatic interactions
such as hydrophobic or vdW interactions, adsorption takes place regardless of the surface charge. For thiol containing proteins/polymers, chemical binding may also play a role21.
The adsorbed mass on a charged surface will by affected by the ionic strength and pH. Close to the pI of the adsorbate the adsorbed mass of charged flexible polymers will be maximized due to neutralization of charges. Loop formation on the surface will be promoted since the electrostatic repulsion between segments of the adsorbed compound will decrease. If a high adsorbed mass is obtained at pzc the adsorbed mass can be increased by increasing the ionic strength since the electrostatic intra- and intermolecular interactions are screened22. For surfaces
with the same net charge (e.g. silica) as the adsorbate net charge (e.g. mucin above pI), an increase of the ionic strength will increase the adsorbed mass. Varying the pH will have an analogous effect on the adsorbed mass. For preadsorbed films, a change in ionic strength and/or pH will not significantly affect the adsorbed mass.
Systems studied
In the following section, a general introduction of the systems studied will be given together with reference to the individual papers.
Microthrix parvicella
M. parvicella is a gram positive unbranched filamentous bacterium. It has a
thickness of approximately 0.6-0.8 mm and a length of more than 200 mm23,24.
Activated sludge represents a unique ecosystem and M. parvicella is detected only in this environment25. A large quantity of M. parvicella in sludge flocks
prevents sedimentation of the flocks and the affinity for the air/water interface results in severe foaming. The bacterium has a high abundance of surface associated enzymes such as lipases and various esterases that are believed to be essential to the bacterial feeding mechanism. The active enzymes seem to be hosted in the water swelled outer layer of extra-cellular polymers26. The lipid
accumulating bacterium feeds extensively on long chain fatty acids (LCFA)27,28
and it has the ability to metabolize LCFA not only under aerobic, but also under anaerobic conditions. This ability provides the bacterium with a competitive advantage, enabling it to dominate over other microorganisms at WWTPs, with alternative aerobic-anaerobic setups. Using microsphere adhesion to cell (MAC) measurements, it has been shown that the outer surface of the bacterium is more hydrophobic than that of most other bacteria in activated sludge26. This is believed
to be the cause of the high abundance of M. parvicella in foam at WWTPs as well as the selective adhesion of the bacterium from sludge to hydrophobic surfaces as observed in our studies. It is common practice to add aluminium chloride formulations in order to reduce foaming at WWTPs29 and several attempts
have been made to elucidate the mechanism. Nielsen et al30 proposed structural
changes of exo-enzymes on M. parvicella, reducing the nutrient uptake by the bacterium. Hydrophobic surface properties of the surface were not altered. Paris et al31 on the other hand propose changes in the hydrophobicity of the sludge
content, reducing the bacterial adhesion to flocks and thereby deprivation of substratum for the bacterium.
In Paper I, M. parvicella was collected in morning samples from Klagshamns municipal WWTP. The samples were collected and transported to the lab within 1 h. Fluorescence in situ hybridization (FISH) was used to identify and verify that the adhering filamentous bacteria on the hydrophobic surfaces indeed were M. parvicella. FISH is a frequently used technique to identify different species of bacterium using fluorescent ribosomal RNA (16SrRNA)32,33,34. All
AFM experiments were performed in 10 mM NaCl solution. A low electrolyte concentration was chosen to be able to detect electrostatic contributions to measured surface forces.
Aluminium and iron compounds
AlCl3 has high affinity for water and upon dissolution, initially a hexahydrate, [Al(H2O)6]3+, is formed. The hexahydrate is further hydrolysed according to a
stepwise reaction35:
At high concentrations, the hydrolysis will be slow whereas at concentrations below 0.55 M36 the reaction is fast. Depending on the pH and Al concentration, different
polyaluminium complexes will form. Below pH 5.8 larger polyaluminium species coexist, whereas above pH 6.4 dimeric aluminium ([Al2O2(OH)(H2O)0–3]+) 36 is the
dominating polyaluminium species. Above the solubility limit of 10-7 M at pH 6.5,
[Al(H2O)6]3+, [Al(OH)(H
2O)5]2+ and [Al(OH)2(H2O)4]+ will coexist in equilibrium
with aluminium hydroxide, Al(OH)3, precipitated as gel flocks. The precipitation of the gel flock is however slow.
In aluminium formulations the pH dependent hydrolysis ratio defined as, R=[OH]/[Al] is used as a characteristic. With increasing R the hydrolysis and polymerisation processes increase yielding higher fractions of polyvalent aluminium species such as [Al7(OH)17]4+, [Al
8(OH)20]4+ and [Al13(OH)24]5+.
However, the polymerisation process increases up to pH 5.8, whereas decomposition is pronounced at higher pH.
Iron chemistry is complicated and not as well studied. The reaction kinetics of iron chloride is very fast and results mainly in Fe(OH)3 in equilibrium with Fe(OH)2+ at pH 6.5 for concentrations above 10-8 M.
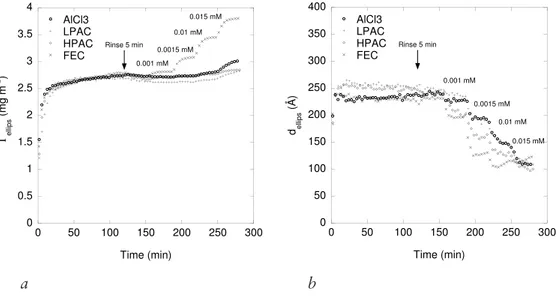
In Paper II PAX-14 was used to investigate the mode of action on M. parvicella. The concentration used in the experiments corresponded to 1.0 mM Al. When treating M. parvicella at WWTPs a concentration of about 0.1 mM Al is used. We, however, choose to use a higher concentration in order to obtain a more
O
H
O
H
OH
Al
O
H
O
H
Al
(
2)
6 3 2(
)(
2)
5 2 3
O
H
O
H
OH
Al
O
H
O
H
OH
Al
(
)(
2)
5 2 2(
)
2(
2)
4 3pronounced effect and to be able to compare the effect with results obtained by others, in particular Nielsen et al30 and Paris et al31. In Paper III where effects on
preadsorbed mucin was studied, PAX-14 (LPAC) and PAX-XL19 (HPAC), two polyaluminium formulations of different hydrolysis ratio, 0.9 and 2.4 respectively, were used and AlCl3 was used as reference. A ferric chloride, PIX-111 (FEC) with no pronounced effect ion M. parvicella at WWTPs was also used for comparison. In Paper IV AlCl3 was used as the compacting agent to investigate compaction and reversibility of the compaction/decompaction of preadsorbed mucin as well as the influence of surface characteristics on the action of AlCl3. The reversibility of compaction was of interest to understand the recovery of M. parvicella when PAX-14 treatment at WWTPs is terminated. Experiments in Paper III and IV were performed in 100 mM sodium acetate buffer at pH 6.5. The buffer strength was chosen to maintain a constant pH (the decrease in pH was less than 0.3 at 1.0 mM AlCl3) upon addition of the metal ion formulations.
Mucin
Mucins are glycoproteins found on mucosal surfaces and are secreted by specialized epithelial cells. Mucins are large molecules with molecular weights of 105-107 Da. The molecules consist of approximately 75% carbohydrate and 25%
polypeptide in which amino acids are linked via O-glycosidic bonds to sugar residues37. In spite of the structural similarities, a high diversity exists within
the group38. In this work Bovine Submaxillary Mucin (BSM) extracted from
the submaxillary glands of cows has been used. The molecular weight of the molecule has been reported to be batch dependent and varies with the content of multimers39. Sandberg et al reported the molecular weights to be between 0.9 and
2.9 MDa, for low and high molecular mass fractions of BSM; the latter containing a high amount of multimers. The structure of BSM resembles a bottlebrush, incorporating an extended protein backbone with protruding covalently bound oligosaccharide side chains. The glycosylated side chains are mainly built up by oligosaccharides of various composition (5-15 monomers), O-linked to serine and threonine residues of the polypeptide backbone. A high content of sialic acids (pKa ~2.6)40 and sulphated sugars (pKa ~1)41 gives BSM a net negative
charge at neutral pH. The heavily glycosylated parts are often referred to as the hydrophilic parts of the molecule whereas the protein backbone is hydrophobic37.
The adsorption of BSM on surfaces is slow, proceeding over several hours42.
The slow adsorption is associated with the high molecular mass of the mucin molecule and the presence of mucin mono- and multimers39. This contributes
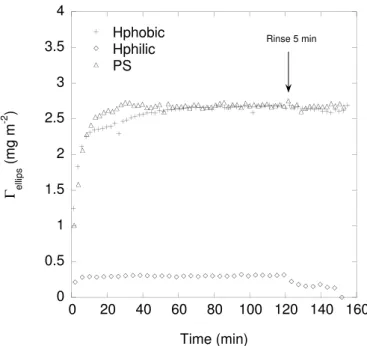
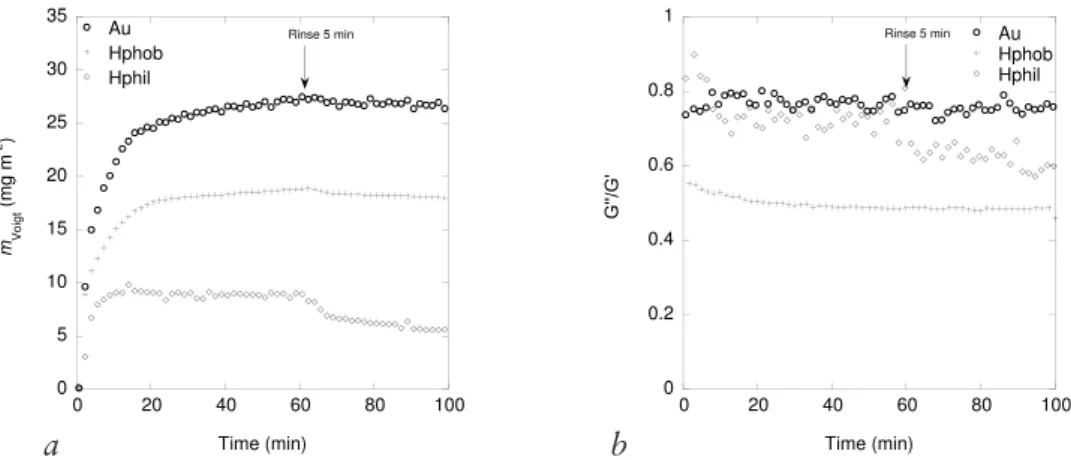
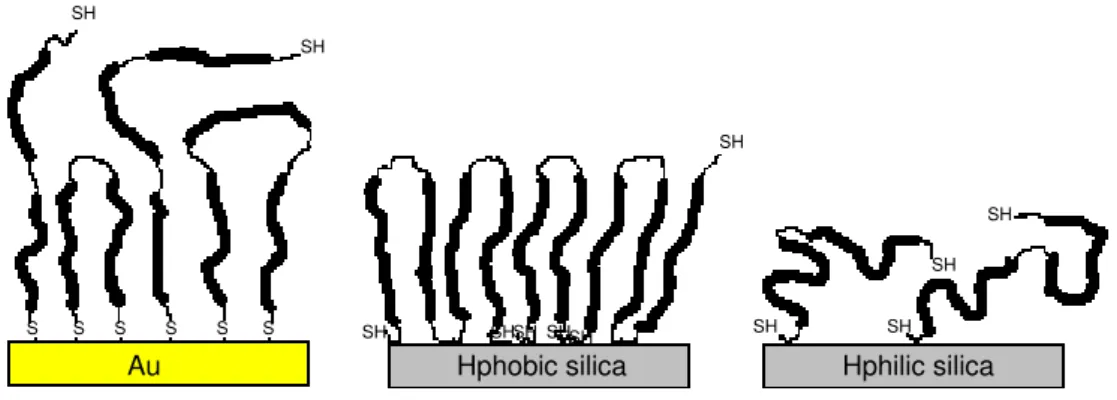
to sequential exchange of molecules on the surface as well as conformational changes and relaxation effects during adsorption. BSM tends to form thick highly hydrated films on gold surfaces where the affinity for gold of the thiol groups of the protein backbone are believed to be the driving force for adsorption43.
On hydrophobic surfaces a denser yet thick layer is adsorbed. On negatively charged silica, less is adsorbed but the film formed is highly hydrated43, and also,
adsorption increases with increasing bulk BSM concentration44. With increasing
electrolyte concentration BSM adsorption to hydrophilic and hydrophobized silica increases owing to screening of electrostatic repulsion44. The addition of
divalent ions has also been shown to increase the adsorption; the same effect is observed when the solution pH is decreased.
In Papers III and IV, BSM (M3895, Type I-S) was used as received without further purification and the same batch was used for all experiments. Prior to adsorption, BSM was dissolved for 2 h in 100 mM sodium acetate buffer, pH 6.5.
Saliva
Saliva, in this case Human Whole Saliva (HWS), is a dilute solution consisting of 99% water. The remaining 1 % consists of a variety of electrolytes, lipids, carbohydrates and proteins. Saliva is a unique fluid as many of its components, in particular the proteins, are multifunctional and provide an array of functions. One of the functions of saliva is lubrication, i.e. reducing friction and thus facilitating chewing, speaking, swallowing, and also offers protection of the soft mucosal tissue as well as the hard enamel interfaces45,46. It also provides buffering
and clearance, maintenance of tooth integrity (remineralisation), antibacterial activity, and enhances taste and digestion. Mucins together with statherin and proline-rich proteins (PRPs)47 have been reported to contribute to the lubrication
in the mouth48, 49.
In Paper I the lubrication of hydroxyapatite surfaces by HWS has been investigated; unstimulated HWS collected from a healthy adult male donor was used. The protein content of the saliva was determined to be 1.1 mg ml-1. 10
mM phosphate buffer supplemented with 50 mM NaCl at pH 7.0 was chosen to mimic the electrolyte conditions in saliva50. The anionic surfactant sodium
dodecyl sulphate (SDS) was used as an elution agent to “wash” away the saliva and was chosen as it is a common component in toothpaste.
Surfaces – solid substrates
Surfaces of different characteristics have been used in this work. In Paper I hydroxyapatite was used to mimic tooth enamel. In Paper II hydrophobized silica was used since the bacteria studied showed high adsorption affinity on hydrophobized silica, thereby facilitating the AFM experiments. In Paper III hydrophobized silica was used by reason of its ability to adsorb a stable thick BSM film that could serve as a model for the bacterial surface. In Paper IV hydrophilic as well as hydrophobized silica and gold were used to compare the adsorption and compaction at surfaces of different charge density and hydrophobicity. In the following section, a short description of the surface characteristics together with surface roughness images from AFM will be presented.
Silica
Today high quality nanoscopically flat silicon wafers are commercially available and can be readily used in different applications. When silicon is exposed to air, a 10 to 30 Å thick silicon oxide layer, i.e. silica, forms on the surface. Using thermal oxidation silica layers of defined thickness (e.g. 300 Å used in ellipsometry experiments) suitable for optical methods such as ellipsometry can be produced. The surface chemistry of silica is rather complex and a comprehensive summary can be found in Iler’s “The chemistry of silica”51. Here only a small summary
related to the current work is presented. The silica surface carries hydroxyl groups (-OH), which are commonly referred to as silanol groups. The silanol groups allow surface modification with e.g. functionalized silanes that couple to the silanol oxygen. Silica has a pI of about 2-3 and the surface charge potential is affected by both pH and ionic strength.
The silica surfaces used in Paper II and III were produced by thermal oxidation of silicon wafers, resulting in an oxide layer of about 300 Å; the oxidized wafers were kindly provided by Dr. Bo Thunér, Linköping University (Linköping, Sweden).
The silica surfaces were subjected to a cleaning procedure including gentle boiling for 5 min in a mixture of NH3 (25%), H2O2 (30%) and water (1:1:5 by volume) followed by rinsing with water and a second gentle boiling for 5 min in a mixture of HCl (37%), H2O2 (30%) and water (1:1:5 by volume). After rinsing with water the hydrophilic silica surfaces were stored in ethanol. Prior to use, the surfaces were rinsed with water, ethanol and water and dried in a steam of nitrogen followed by plasma cleaning for 10 min in low-pressure residual air using a radio frequency glow discharge unit. Hydrophobized surfaces were prepared from the hydrophilic silica slides by gas-phase silanization by leaving the surfaces overnight in a vacuum
desiccator fitted with a beaker with dichlorodimethylsilane. Finally, the surfaces were sonicated for 5 min in trichloroethylene followed by sonication in ethanol. The latter process was repeated 3 times. z-potentials for the hydrophobized and hydrophilic silica surfaces have been reported to be -45 mV52,53,54.
Sensors used in Paper IV were purchased from Q-Sense AB, Sweden. The sensors are covered by a silica layer of about 500 Å. Prior to use the hydrophilic silica sensors were rinsed with ethanol and water repeatedly for 5 times and plasma cleaned for 10 min. Hydrophobized silica sensors were prepared by gas-phase silanization as specified above.
Water contact angles and surface roughness values for the surfaces used are presented in Table 1. The obtained values were in good agreement with values previously reported for hydrophilic and hydrophobized silica, respectively 55,56.
Gold
Gold is known to be the most chemically inert of all metals. Regardless of cleaning procedure, the surface readily adsorbs impurities from air, which may affect its chemical properties. If in the native state, the surface charge is not expected to show any pH dependence. However, the pI for gold has been determined to be in the range of 4.5 -557,58. Different theories for the pH dependence and the origin of
charges on the surface exist. One of the theories suggests that since gold is inert the charge of the gold surface is due to specific ion adsorption and depends on the composition of the solution59. Another theory draws on the presence of an oxide
(sub) monolayer. Binding of water to O atoms form an overlay-lattice array of hydrated hydroxyl ions that can associate with or loose protons forming charges at the surface58. Gold surfaces are used as bare surfaces for protein adsorption,
but also as solid substrates with a variety of functional groups coupled to the surface by chemisorption. Thiolated functional groups forming a densely packed monolayer are frequently used to modify gold surfaces for different applications. The gold sensors used in Paper IV were purchased from Q-Sense AB, Sweden. Prior to use, the surfaces were rinsed repeatedly with ethanol and water, dried under a stream of nitrogen and plasma cleaned for 10 min. The deposited gold layer is about 1000 Å, according to the manufacturer.
Hydroxyapatite
Hydroxyapatite (HA), is a mineral consisting of calcium phosphate (Ca5(PO4)OH) in its stable phase at pH > 4.2, at body temperature60. In the mature state, 97%
been reported to be in the range of 6.5 to 8.5 62,63 but HA is reported to be weakly
charged at pH 7 with a
z-
potential of -25 mV in a 10 mM phosphate buffer64.In Paper I HA was used as a model surface for the saliva experiments to mimic the friction between tooth surfaces. HA particles with a diameter of 30-40 µm were obtained from CAM Implants B V (Netherlands). Sintered HA discs with a diameter of 16 mm were used as a flat surface for particle-flat surface measurements, and were obtained from Calcitek, Carlsbad, CA. Prior to use the particles and cantilever were carefully rinsed with water and ethanol, dried with nitrogen and plasma cleaned for 30 s. After several steps of polishing, the HA discs were first rinsed in ethanol and then sonicated for 30 min in ethanol; this was followed by extensive rinsing with detergent solution and finally the discs were rinsed with water, ethanol and water. The discs were kept dry in sealed Petri dishes and plasma cleaned for 5 min prior to adsorption experiments. The surface root mean square roughness of HA discs was measured to be 2 nm in flat areas, although some larger defects are present in the overall area.
The surfaces used in the experimental work are different in surface charge, contact angle, and root mean square roughness. In Figure 1 AFM images of the gold (a) and silica (b) coated QCM-D sensors, silica surfaces (c), and the HA particle surface (d) are presented. The measured contact angles and mean surface roughness for the surfaces are presented in Table 1. Silica surfaces are found to have the lowest surface roughness whereas the HA particles are the most rough. The QCM-D sensors, both gold and silica, are rougher than the silica surface. Comparing the silica sensor with the silica surface a larger surface area for the QCM-D sensor is obtained due to the higher surface roughness. Such a difference might induce a higher adsorbed mass on the latter surface. A higher surface roughness is also known to induce higer hydrophobicity on hydrophobic surfaces65,66. The water contact angles on hydrophobized silica and
hydrophobized QCM-D silica sensors were however, measured to be the same. A water contact angle of 105 ± 2° was obtained for the hydrophobized surfaces and less than 10° for the hydrophilic silica (both for ellipsometry surfaces and QCM-D sensors), gold, and HA. Measurements on gold 10 min after plasma cleaning reveals the same water contact angle as just after plasma cleaning (stored in closed container). Hence, all non-hydrophobized surfaces used in the experiments are considered to be hydrophilic. However, charge densities differ, with silica having the highest charge density and gold the lowest.
EXPERIMENTAL TECHNIquES
Ellipsometry
Ellipsometry is an optical method based on the detection of changes in the polarization of light upon reflection at an interface. Ellipsometry can be used to obtain detailed, time resolved information about adsorbed films at a solid-liquid interface. The adsorption kinetics can be followed with a time resolution of a few seconds68 and the thickness and adsorbed amount of the film can be
determined with a resolution of about a few Å and approximately 0.05 mg m-2,
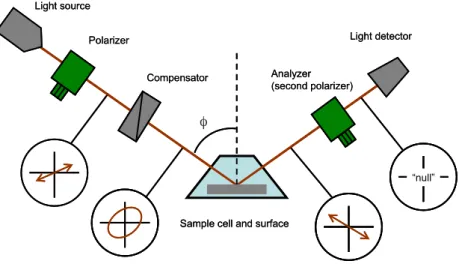
respectively. The null-ellipsometer with the PCSA (polarizer, compensator, sample and analyser) arrangement as illustrated in Figure 2 has been used in this work. The instrument is a Rudolph thin film ellipsometer, type 43603-200E (Rudolph Research, Fairfield, NJ, USA), automated according to Cuypers et al69. A xenon
arc lamp was used as light source and light was detected at 442.9 nm using an interference filter with UV and IR blocking (Mells Griot, Netherlands). In the PCSA set-up, light from the light source passes through a polarizer followed by a compensator before it is reflected on the sample surface. The reflected light then passes through the analyser (a second polarizer) before it reaches the photo detector.
Figure 2. Null ellipsometry set-up. Figure is reproduced with the kind permission of Olof Svensson.
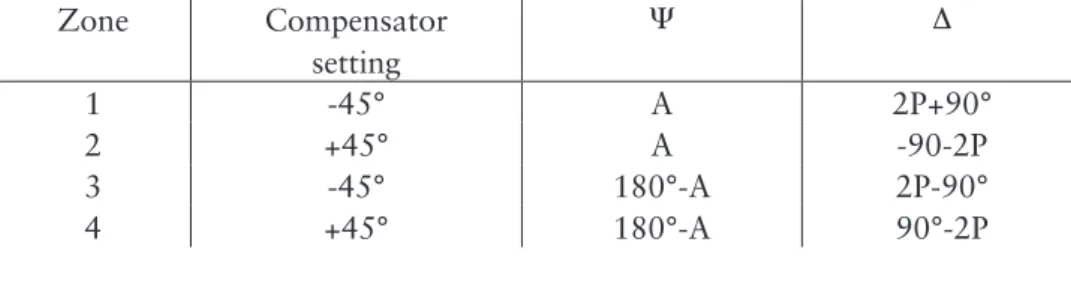
When passing through the polarizer the light is plane (linearly) polarized, i.e. it can be described by two vectors in phase with different magnitude depending on the plane of polarisation. When passing the compensator, a phase shift of 90° is introduced between the light vectors. The light is then in general elliptically polarized meaning that the resulting light vector will describe an ellipse (in a plane perpendicular to the propagation direction of the light beam). When reaching the surface the light components perpendicular (s) and parallel (p) to the plane of incidence will be differently affected by the optical properties of a material. The propagation and reflection of light through various interfaces of different indices of refraction, e.g. a thin adsorbed film at a surface will in general create a change in amplitude and phase in both p and s to different extent. In null ellipsometry the polarizer is adjusted so that the light is plane polarized after reflection. The plane polarized light can then be extinguished by the analyser, resulting in a minimum in light intensity. There are four sets of positions, known as zones, for the polarizer, analyzer, and compensator that all result in minimum intensity. Using the angles obtained from the polarizer and analyser, respectively, the ellipsometric angles D and Y can be determined; these are calculated according to Table 2 for the four different zones.
�0 Light source Polarizer Compensator Analyzer (second polarizer) Light detector
Sample cell and surface
“null” �0 Light source Polarizer Compensator Analyzer (second polarizer) Light detector
Sample cell and surface
Table 2. Conversion from analyzer (A) and polarizer (P) settings into Y and D70. Zone Compensator setting Y D 1 -45° A 2P+90° 2 +45° A -90-2P 3 -45° 180°-A 2P-90° 4 +45° 180°-A 90°-2P
Properties of the solid surface and the adsorbed film is obtained by calculations using the ellipsometric angles Y and D. Prior to adsorption measurements, the surface properties are characterized by performing measurements in two media of different refractive index. Four zone measurements are performed in each medium to reduce errors originating from instrumental imperfections. For complex surfaces, such as the silicon/silica surface used in this work, a three layer optical model is used to obtain the complex refractive index of bulk silicon, (N0 = n0 – ik0), and the real refractive index (n1) and thickness (d1) of the oxide layer (silica)68.
Figure 3. Schematic illustration of the four-layer model of silicon, silica, adsorbed film and bulk. Angle of incidence and refraction (fb, ff, f1), refractive indices (nb, nf, n1) and thickness (df, d1) are indicated.
N
0n
1n
fn
bφ
bBulk
Film
SiO
2Si
d
fd
1φ
fφ
1After surface characterization, the changes in angles Y and D are recorded for the adsorbed film. Using the properties determined for the clean surface, the mean optical thickness, df, and the refractive index, nf, of the adsorbed film can be solved by numerical iterations from the changes in Y and D 71,72. The four-layer
model illustrated in Figure 3 is used for the calculations, assuming a homogeneous film. The adsorbed amount, Gellips (mg m-2), is then finally calculated from d
f and
nf,using the de Feijter formula:
where nb isthe refractive index of the bulk solution (i.e. the liquid in the ellipsometric cuvette) and dn/dc is the refractive index increment with concentration of the component in the adsorbed film. It is important to note that the obtained thickness from ellipsometric data assumes a homogeneously adsorbed film with a mean refractive index averaged over the measured area. Proteins and polymers may not adsorb homogeneously, and the thickness determined should not be taken as an absolute value.
The interpretation of the ellipsometric data was performed using the software Ellipsometry (v. 1.31 developed by Plamen Petrov, 1994-2001). In Paper III, ellipsometry in an automated setup based on the principles of Cuypers69 was used
to measure the adsorption of mucins and the subsequent interactions with metal complexes on silica surfaces. From the measurements, time resolved values of the adsorbed amount, refractive index and thickness were determined.
quartz Crystal Microbalance with Dissipation
Quartz Crystal Microbalance with Dissipation is essentially an ultrasensitive
scale enabling the analysis of small masses73. A piezoelectric quartz crystal serves
as the balance and is the heart of the instrument. The crystal is AT-cut, disc shaped, and have electrodes deposited on each side. Connecting the crystal to an external driving unit induces oscillations of the crystal at its resonance frequency. Addition of a mass to the crystal surface induces a frequency shift, Df, that ideally is directly related to the mass change, Dm. Measurements can be performed in either vacuum, gas, or liquid74,75 using crystals coated with a variety of materials
e.g. gold, silica, and hydroxyapatite76.
dn/dc
n
n
d
Γ
f b f ellips
Eq. 2 Eq. 2In this work a Q-Sense E4 setup has been used where it is possible to perform four experiments in parallel or series. The instrument measures both frequency and dissipation simultaneously at the fundamental resonance frequency (n=1) as well as at six different overtones (n = 3, …, 13) with the possibility to elucidate various aspects of biological materials and their interactions. By oscillating the quartz crystal an exponentially decaying shear wave is created in the liquid. The decay length of the wave is referred to as the penetration depth of the bulk liquid and is approximately 250, 140, 110, 90 and 80 nm for the fundamental, 3rd, 5th,
7th and 9th overtones, respectively77, 78 in water. It is important to note that the
penetration depth is determined by the viscosity and density of the liquid79.
In 1959 Sauerbrey published a paper describing the linear relationship between mass addition and frequency shift of the oscillating crystal. The relation holds under the assumption that the adsorbed mass is less than the mass of the crystal, is uniformly distributed and rigidly attached with no slip or deformation during oscillation of the crystal. This relation is referred to as the Sauerbrey relation:
where C is the mass sensitivity constant that is related to the crystal properties and n is the overtone number. For larger molecules such as high molecular weight proteins and polymers adsorbed at the sensor-liquid interface this relation does not hold. These molecules tend to interact with the surrounding bulk liquid. Therefore, the mass detected by the crystal also includes liquid trapped and coupled to the adsorbed film. The instrument also has the ability to measure the dissipation factor73, 77, 80 that is related to the viscoelastic properties of the
film. The dissipation factor is related to the decay time, t, of the shear wave and provides a measure of energy losses in the system. The dissipation factor is defined as:
where Edis is the energy dissipated during one period of oscillation and Esto the energy stored. The dissipation factor gives a measure of the damping of the
nC
Δf
Δm
Eq. 3 sto disE
E
D
2
Eq. 4 Eq. 3 Eq. 4oscillation. A low dissipation value is related to a low energy loss and a high dissipation value to a high energy loss. From the dissipation change, information about interactions between the adsorbed film and the surrounding medium as well as structural changes can be extracted. A flat and rigid film usually gives a low dissipation value since the damping of the film is low. A soft loosely adsorbed film with high water content gives a high dissipation value due to its greater damping. Thus, the dissipation can be said to be a measure of the rigidity or viscoelasticity of the adsorbed film. The Voigt viscoelastic element with a dashpot and a spring connected in parallel is often used to describe the viscoelastic properties of adsorbed film of biopolymers. The film is assumed to be evenly distributed on the substrate surface, and its viscoelastic properties are represented by the loss and storage modulus as the frequency dependent complex shear moduli, Gf, of the layer.
where G’’f is the loss modulus and G’f is the storage modulus related to the film viscosity, (G’’=whf), and elasticity, (G’= mf), respectively. The relationship between G’’f /G’f gives a measure of the stiffness of the adsorbed film. A value < 1 is considered to represent a viscous, more fluid like, film where as a value > 1 is considered to indicate a more elastic film. The viscoelastic properties and film thickness of the adsorbed film can be calculated using the software Q-Tools, provided by Q-Sense. The calculations are based on the general solution of the wave equation, as explained elsewhere81, where a model as illustrated in Figure
4 is used.
Figure 4. Schematic illustration of the one-layer model used in the Voigt based
'' ' 0
2
f f f f fi
f
G
iG
G
Eq. 5 Eq. 5Bulk (
ρ
b,
η
b)
Film (
ρ
f,
µ
f,
η
f)
Quartz (
ρ
q,
µ
q)
h
fh
qh
bThe experimentally measured change in frequency and dissipation is fitted to:
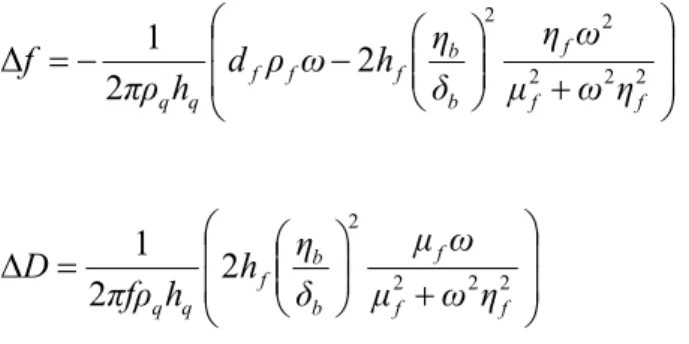
Where m and h is the shear modulus (shear elasticity) and viscosity of the film (index f), respectively and w (w = 2pf) is the angular frequency of oscillation. The
film thickness is represented by hf, and the viscous penetration depth of the shear wave in the bulk liquid by db. From the modelled thickness hf, the Voigt mass mVoigt, is calculated using the film density rf, according to:
As ellipsometry provides the “dry” mass of the adsorbed film and QCM-D the mass of the film and coupled water, combining these methods the water content of the adsorbed film can be calculated according to Eq. 9.
QCM-D was used in Paper IV to determine the viscoelastic properties and the Voigt mass of BSM adsorbed at different surfaces. These properties were determined upon compaction and decompaction of the BSM film. Modelling of the experimental data using the two-layer model (i.e. two adsorbed layers), BSM and AlCl3, was also performed. However, the fit to the one-layer model was in better correlation with experimental data.
47
solution of the wave equation, as explained elsewhere81, where a model as
illustrated in Figure 4 is used.
Figure 4. Schematic illustration of the one-layer model used in the Voigt based calculations.
The experimentally measured change in frequency and dissipation is fitted to:
2 22 2 22
2
1
Δ
f f f b b f f f q qμ
ω
η
ω
η
δ
η
h
ω
ρ
d
h
πρ
f
Eq. 6
2 2 2 22
2
1
f f f b b f q qμ
ω
η
ω
μ
δ
η
h
h
πfρ
D
Eq. 7Where and is the shear modulus (shear elasticity) and viscosity of the film (index f), respectively and ( = 2f) is the angular frequency of oscillation. The film thickness is represented by hf, and the viscous penetration depth of
the shear wave in the bulk liquid by b. From the modelled thickness hf, the
Voigt mass mVoigt, is calculated using the film density f, according to:
Bulk (
b,
b)
Film (
f,
f,
f)
Quartz (
q,
q)
h
fh
qh
b f f Voigth
m
Eq. 8100
(%)
Voigt ellips Voigtm
m
w
Eq. 9 f f Voigth
m
Eq. 8100
(%)
Voigt ellips Voigtm
m
w
Eq. 9 Eq. 6 Eq. 7 Eq. 8 Eq. 9Atomic force microscopy (AFM)
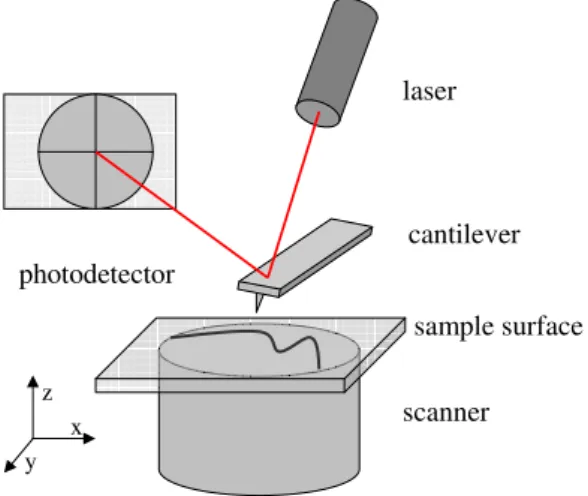
Atomic Force Microscopy82 is a powerful tool for high resolution topographical
imaging as well as for force measurements providing useful information on local surface properties such as elasticity, electrical surface charge, and adhesion. AFM works by probing surfaces with a sharp tip (apex with a typical size of a few nm) attached at the free end of a very soft cantilever. In most systems, the sample rests on top of a piezoelectric tube (the scanner) as illustrated in Figure 5, so that its position can be controlled with sub-nm precision. A similar precision is achieved in the monitoring of the deflection of the cantilever, commonly relying on an optical detection system; a laser beam is focussed on the free end of the cantilever, and the reflected beam is monitored with a segmented photo detector that allows discriminating between the vertical and lateral deflections of the cantilever. Both the positioning system and the photo detector signals are connected to an electronic unit, which is computer-controlled.
Figure 5. Schematic illustration of the important parts of the AFM: laser, cantilever/probe, sample surface, scanner and the photo detector.
contact Mode Imaging
The ability to control both the relative position between tip and sample and the deflection of the cantilever with sub-nm resolution allows visualisation of the sample in several different ways, which vary in the resolution achieved, the invasiveness, and the information complementary to the topography. In the work of this thesis the method known as contact mode imaging have been used;
scanner sample surface cantilever photodetector laser x z y
39
deflection of the cantilever. This is achieved by activating a feedback circuit that constantly adjusts the vertical position of the sample by applying an electrical voltage to the piezoelectric tube that holds it. The topography signal is then created by inverting the vertical movements of the sample during the scan.
Force measurements
AFM allows measurements of the forces that develop between tip and sample. This is commonly done by recording force curves; i.e. the sample is displaced vertically while the vertical signal is simultaneously monitored using the photodiode. This signal can then be transformed to the force exerted by the sample on the tip as follows. First, the photodiode signal related to the deflection of the cantilever is determined through a factor that can be inferred from a force curve itself. This factor, known as the deflection sensitivity, is determined by pushing the tip to a hard sample. While in contact, the increase in the photodiode vertical signal will correspond to an increase of the deflection of the cantilever that is equal to the vertical displacement of the sample (which is controlled by the user and, thus, known). The ratio between the sample vertical displacement and the photo detector signal is the deflection sensitivity. For transforming deflection,
d, into force, F, the cantilever is usually considered as a linear spring, so that
both magnitudes are related through the normal force constant of the cantilever,
kN, in accordance to Hook’s law: F=kN*d. This process allows plotting the force
exerted on the tip for different vertical positions of the sample, the most common representation of force curves.
Force curves allow the interpretation of tip-sample interaction in terms of law forces. However, for this, it is first needed to transform force curves into a representation of the force vs. the real distance between tip/probe and sample83.
Once this is done, they can be fitted with force laws in order to obtain different parameters of the interaction or even the interaction energy. The interaction energy is usually obtained by making use of the Derjaguin approximation16 that
relates force and interaction energy through a factor that depends on the size and geometry of the interaction surfaces. In AFM, the sample is usually considered as a plane and the tip/probe as a sphere. In this case, and for separations smaller than the interacting surfaces, the force, F, and the interaction energy, W, are related by
D
RW
D
F
2
Eq. 10
26D
AR
D
F
vdW
Eq. 11 Eq. 10where R is the effective radius of the sphere, and D the sphere-plane/sphere-sphere separation.
In this thesis, most AFM experiments have been performed in aqueous solutions with a low ion concentration. Under these conditions, tip-sample interactions can be modelled with the DLVO theory18, 19. This theory states that the interaction
between two surfaces can be described by the linear combination of van der Waals (vdW) and Electrostatic Double Layer (EDL) interactions. The vdW force,
FvdW, between a sphere and a plane is given by:
where A is the Hamaker constant of the system and depends on the properties of the interacting bodies as well as on the medium in which they interact.
When two charged surfaces immersed in an electrolyte solution approach each other, a force is generated due to the overlapping of their respective EDLs. For a sphere interacting with a planar surface, both with constant surface electrical potentials, this force can be approximated by:
where e0 is the dielectric constant in vacuum, er is the relative dielectric constant
of the medium, k is the inverse Debye length and y1 and y2 are the electrical surface potentials of each interacting surface.
Nanometer-sized tips present several drawbacks for force measurements. As can be inferred from the previous equations, simple analytical expressions for the force are based on well-determined sizes and geometries of the interacting surfaces. However, it is almost impossible to precisely determine the size and geometry of nm-sized tips. Consequently, there is an intrinsic inaccuracy in the process of fitting force curves recorded with such tips. To overcome this drawback, Ducker and co-workers84 developed the colloidal probe technique
where a µm-sized particle of known size and shape is glued to a cantilever, and