IMPLEMENTING ROAD SAFETY INSPECTIONS IN IRELAND AND
INITIAL RESULTS
Desmond O’Connor Transport Infrastructure Ireland
Parkgate Business Centre, Parkgate Street, Dublin 8, D08 YFF1, Ireland Phone: + 353 1 6463400 E-mail: des.oconnor@tii.ie
Co-authors(s); Harry Cullen, TII; Forbes Vigors, TII; Alastair de Beer, TII, Maurice Leahy, TII.
1.
ABSTRACT
This paper will focus on changes to the implementation of road safety inspections in Ireland following the requirement, under EU Directive 2008/96/EC on Road Infrastructure Safety Management (2008), for the establishment of periodic road safety inspections (RSI) of existing roads, along with safety impact assessments, high accident concentration ranking and road safety audits (RSA). Ireland, along with fellow EU member states, were required to adopt guidelines ensuring road safety inspections were carried out by a competent entity in order to safeguard adequate safety levels for road infrastructure [1].
By using a case study, this paper will outline the transition Transport Infrastructure Ireland (TII) has made by embracing new technology. This proactive approach to improving road safety contrasts with the reactive ‘black spot’ approach based on historical collision data. Incorporating RSI and the additional requirements (e.g. RSA) of the Directive 2008/96/EC into existing design standards has provided TII complimentary tools to better enable designers’ effect positive change to the road environment in Ireland.
2.
BACKGROUND
TII embarked on its first road safety inspection programme in 2012 following the EU Road Safety Infrastructure Management (RSIM) Directive and the ERA-NET call. Part of this research call focused the requirement for common evaluation tools and implementation strategies. Some of the results from the RSI activity on Ireland national road network are outlined in this paper.
The Road Safety Infrastructure Management (RISM) Directive required EU member states to establish and to implement procedures in relation to:
• road safety impact assessments • road safety audits
• safety ranking and the management of the road network in operation, and • safety inspections
The Directive also required the adoption of “guidelines in order to support the competent entities” [1]. These entities included both public and private organizations that were to be involved in implementing the directive. TII faced a number of challenges in relation to road safety inspections as there wasn’t a local history of previous inspections to leverage knowledge about the practical mechanics of undertaking such a volume of work. In addition, the published material from other countries suggested
that there were a number of different approaches to RSI [2]. Likewise Cardoso, et al. put forward the premise that “RSI are on of the least agreed upon safety management practices in Europe” [3].
Road infrastructure safety is of major interest to the transportation sector and is supported by a number of directives and initiatives like EU Directive 2008/96/EC. A research call from ERA-NET [2], looking for common evaluation tools and implementation strategies to be used in carrying out inspections, was answered by a number of successful researchers. One of the projects resulting from this call was the EuRSI project. The EuRSI research consortium was headed by the National University of Ireland Maynooth (NUIM). They set out to address the issues around collecting route environment data and related infrastructure for the specific purpose of inspecting a road network. The results of this work centred on the development of a mobile mapping system including hardware and software for data collection and data extraction. EuRSI made significant progress in understanding the route data collection challenges faced by road authorities across Europe. However, further work was needed to simplify the process and to reduce costs associated with deploying similar mobile mapping units to collect date for use within a road safety inspection programme.
2.1. EuRSI
The EuRSI project, standing for European Road Safety Inspection, looked at the implementation of Road Safety Inspections on rural roads where a large percentage of fatalities had occurred. EuRSI was one of the research projects funded under the Safety at the Heart of Road Design research call. The consortium leader for EuRSI was NUIM with funding provided by the European Road Safety Research Programme (ERA-NET). The EuSRI project’s aim was to develop up-to-date technologies for data collection and RSI procedures along with investigating approaches to risk management on rural roads [4]. In addition, this work included an examination of the introduction of a trans-national standard to promote a common approach for RSI. A lack of a common approach has been highlighted by other research into RSI [2,3].
A core activity within the EuSRI mobile mapping research task was to investigate various automated and semi-automated approaches to processing geocoded LiDAR in order to extract features and to reconstruct the route corridor in 3D. Mobile platforms which combine mapping and navigation sensors on a rigid mount to collect geospatial data are collectively termed mobile mapping systems (MMS). While the project substantially succeeded in the technical aspects, the prospect of road authorities commissioning such a specialised mobile terrestrial based mapping unit was remote. The economic climate of the time, back in 2009 when the final work packages were delivered, precluded many road authorities from commissioning relatively unproved bespoke systems like the proposed MMS. Compounding the lack of uptake from EuRSI was general conservative nature of road authorities whose remit rarely included large spatial data collection and corresponding data management programmes. However, the need for a similar but low costs MMS system remained, particularly for Ireland.
2.2. Ubipix.
Ubipix is a platform that can trace some of its ambitions back to the work NUIM began with the EuRSI project. Post the conclusion of the EuRSI project the consortium leader continued to address issued related to cheap but robust technologies to allow road authorities to gather data during drive through inspections for a survey vehicle akin to lightweight MMS. TII was an early adopter of the Ubipix tool and was involved in helping test some of its core functionality. Ubipix has been adopted by TII as a standard tool in the carrying out road and traffic management inspections as it enables GPS video and images to be recorded, uploaded, tagged, analysed and shared online within minutes [5].
Another benefit is the cost savings. Ubipix has highly automated data platform services, collects data once and with rapid speed, and can be re-used many times whenever and wherever needed. The platform supports different devices for collecting spatial video from low cost smart phones to multiple camera systems. Ubipix has numerous applications including; Network Maintenance (Asset Inspection, Infrastructure Condition, Sign & Markings) and Road Safety Survey (RSI, RSA), thereby making the system an attractive cost effective data platform for road authorities involved in these activities. Figure: 1 gives a brief summary of the process of capturing and publishing data using Ubipix.
Figure 1: Summary of process of capturing and publishing process using Ubipix.
Figure 2 shows a typical screen layout post the upload of the captured video. This screen shows the pooling of water on the side of the road. The overview aerial map shows the actual location of the water hazard in relation to the route as indicated by the linear reference ID (ID = N58MO-002.0). Other tagged hazards near by are also shown in the aerial overview map (green dots).
Figure 2: Capturing of road hazards during a Safety Inspection using Ubipix and tagging/attributing these hazards.
Overview map with tagged hazards
Dashboard camera captured video, uploaded and later tagged to identify and rate hazards
2.3. RSI Team
RSI team leaders in Ireland are required to have ten years post graduate experience with a minimum of seven years in the design and construction of Road Projects and/or Road Safety Schemes and have two or more years experience of collision investigation and remedial measures. Additional requirements include experience in road safety audits as team member, and to hold a Certificate of Competence in Road Safety Audit.
As a minimum, RSI teams comprise of both a team leader and team member. The member must also demonstrate experience in design and construction along with experience on road safety schemes. The team drive a complete route in each direction and conduct both a day and night survey. All side roads, within 200 metres of the mainline route, are also inspected and each team records a video of the inspection that will be hosted on the Ubipix platform.
Tapping into the functionality of Ubipix, once the spatial video has been uploaded and processed, means the teams have more time to review identified hazards away from the road environment. Standardised key words, describing the hazard, are used by the teams to help consistently attribute and describe these hazards. Ubipix is able to present all of this information within a relatively intuitive interface, convenient for finding sections of the network or specific features identified along the network. Detailed results of completed inspections along the N77 route are presented in Section 4. At the most basic level each hazards is attributed has having a high, medium or a low risk. The risk is automatically assigned based on the likelihood of a collision occurring and the severity of any potential collision. This matrix is described in section 3.
In Ireland RSI inspections commenced in Q3 2012, with a second round of inspections to commence in Q3 2016. The first inspection programme covered approximately 5,500 km of national road network. Although the Directive mandates road authorities to inspect only the TERN network the inspection programme was extended to avoid a two tier system. In Ireland the majority of the TERN network is composed of motorways. As motorways have easily outperformed any other road type in terms of safety the case to extend RSI beyond the TERN to rural single carriageway network was compelling. The lower order network is where RSI teams are more likely to identify issues to help maximise safety returns from engineering interventions. As well as expanding the inspection regime the frequency of inspections differs on the TERN and the non-TERN national road network. Motorways are to be inspected every five years and the remaining national roads are to be inspected every three years.
3.
DATA CAPTURE.
During the early days of implementing RSI a number of workshops were set up amongst the RSI teams to help ascertain practical approaches to collecting RSI data for later analysis. A well developed Network Safety Ranking Process was already making use of a linear referencing system (LRS). The LRS was a convenient approach to record location details along a route. Initially maps were produced with road sections labelled by the LRS that uniquely identified each section. This identification was made up from the route name itself, the LRS reference (kilometre marker posts) in addition to the name of the local administrative area traversed by the route. For example, the section identified by N77LS_046.7 is a 1 km section of road on the N77 route within the Laois administrative area, ending at marker post 046.7 km. Similar standardised reports containing basic location information were described with the RiPCORD-iSEREST report on best practice and implementation for RSI [3].
Follow-up workshops were held after a number of routes were surveyed by the RSI teams. Although this simple low tech approach worked, the feedback from the teams highlighted two difficulties. Firstly, numerous teams reported on the difficulty managing the physical route maps while recording observations from the passenger seat of the survey vehicle, especially during night surveys. Less problematic for the teams was the attribution of the hazards, identified on the maps, into the spreadsheet. Secondly, a number of teams made seemingly minor amendments to the spreadsheet that later made route analysis difficult when compiling all the data into a central database.
Initially the Ubipix platform wasn’t considered for RSI work. Ubipix video files were limited to 15 minute recordings. This was the main reason for this decision to forgo widespread use of Ubipix. Additionally the limited battery life of mobile camera/phone systems concerned some of the RSI teams about the practicality of using Ubipix. However, as changes to Ubipix and camera systems were developed during the early part of the Irish RSI programme, these improvements allowed for Ubipix to be more widely adopted amongst the RSI teams. Some twenty routes were surveyed and attributed using the improved Ubipix platform during the latter part of 2013 and through 2014. These routes can be described, in general, as rural single carriageways but of varying cross section. Together the routes surveyed using the Ubipix system amounted to approximately 2,000 km of single carriageways.
Table 1 Risk Breakdown by route and comparative hazard density (hazard count per km)
There are some obvious anomalies within the data that have yet to be fully investigated. The initial thoughts on the source of these discrepancies relate to how the individual teams implemented the Risk Rating Matrix shown in Table 2. This was a table developed during the earlier RSI workshops. The overall hazard risk was to be a function of the likelihood of occurrence and the severity of the outcome of the collision occurrence due to the hazard.
Table 2 Hazard Risk Matrix
Route Count H hazards Count M hazards Count L hazards Length KM Hazard density H Hazard density M Hazard density L
N02 26 1417 783 132.86 0.20 10.67 5.89 N04 140 54 48 197.96 0.71 0.41 0.36 N10 3 13 22 17.02 0.18 0.10 0.17 N11 15 102 103 129.38 0.12 0.77 0.78 N21 14 44 38 84.34 0.17 0.33 0.29 N27 2 16 18 6.26 0.32 0.12 0.14 N29 2 31 28 3.53 0.57 0.23 0.21 N30 47 150 377 33.17 1.42 1.13 2.84 N52 60 214 1032 177.33 0.34 1.61 7.77 N58 12 89 9 11.26 1.07 0.67 0.07 N59 122 678 1462 298.83 0.41 5.10 11.00 N65 41 44 103 52.56 0.78 0.33 0.78 N67 71 208 265 129.16 0.55 1.57 1.99 N70 26 1004 77 141.64 0.18 7.56 0.58 N71 259 266 168 188.01 1.38 2.00 1.26 N73 86 33 28 34.24 2.51 0.25 0.21 N75 25 30 14 7.55 3.31 0.23 0.11 N77* 15 51 83 48.66 0.31 0.38 0.62 N80 8 40 274 114.47 0.07 0.30 2.06 N83 97 165 164 45.19 2.15 1.24 1.23 N84 70 125 206 74.06 0.95 0.94 1.55 N86 36 134 38 50.19 0.72 1.01 0.29
Risk Rating Likelihood of Occurrence Likely Possible Unlikely Severity
of Outcome
Severe High High Medium
Medium High Medium Low
The principle behind the matrix is akin to the approach with safety audits, where potential hazards are described and consequences listed if the hazard is left in situ. Future work is planned to revisit the current risk matrix to see if it’s possible to establish a more robust matrix based on evidential data as suggested by Cafiso, et al. when describing the formulation of a safety index (SI). An SI is a measure of risk derived from an exposure factor, a collision frequency factor and an accident severity factor [3].
Looking at a the first route list in Table 1, the number medium and low risk hazards identified along the N2 greatly exceed the number of high risk hazards. This is in contrast to the N4 where the number of high risk hazards exceeds the number of medium and low hazards identified during the survey. These routes were inspected by two different teams and it’s understandable that some variation exists between teams in how they applied the Risk Matrix. However comparing these two routes and the distribution of identified hazards raises issues that have to be dealt with at a deeper level, beyond the scope of this paper. Having a better understanding of these observed types of anomalies will be important to inform upcoming RSI workshops in advance of the next round of RSI in Q3 2016.
Although Table 1 shows a wide variation of risk per kilometre over the surveyed network, further analysis is required to determine the safety issues behind these risk ratings. Rather than take a route with obvious high risk issues, it was considered that an examination of the N77 would yield more practical insights from these initial RSI surveys. The N77 is more typical of other routes listed in Table 1 and less like the N02 or N04.
4.
N77 CASE STUDY.
The N77 is a national secondary route connecting the large urban areas of Portlaoise and Kilkenny 50km further south. Between these two large urban centres the route traverses through rural countryside servicing a disperse population and the towns of Abeyleix, Durrow and Ballyragget. The road cross-section varies from a narrow lane carriageway (2.5 m) with no hard shoulder to a wide single lane (3.5 m) with hard shoulders. The average traffic volumes are typically in the range of 4300 to 9600 AADT with range between 12 - 21% per cent of HGVs. Along the rural section there are 38 at-grade junctions, typically used by the local rural community to access isolated domestic dwellings and farmland. As with all RSI surveys each junction was inspected to assess visibility at the junction mouth.
The following tables describe the hazards identified along the route and are classified into three categories, namely Risk, Design & Maintenance as well as a Mainline & Side Road category.
categories.
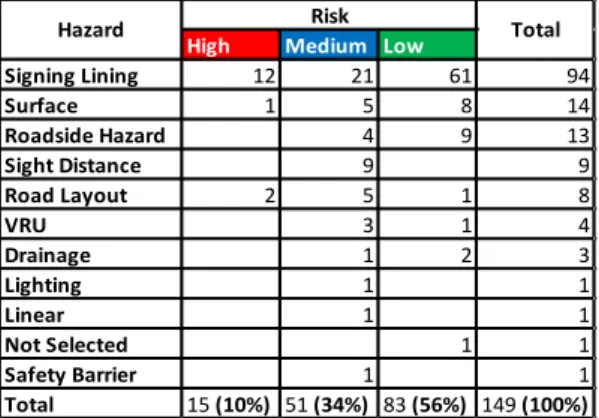
Table 3 Breakdown by Hazard and Risk Type
High Medium Low
Signing Lining 12 21 61 94 Surface 1 5 8 14 Roadside Hazard 4 9 13 Sight Distance 9 9 Road Layout 2 5 1 8 VRU 3 1 4 Drainage 1 2 3 Lighting 1 1 Linear 1 1 Not Selected 1 1 Safety Barrier 1 1 Total 15 (10%) 51 (34%) 83 (56%) 149 (100%) Total Hazard Risk
The majority of the high risk hazards are related to signing and lining (road marking) issues, as shown in Table 3.
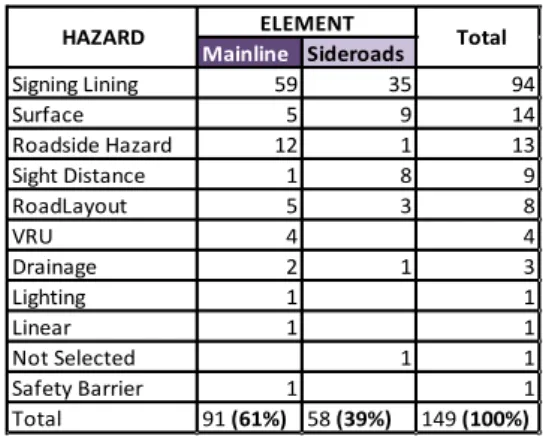
The next category divides the hazards into design issues and maintenance issues (Table 4). The ratio of maintenance issues to design issues is in the order of 3:1. The vast majority of the maintenance issues relate to signing and road markings. The third category shows (Table 5) the breakdown of hazards identified between the mainline and side roads.
Table 4 Breakdown by Hazard into Table 5 Breakdown by Hazard into Mainline Design and Maintenance issues and Side Road issues
Although this presentation of the data has its uses, particularly at a route level, the spatial or location component to help identify local risk is missing at a more local level (akin to hot-spots). The nature of the data collection, via Ubipix, has allowed for this spatial component to be exploited. Figure 3 is a representation of the same data, as displayed above, with the addition of the spatial component. Along the horizontal axis the chainage (marker post reference) for the entire 50km of the route is shown. The vertical axis shows the risk each hazard has been assigned. Red represents the highest risk and green the lowest. The data shows significant issues from chainage 7 to chainage 9 north of Kilkenny. A similar pattern is observed around chainage 27. The number of high to medium risk hazards drops off as the route approaches Portlaoise. This section of road is typically a wider cross-section with hard shoulders.
Figure 3 Distribution of hazards along the N77 from Kilkenny to Portlaoise
An alternative representation of the data shown in Table 5 and 6 details the risk issues observe in Figure 3. At chainage 9 (ID N77KK_009.0), the split between the mainline and side road hazards is approximately 40/60 per cent. However, all the hazards identified will be fixed under the existing maintenance regime. In comparison, those hazards further north, around chainage 27 (where site ID =
Design Maintenance Signing Lining 11 83 94 Surface 14 14 Roadside Hazard 10 3 13 Sight Distance 4 5 9 Road Layout 7 1 8 VRU 4 4 Drainage 3 3 Lighting 1 1 Linear 1 1 Not Selected 1 1 Safety Barrier 1 1 Total 37 (25%) 112 (75%) 149 (100%) Nature of Hazard
Hazard Total Mainline Sideroads
Signing Lining 59 35 94 Surface 5 9 14 Roadside Hazard 12 1 13 Sight Distance 1 8 9 RoadLayout 5 3 8 VRU 4 4 Drainage 2 1 3 Lighting 1 1 Linear 1 1 Not Selected 1 1 Safety Barrier 1 1 Total 91 (61%) 58 (39%) 149 (100%)
HAZARD ELEMENT Total
0 1 2 3 4 5 6 7 8 9 10 11 12 13 14 15 16 17 18 19 20 21 22 23 24 25 26 27 28 29 30 31 32 33 34 35 36 37 38 39 40 41 42 43 44 45 46 47 48 49 50 Assi gn ed R isk Chainage
N77LS_027.0), are a mixture of design and maintenance issues with the majority of hazards related to the mainline. With this level of understanding, of both the principal issues that need to be addressed and the location of these design and/or maintenance issues, designing a works programme to redress these shortcomings becomes a much more structured and manageable process.
Table 5 Hazards identified on Mainline and Side Roads Table 6 Design Hazards
5.
CONCLUSIONS & LESSONS LEARNED
Road safety inspections are a relatively new concept to be addressed within the Irish road network. Enough tangible insights have been delivered form the analysis of the data to show RSI has made a positive contribution to knowledge of road safety issues on the Irish national road network. A formal appraisal of the work carried out is required to ensure further investment in RSI will deliver a return on the investment. Discussions are ongoing to initiate this task.
The initial routes which have had RSI carried out have consisted mainly of motorways. The Irish part of the TERN network consists mostly of motorway. Issues about inconsistencies in signing of motorway interchanges were raised by the RSI teams involved very early on in the process. This information was communicated to the motorway network managers in order to address and undertake remedial action. It was clear that important information stemming from RSI surveys needed to be quickly disseminated to the appropriate functional units to address. RSI should not be viewed as a process where the information is collated and disseminated only at the end of the programme. The process needs to be able to provide updates to road managers as and when network wide issues have been identified. The issue of signage deficiencies and inconsistency around motorway interchanges and the subsequent prompt action to remedy this situation is an example of RSI delivering timely interventions. 0 2 4 6 8 10 12 N77KK_000.6 N77KK_003.1 N77KK_005.0 N77KK_007.0 N77KK_009.0 N77KK_011.0 N77KK_013.0 N77KK_015.0 N77KK_018.4 N77KK_021.0 N77LS_025.0 N77LS_027.0 N77LS_029.0 N77LS_032.0 N77LS_035.6 N77LS_038.0 N77LS_041.0 N77LS_043.0 N77LS_045.0 N77LS_046.7 N77LS_048.7 Hazard Fequency Mainline Sideroad 0 2 4 6 8 10 12 N77KK_000.6 N77KK_003.1 N77KK_005.0 N77KK_007.0 N77KK_009.0 N77KK_011.0 N77KK_013.0 N77KK_015.0 N77KK_018.4 N77KK_021.0 N77LS_025.0 N77LS_027.0 N77LS_029.0 N77LS_032.0 N77LS_035.6 N77LS_038.0 N77LS_041.0 N77LS_043.0 N77LS_045.0 N77LS_046.7 N77LS_048.7 Hazard Frequency Design Maintenance
However, matching hazards to work programmes hasn’t been straightforward. For example, water ponding on the carriageway, picked up on a drive through RSI survey, may be due to an unusual localised torrent of rain or alternatively it may be indicative of local drainage issues. Identifying work packages from RSI surveys remains an issue that needs further consideration before the next round of RSI commences.
Additional issues that have been highlighted early on in process related to inconsistency in bend/curve treatments. The proliferation of different treatments is related to the lack of design standards in this area. The RSI process has highlighted and quantified these types of deficiencies at a network level that otherwise would have remained unknown.
The development of Ubipix has greatly eased the collection of road data as well as the storage and dissemination of data. To date there have been in excess of 20 individual accounts set up related to RSI. From these 20 accounts approximately 950 separate video recordings have been uploaded to the Ubipix platform. This data amounts to some 205 G-Bytes of data accounting for 109 hours of video. Only a few technical issues have been reported by the teams using the Ubipix platform and these have generally been minor in nature.
The RiPCORD-iSEREST report [2] raised interesting questions around the area of detecting hazards and the consequences of acting or not acting upon this knowledge. During 2016 another round of RSI is due to commence and although the technical challenges are not expected to be as onerous there will be new challenges to be addressed. For example, having two sets of comparable data, along the same section of road, may allow for some automatic detection of changes to the road environs to be established. Potentially there will be a positive correlation between detecting change between the two sets of data and the actions to remove or mitigate the hazards identified during the previous RSI.
6.
REFERENCES
1. European Parliament and Council of the European Union. Directive 2008/96/EC on Road
Infrastructure Safety Management. [Online] Available at http://eur-lex.europa.eu/. [Accessed
29 November 16]
2. Cardoso, J. L, Christian, S, Elvik, R & Sorensen, M 2007. Road Safety Inspection – Best
Practice Guidelines and Implementation Steps. [Online] Available at:
http://ec.europa.eu/transport/roadsafety_library/publications/ripcord_d05_road_safety_inspect ions.pdf [Accessed 29 November 16]
3. Cafiso, S, La Cava, G & Montella, A 2011. Safety Inspections as Supporting Tool for Safety
management of Low-Volume Roads. [Online] Available at:
https://www.academia.edu/1296124/Safety_Inspections_as_Supporting_Tool_for_Safety_Ma nagement_of_Low-Volume_Roads [Accessed 29 November 16]
4. ERA-NET Joint Research Programme. 2009 Call: Safety at the Heart of Road Design . [ONLINE] Available at:
http://www.eranetroad.org/index.php?option=com_content&view=article&id=74&Itemid=74. [Accessed 29 November 16].
5. McCarthy, T 2012. Final Report: European Road Safety Inspection (EuRSI). [Online] Available at
http://eranetroad.org/index.php?option=com_docman&task=doc_download&gid=30 8&Itemid=53. [Accessed 29 November 16].
6. iGeotec Ltd.. 2015. About Ubipix. [ONLINE] Available at: http://www.ubipix.com/about-us/. [Accessed 25 February 16].