Water and Environmental Studies
Department of Thematic Studies
Linköping University
Master’s programme
Science for Sustainable Development
Master’s Thesis, 30 ECTS credits
ISRN: LIU-TEMAV/MPSSD-A--12/009--SE
Linköpings Universitet
Climate Change Vulnerability Assessment
for Sustainable Urban Development: A Study
on Slum Population of Kota, India
Water and Environmental Studies
Department of Thematic Studies
Linköping University
Master’s programme
Science for Sustainable Development
Master’s Thesis, 30 ECTS credits
Supervisor: Anna Jonsson
2012
iClimate Change Vulnerability Assessment
for Sustainable Urban Development: A Study
on Slum Population of Kota, India
Raisin Akhter Feroz
ii
Upphovsrätt
Detta dokument hålls tillgängligt på Internet – eller dess framtida ersättare – under 25 år från publiceringsdatum under förutsättning att inga extraordinära omständigheter uppstår.
Tillgång till dokumentet innebär tillstånd för var och en att läsa, ladda ner, skriva ut enstaka kopior för enskilt bruk och att använda det oförändrat för ickekommersiell forskning och för undervisning. Överföring av upphovsrätten vid en senare tidpunkt kan inte upphäva detta tillstånd. All annan användning av dokumentet kräver upphovsmannens medgivande. För att garantera äktheten, säkerheten och tillgängligheten finns lösningar av teknisk och administrativ art.
Upphovsmannens ideella rätt innefattar rätt att bli nämnd som upphovsman i den omfattning som god sed kräver vid användning av dokumentet på ovan beskrivna sätt samt skydd mot att dokumentet ändras eller presenteras i sådan form eller i sådant sammanhang som är kränkande för upphovsmannens litterära eller konstnärliga anseende eller egenart.
För ytterligare information om Linköping University Electronic Press se förlagets hemsida http://www.ep.liu.se/.
Copyright
The publishers will keep this document online on the Internet – or its possible replacement – for a period of 25 years starting from the date of publication barring exceptional circumstances.
The online availability of the document implies permanent permission for anyone to read, to download, or to print out single copies for his/her own use and to use it unchanged for noncommercial research and educational purpose. Subsequent transfers of copyright cannot revoke this permission. All other uses of the document are conditional upon the consent of the copyright owner. The publisher has taken technical and administrative measures to assure authenticity, security and accessibility.
According to intellectual property law the author has the right to be mentioned when his/her work is accessed as described above and to be protected against infringement.
For additional information about Linköping University Electronic Press and its procedures for publication and for assurance of document integrity, please refer to its www home page: http://www.ep.liu.se/.
iii
Table of Contents
ABSTRACT ... 1
LIST OF ABBREVIATIONS ... 2
1 INTRODUCTION ... 3
1.1 Aim and Research Questions ... 4
1.2 Structure of the Thesis ... 4
2 LITERATURE REVIEW ... 5
2.1 Vulnerability/Resilience to Climate Variability or Change ... 5
2.2 The Approaches of Vulnerability Studies ... 5
2.2.1 Risk-hazard Approach ... 6
2.2.2 Political Economy Approach ... 6
2.2.3 Integrated Approach ... 6
2.2.3.1 Exposure ... 6
2.2.3.2 Sensitivity ... 7
2.2.3.3 Adaptive capacity ... 7
2.3 Urban Vulnerability to Climate Change ... 7
2.4 Urban Climate Governance ... 8
2.4.1 Stakeholders and Local Authorities ... 9
2.5 Linking Climate Adaptation and Sustainable Development ... 10
3 METHODS AND MATERIALS ... 12
3.1 Selection of Experimental City ... 12
3.1.1 Kota City Profile ... 12
3.1.1.1 Geographical Location ... 12
3.1.1.2 Climatic Properties ... 12
3.1.1.3 Demographics ... 12
3.1.2 Slum as „a case in the case‟ ... 13
3.2 Data Collection ... 13
3.2.1 Stakeholder Meeting ... 13
3.2.2 Web Search ... 14
3.2.3 Data from Questionnaire Survey by Urban Local Body (ULB) ... 15
3.3 Data Analysis ... 15
iv
4 RESULTS & DISCUSSION: EXPOSURE OF KOTA CITY ... 18
4.1 Identification of Challenges ... 18
4.1.1 Groundwater Depletion ... 19
4.1.2 Sanitation and Sewage ... 20
4.1.3 Solid Waste ... 20
4.1.4 Flash Floods ... 21
4.1.5 Pollution (water) ... 21
4.1.6 Heat Wave ... 22
4.2 Challenges of Slum Areas ... 23
5 RESULTS & DISCUSSION: SENSITIVITY OF VULNERABLE GROUP AT KOTA .... 26
5.1 Assessment of Person‟s Vulnerability ... 26
6 RESULTS & DISCUSSION: ADAPTIVE CAPACITY OF VULNERABLE GROUP AT KOTA ... 30
6.1 Determinants of Adaptive Capacity ... 30
6.2 Adaptive Capacity of the Vulnerable Group ... 31
6.2.1 Adaptive capacity to Current Vulnerability ... 31
6.2.2 Adaptive capacity to Future Vulnerability ... 33
7 CONCLUSION ... 34 7.1 Conclusion ... 34 7.2 Policy Recommendation ... 35 8 ACKNOWLEDGEMENTS... 38 9 REFERENCES ... 39 10 APPENDIXES ... 45
10.1 Appendix 1: Empirical Materials from Web Search ... 45
10.2 Appendix 2: Questionnaire for Slum Survey ... 47
10.3 Appendix 3: Calculation of Data from Questionnaire Survey ... 55
1
ABSTRACT
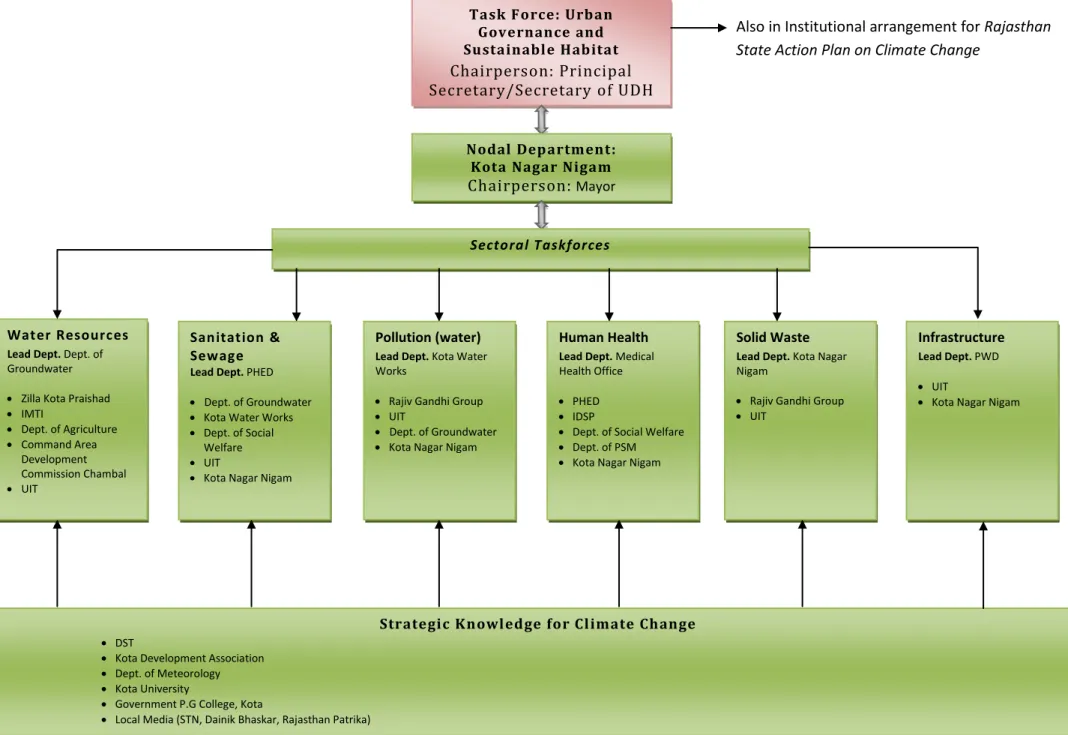
The urban centres are becoming more vulnerable to climate change because of the rapid urbanization and the inequality of urban development. This study assesses the urban vulnerability in an integrated approach focusing the slum people as the targeted group. The slum people are severely exposed to climate risks in terms of city‟s overall development. The negative indications of the indicators of person‟s vulnerability represent their high sensitivity to the adverse impact of climate change. The determinants of adaptive capacity also confirm that the slum people are more vulnerable to climate change with having lower adaptive capacity; though, the city is possessing high development indexes. In this context, an institutional structure is developed to build multi-level urban climate governance with the involvement of all relevant stakeholders based on the case study and literature review to integrate the vulnerable group in development planning for climate change adaptation.
Key words: Adaptive capacity, Governance, Slum, Sustainable development, Urban,
2
LIST OF ABBREVIATIONS
ADB Asian Development Bank
BEVI Built Environment Vulnerability Index
CSPR Center for Climate Science and Policy Research DoE Department of Environment
DST Department of Science and Technology
HDI Human Development Index
ICLEI International Council for Local Environmental Initiatives IDSP Integrated Disease Surveillance Program
IMTI Irrigation Management & Training Institute IPCC Intergovernmental Panel on Climate Change PHED Public Health and Engineering Department PSM Preventive and Social Medicine
PWD Public Works Department
RPCB Rajasthan Pollution Control Board
UDH Urban Development and Housing Department UIT Urban Improvement Trust
3
1 INTRODUCTION
Climate change is indisputably recognized as a major global concern which has negative impacts on several sectors. The projected scenario of global climate change confirms its effects will take place unlikely to different regions and places (IPCC, 2007). In case of urban centres, low and middle income countries are the most at risk from the impacts of climate change. The total urban population in these countries is increasing rapidly and now it has been close to three-quarters of the world‟s urban population. The urban centres are becoming more vulnerable to climate change because of the rapid urbanization and the inequality of urban development (Moser and Stein, 2011). Particularly, the people in densely (Huq et al., 2007) and at high-risk areas are the most vulnerable to climate change (IPCC, 2007). In other sense, people of the slum areas or “a group
of individuals living under the same roof in an urban area, and lacking one or more of the following: durable housing, sufficient living space, easy access to safe water in sufficient amounts at an affordable price, access to adequate sanitation and security of tenure that prevents forced evictions (UN-Habitat, 2008)” are the most vulnerable to climate change. In
sustainable development policy agenda adaptation to climate change is confirming as an urgent issue to reduce the vulnerability for these low and middle income countries (Mukheibir and Ziervogel, 2007). On the contrary, according to Evans (2011), the unavoidable impacts of climate change are turning attention to the questions of adaptation. There is still lacking of conceptual clarity on adaptation which is creating debates on its practicality and attractiveness and generating more heat than light.
In climate adaptation process, vulnerability assessment is an important factor to consider. Vulnerability to climate change cannot be defined by assuming it as an isolated phenomenon. It is highly associated with the socioeconomic or non-climatic factors than the climatic ones (Hjerpe and Wilk, 2010). The latest and most accepted definition of vulnerability (IPCC, 2007) is emphasizing on the needs to examine exposure, sensitivity and adaptive capacity to assess the vulnerability of a system. Though, there are many studies on vulnerability to climate change but there has been little research focusing on the conceptualization of „urban vulnerability‟ to climate change (Romero-Lankao and Qin, 2011). On the other hand, present urban development pattern with the rapid urbanization are considered as the major drivers of urban vulnerability. At the same time, this development could be part of the solution when involvement of local authorities and stakeholders in development policy will be assured; whilst, they play the central role of urban development (Corfee-Morlot et al., 2011).
India is one of the more vulnerable and risk-prone countries in the world. The urban areas are experiencing rapid population growth and high differentials in access to various public services (Revi, 2008). The North-western region of India experiences heavy rainfall during the monsoon period but also facing droughts and higher extreme temperatures in summer. The non-climatic factors such as, rapid urbanization and industrialization, along with the climatic factors, are causing several challenges. Kota is the third largest city in Rajasthan and has experienced urbanization with 30% growth rate during the last decades and the hosts of several industries too (Gov of India, 2006). In this circumstance India does not have any existing research on climate adaptation, risk mitigation or vulnerability assessment for urban areas. Climate change should be considered as a major theme in the urban planning agenda and process to integrate climate change risk mitigation and adaptation. However, identification of city specific vulnerability and
4
risk is a prior issue in developing climate change adaptation framework at city level (Sharma and Tomar, 2010).
1.1 Aim and Research Questions
The objective of this thesis is to assess the vulnerability to climate change of slum populations of Kota city as a targeted group.
To reach the objective of this study, the following questions are raised and will be answered. 1. What are the main challenges of Kota city to which the city is exposed to climate change? 2. How do the slum populations more sensitive to climate change?
3. What is the level of the adaptive capacity of slum populations in terms of whole Kota city?
At the time of vulnerability assessment this thesis will also try to draw an institutional structure with integrating different stakeholders in order to ensure sustainable climate adaptation planning of Kota city.
1.2 Structure of the Thesis
The present thesis is structured in seven major chapters which are linked with each other in a logical sequence. Chapter one begins with fundamental issues of the study, such as, a brief background for problem formulation of this research work and the study objective with specific research questions.
Chapter two provides detailed theoretical perspective and conceptual framework, which opened up useful windows and avenues for looking at pertinent issues and features of complex innovation in the practical field.
Keeping consistency with previous two chapters, the contents of chapter three present the methods and techniques that were employed for data collection and analysis in order to achieve the research objective. A short description of the study area was also given in this chapter. The later three consecutive chapters are representing the results and discussions of this empirical study. The chapter four, five and six are organized with the three components of vulnerability assessment; exposure, sensitivity and adaptive capacity respectively.
A conclusion has been drawn in chapter seven with the support of results and discussions of previous chapters to relate the research questions. In this chapter there is also an institutional structure as a policy recommendation.
5
2 LITERATURE REVIEW
2.1 Vulnerability/Resilience to Climate Variability or Change
The studies on „vulnerability‟ have been carried out over the last two decades to understand the process of how climate change might affect the various natural and social systems (Ionescu et al., 2009). There have already been numerous attempts to define the term vulnerability (Adger, 2006; Adger and Kelly, 1999; Brooks, 2003; Brooks et al. 2005; Engle, 2011; Füssel, 2007; Füssel and Klein, 2006; Ionescu et al., 2009; Patt et al., 2005; Smit and Wandel, 2006). All of the studies tried to explain the significance of social, economical, political, natural or climatic factors in defining the vulnerability to climate variability or change. The argument on applicability of these vulnerability studies is increasing over the time. Predominantly in the case of urban or local adaption, the policymakers have failed to assess the vulnerability in a successful way (Evans, 2011; Fünfgeld, 2010; Ionescu et al, 2009).
One of the major problems of climate change research is the contending conceptualizations and use of different terminologies in vulnerability studies. The association among the scholars from many different research backgrounds should be based on a consistent terminology to communicate undoubtedly and transparently (Laroui and van der Zwaan, 2001). In climate change studies, scholars from ecology want to use the term „resilience‟ instead of vulnerability. According to Evans (2011), Social-Ecological System (SES), a prominent research programme which is able to describe the urban sustainability in the face of climate change in an integrated manner. For instance, Gallopín (2006) argued that as the concept emerged within ecology so it is applicable in the areas of social systems and SESs. However, according to Klien et al. (2003), even though it is considered that resilience has ability to explain sustainability to reduce vulnerability but the clear guidance of it is still lacking or poorly defined for policy and management. Moreover, it is not appropriate to presume that more resilience cities or megacities are less vulnerable after climate change related natural hazards. Additionally Cannon and Müller-Mahn (2010) emphasized on using vulnerability; a socio-economic approach rather than resilience; a social-ecological system. The notion of 'adaptive governance' in the development context works effectively when there is a power relation among different actors on different levels. The resilience approach cannot explain the power relations and also this approach assumes politics and economics a neutral factor in ecosystem management. However, to reduce vulnerability economic and political allocation of resources is needed and this is clearly defined in vulnerability approach. However, according to Adger (2006) the aims of vulnerability and resilience research are same and Gallopín (2006) argued that these are not merely opposite sides of the same coin.
2.2 The Approaches of Vulnerability Studies
Füssel (2007) have illustrated some classical approaches to vulnerability research along with others on the basis of vulnerability factors. Among them three major approaches are important in vulnerability research to climate change (Hjerpe and Wilk, 2010). The three major approaches will be shortly reviewed below.
6
2.2.1 Risk-hazard Approach
This approach is extensively used by engineers and economists to measure the particular type and magnitude of exposure units to hazards. As it is concerned with the internal biophysical vulnerability factors therefore sometimes it is difficult to apply where the behavior of exposure primarily determined by socioeconomic factors (Füssel, 2007). The term „sensitivity‟ or how considerably climate change will impact society and nature is also applicable to this approach, because risk is the product of probability and consequence (Füssel, 2007; Hjerpe and Wilk, 2010).
2.2.2 Political Economy Approach
The second major approach is political economy approach or also known as the social
constructivist framework has been originated from political economy and human geography
(Füssel and Klein, 2006). The vulnerability of individuals, households or community depends on their availability of resources or adaptive capacity to the changes. Therefore the socio-economic and political or non-climatic factors are the main determinants of vulnerability (Adger and Kelly, 1999; Füssel, 2007; Füssel and Klein, 2006).
2.2.3 Integrated Approach
This approach is the combination and extended version of above mentioned two classical approaches but the root of this integrated approach to vulnerability studies in „geography as human ecology‟ (Füssel, 2007). The integrated definition of vulnerability is well-known and widely accepted in global environmental change and climate change research arena (Füssel, 2007; Hjerpe and Wilk, 2010). Since, this approach is able to evaluate biophysical and social stressor collectively in a „double exposure‟ project (Füssel, 2007).
The current operational definition of integrated vulnerability is given by Intergovernmental Panel on Climate Change (IPCC) in its third assessment report and states that vulnerability is:
“The degree to which a system is susceptible to, and unable to cope with, adverse effects of climate change, including climate variability and extremes. Vulnerability is a function of the character, magnitude, and rate of climate change and variation to which a system is exposed, its sensitivity, and its adaptive
capacity” (IPCC; 2007, p.22; Parry et al, 2007, p.27).
Hence integrated vulnerability assessment of a system needs to examine its exposure, sensitivity and adaptive capacity.
2.2.3.1 Exposure
Exposure is defined as “the nature and degree to which a system is exposed to significant
climatic variations” (IPCC, 2001). The exposure of a system is closely related to the variation of
different climatic factors (temperature, precipitation etc.) as well as global climate change and also the system‟s location (Füssel and Klein, 2006). According to Brooks (2003), vulnerability of a country is the percentage of exposed population of a certain hazard affected area to its first-order impacts and number of exposures depends on several social and environmental factors.
7
2.2.3.2 Sensitivity
Sensitivity is “the degree to which a system is affected, either adversely or beneficially, by
climate variability or climate change” (IPCC, 2001). Sensitivity of a system is determined by
several non-climatic factors along with climatic activity like its exposure. If the exposure of a system will be changed to a hazard then the sensitivity will also be changed; either positively or negatively (Füssel and Klein, 2006).
2.2.3.3 Adaptive capacity
“Adaptive capacity is the whole of capabilities, resources and institutions of a country or region to implement effective adaptation measures” (IPCC, 2007). Exposure and sensitivity are very
difficult to separate from a system (Hjerpe and Wilk, 2010; Smit and Wandel, 2006) but adaptive capacity of a system could be increased by governing exposure and sensitivity to reduce vulnerability (Yohe and Tol, 2002; Adger et al., 2007). Adaptive capacity is the desirable unique and positive feature of a system accepted in vulnerability research as it is influenced by both biophysical and social factors of a system (Eakin and Luers, 2006; Engle, 2011).
2.3 Urban Vulnerability to Climate Change
The concept of „urban vulnerability‟ to climate change is yet far beyond to be realized because of different results by the rationalization of various scholars in order to deal with the full concept of existing frameworks (Romero-Lankao and Qin, 2011). However there are lot of studies on vulnerability to climate change but very little contemplation has been prearranged to the vulnerability of urban populations to climate change (Birkmann et al., 2010; Romero-Lankao and Qin, 2011) and International Commission on Climate Change and Development concludes:
“Cities and city dwellers have received too little attention in discussions of climate change impacts and adaptation” (Commission on Climate Change and Development 2009, p. 98).
Though, according to Satterthwaite et al. (2007) in many cases, it was observed that people‟s vulnerability to environmental hazards was decreased rather than increased because of urbanization. Yet the underlying associations between urban growth and climate variability still not clearly understood but cities might be unable to address the adverse consequence of climate vulnerability due to rapid urbanization. Uncontrolled and unplanned urban development is redirecting to expose large number of people to adverse impact of climate change (Revi, 2008) and this process is exaggerating the vulnerabilities to climate change (Fünfgeld, 2010). On the other hand climate change itself will be a vital reason of mobility and migration (McLeman, 2010) and the number of these „climate refugees‟ to the urban center might be 200 to 250 million by the year of 2050 and most of them will originate from Africa and Asia (Fünfgeld, 2010). In „urban society age‟ (Zhao et al., 2010) most of the developing countries are experiencing rapid urbanization (Opschoor, 2011). The annual urban growth rate in the least developed countries (LDCs) is predicted to be at 4.10% within the period of 2005 to 2010 which is much higher than the global average on 1.98% (UN/DESA, 2008). The urban poor people, who are significantly exposed to climate change related hazards of these countries is considered the proliferation factor of „urban vulnerability‟ (Laukkonen et al., 2009; Moser & Stein, 2011) and also according to UN–Habitat (2007) the global morbidity because of climate related disasters are high in these
8
urban areas. Although vulnerability to climate change are not similar to all social groups (Bengtsson et al., 2007) but the relationships between poverty and vulnerability are very complex (Laukkonen et al., 2009). Rapid urbanization forms the urban areas more densely and people are mixing with different socio-economic groups which increasing the vulnerability of all urban societies (Coutts et al., 2007; Revi, 2008). Efficient measures would incorporate the large populations in urban adaptation practices (Birkmann et al., 2010) but the developing countries could not make it possible because of the failure of both „development‟ and „governance‟ (Satterthwaite et al., 2007; Parnell et al., 2007; Wilbanks et al., 2007).
2.4 Urban Climate Governance
Governance is a vital component for ensuring successful mitigation and adaption actions in the local level. All of the climate actions are considered by the international and national representatives but cities in developed as well as developing countries are experiencing absence of methodological supports to make it practical (Anguelovski and Carmin, 2011). At the same time cities are the hubs of all kind of political and economic power, decision making, innovation and knowledge and have an interconnection among these dimensions which can play a significant role in socio-economic development (Birkmann et al., 2010). To analyze the interconnections and the impacts of it on local level there is no satisfactory number of researches (Alber and Kern, 2008). Cities are just acting to perform adaptation by vulnerability assessment because even there is research but yet not there is specific guideline on adaptation at the local level (Birkmann et al., 2010; Rosenzweig and Solecki, 2010). Additionally, the urban or local adaptation strategies are different from the national action plan which confirms the necessities of governance at local level. In this contrast, national governments are taking initiatives to formulate urban climate governance to accelerate the adaptation efforts to climate change at local level (Birkmann et al., 2010; Corfee-Morlot et al., 2011).
Anguelovski and Carmin (2011) defined the term „Urban climate governance‟ as “the ways in
which public, private, and civil society actors and institutions articulate climate goals, exercise influence and authority, and manage urban climate planning and implementation processes”. To
elaborate the concept „urban climate governance‟ Birkmann et al. (2010) evolved two different terms; urban planning and risk governance. In the first idea, governance is totally counter-concept to government where different actors can develop an urban plan through their mutual coordination and cooperation. Secondly, in the discourse of risk governance, a decision is taken by the all actors after analysis the available information on the basis of risk relevant rules, process and mechanisms. In this context „governance‟ for urban climate change adaptation has been developed gradually to address the failure of governments in urban development considering both formal and informal domains.
A successful climate action plan is possible because of existing an urban climate governance where all actors are supposed to investigate new paths (Evans, 2011) and the physical structure of this governance have to ensure the involvement of all relevant stakeholders for the desired planning (Birkmann et al., 2010). To portray the formations of urban climate governance Alber and Kern (2008), Betsill and Bulkeley (2006), Corfee-Morlot et al. (2011) and Fünfgeld (2010) stated multi-level systems and the arrangements of this multi-level system encompass the
9
combination of both vertical or hierarchical and horizontal or inclusive dimensions of governance. In the horizontal dimensions actors from different informal intuitions and authorities along with formal domains are engaged in the planning process which is the main argument to differentiate the term „governance‟ from „government‟ (Corfee-Morlot et al., 2011). When climate mitigation and adaptation measures are facing problems because of the spatial disparity among the local authorities and the harmful competition in the development context (Alber and Kern, 2008), collaboration in the horizontal dimensions in multilevel system manipulate these authorities to work across organization boundaries (Corfee-Morlot et al., 2011). On the other hand vertical collaboration in multi-level governance system is also an important factor for practical climate change adaptation and mitigation. In most countries, climate action policies for local governments derived from the national authority which is irrelevant for local climate policy (Alber and Kern, 2008). In such cases, the two-way communication is inevitably needed to transfer the information and knowledge to formulate the national policy based on local experience (Corfee-Morlot et al., 2011).
2.4.1 Stakeholders and Local Authorities
The success of urban climate governance depends on the participation at local scale and it is a fundamental criterion (Anguelovski and Carmin, 2011). Due to the lack of an appropriate climate governance framework (Fünfgeld, 2010), the local governments are yet not capable to engage the different stakeholders in this process (Anguelovski and Carmin, 2011). The International Council for Local Environmental Initiatives (ICLEI) is one of the largest and milestone networks where local governments and stakeholders participated to develop climate action plan through information sharing (Anguelovski and Carmin, 2011; Betsill and Bulkeley, 2006 and Corfee-Morlot et al., 2011). However, in one side, a few public representatives engaged with this programme but in another aspect, most of the participants were irrelevant to this programme because of their inadequate knowledge on climate change and the complexity of this process (Anguelovski and Carmin, 2011). In order to identify potential stakeholders in urban risk management White (2004) defines urban stakeholder as “Potentially, any inhabitant of a city,
anyone commuting to work in the city and any visitor is a stakeholder in the management of the risks to which that city is exposed”. Although, the situation might vary from country to country
due to various social, economical and political factors but this should be common in all places under climate change scenario. Alternatively, targeting poor and most vulnerable populations in the low and middle income countries would be a suitable approach to form climate action committees (Anguelovski and Carmin, 2011) as well as to develop adaptation plan, because the key stakeholders have better information on the climate variability that can be more beneficial to climate specialists (Mukheibir and Ziervogel, 2007).
Involvement of stakeholders at local level from several dimensions ensures the extent of commitment in climate change action plan (Laukkonen et al., 2009). Apart from involving the poor and most vulnerable stakeholders, it is also essential to involve the politicians and decision makers to ensure the capital support as sometimes the policy might be unpopular to the politicians (Mukheibir and Ziervogel, 2007). However, according to Næss et al. (2006) identification of potential stakeholders in climate vulnerability assessment in urban areas is still a challenge to overcome the knowledge exchange between researchers and stakeholders. Additionally, vulnerability assessment is a process rather than a product where different types of
10
information are needed from stakeholders to produce various types of inputs in the vulnerability assessment for the local context.
2.5 Linking Climate Adaptation and Sustainable Development
Adaptation has recently been used in the climate change research to address the unavoidable impacts because of climate change (Klein, 2003; Klein et al., 2005). In order to have better understanding of adaptive capacity in vulnerability studies this term has been proliferated (Engle, 2011). In another sense, adaptation is the way to address the negative impacts of climate change, as well as a preventive measure to avoid the consequence of increased green house gases rather than limit the sources of gases (known as „mitigation‟) (Schipper, 2007). Additionally, there is a close relation between mitigation and adaptation (Mitchell and Tanner, 2006); particularly, in the developing countries where adaptation supports the most vulnerable societies from the adverse impacts of climate change as a complimentary response to mitigation (Schipper, 2007).
The origin of the term „adaptation‟ is considered from the evolutionary biology used by Charles Darwin to elaborate the concept of biological adaptation (Engle, 2011; Schipper, 2007). However, this term later used by various numbers of disciplines to define adaptation in their own research field but there is no significant initiatives in the climate change discourse (Klein et al., 2005; Schipper, 2007). According to IPCC (2007), adaptation in climate change research can be defined as below:
“Adaptation is the adjustment in natural or human systems in response to actual
or expected climatic stimuli or their effects, which moderates harm or exploits beneficial opportunities” (IPCC, 2007)
This definition represents adaptation as a planned process which is controlled by an authority (Cannon and Müller-Mahn, 2010). In addition, according to Schipper (2007), policymakers are also interested in planned adaptation; adjusting the entire human system in a sustainable and a long term way rather than the impacted sectors only. Thus, sustainable adaptation is creating an enabling condition that can ensure no negative impacts due to climate change in the social system. Therefore, adaption is not the process to reduce the vulnerability but it can be achieved through „climate proof‟ development practices that reduce vulnerability.
The relation between adaptation and development is still unclear in the climate change debate (Cannon and Müller-Mahn, 2010; Schipper, 2007; Tanner and Mitchell 2008). There is a contradiction in putting the adaptation a higher priority by deforming the ongoing development practices aims to reduce vulnerability (Cannon and Müller-Mahn, 2010). However, Klein et al. (2005) indicate that adaptation is not a new activity rather focusing to the reduction of vulnerability through the development practices. According to this discussion Schipper (2007) identified two possible approaches to interlink adaptation and development (Box 1).
11
Box 1. Different Approaches to Linking Adaptation and Development (Schipper, 2007)
Adaptation Approach
Adaptation to Climate Change Impacts Vulnerability Reduction Development
In this view, adaptation is carried out in response to the observed and experienced impacts of climate change on society (including ecosystems). These responses ensure that the vulnerability to the impacts is reduced. This in turn ensures that less is lost each time a climate-related hazard takes place, which means risk is reduced. With reduced risk, development can be more sustainable.
Vulnerability Reduction Approach
Development Vulnerability Reduction Impact Reduction Adaptation
In this view, development processes help reduce vulnerability to climate change. By reducing the vulnerability, impacts of climate hazards are also reduced, as there is less sensitivity and exposure to the hazards. This translates into a process of adaptation to climate change.
In development policy point of view, this adaptation approach is only about the consideration of climate change in all kind of development planning; and can be defined by the term „mainstreaming‟ (Klein et al., 2005; Schipper, 2007). On the contrary, mainstreaming approach causes many challenges in development theory and practice (Cannon and Müller-Mahn, 2010) which needs more research, particularly for developing countries to be more effective (Klein et al., 2005). Moreover, this approach is an outcome rather than a process which does not consider the uncertainties of climate change that might also be a limitation for development (Schipper, 2007). On the other hand, according to Schipper (2007), vulnerability reduction approach emphasis on adequate development rather than explicit consideration of climate change. As the development in a society ensures the capacity to deal with the repeated extreme weather events thus determination of vulnerability after the development will eventually establish the sustainable development. Also, this adaptation is not the alternative path of sustainable development but it will guide to develop environmental, social and economical dimension in view of the global climate change.
12
3 METHODS AND MATERIALS
This empirical research is based on the case study of Kota city in Rajasthan state of India. This thesis intends to assess the vulnerability to climate change of this experimental city with analyzing the parameters of vulnerability separately. It also attempts to recommend an institutional structure with integrating different stakeholders. This institutional structure might be a milieu to have a climate change adaption planning for sustainable development of this city. In order to reach the expected outcome this research followed the below mentioned steps.
3.1 Selection of Experimental City
This study has been carried out along with the project „Designing Climate-Smart Water
Adaptation Strategies for Sustainable Urban Development: A Study of Cochahamba and Kota‟ at
Centre for Climate Science and Policy Research (CSPR). As a partial work of this project Kota has been selected for this study.
3.1.1 Kota City Profile 3.1.1.1 Geographical Location
Kota is located in the Hadoti region (Gupta et al., 2011b); in the South-East part of Rajasthan state along the eastern bank of Chambal River (UIT, 2011). The cartographic coordinates of this city are 25o11‟ North latitude and 75o51‟ East longitude (Gupta et al., 2011a). The total area of this city is 238.59 km2 with 253.30m average elevation from sea level (Gupta et al., 2011b). It covers 3.63 percent of Rajasthan and is the third largest city of this state (UIT, 2011). Kota is the regional headquarter of southern Rajasthan. This city has good communication linkages with other parts of this state as well as the country (NCRPB, 2008).
3.1.1.2 Climatic Properties
The climate of Kota varies from semi-arid to arid. It has intensely hot summer and short mild winter. The lowest temperature is 7oC in January and the highest is 48oC in May. This area experiences very low rainfall and the annual average precipitation is approx 700 mm (Gupta et al., 2011b). Humidity of this area ranges from 8-88% over the year. Dust storms occur during the summer period and the wind velocity varies from 2 to 22 Km/hour (Gupta et al., 2011a).
3.1.1.3 Demographics
In the year of 2001, according to the census, the total population was 1568525 and according to a survey it was 1836021 in the year of 2008 (Gupta et al., 2011b). The annual in-migration to Kota city from other rural and urban areas is 107511 and the total out migration to Delhi is 2202 persons (NCRPB, 2008).
13
3.1.2 Slum as ‘a case in the case’
However, the original project is focusing on the whole Kota city but slum areas have been selected for this study in vulnerability assessment to climate change. According to Berg (2009), case study approach can be used to evaluate the whole scenario by investigating a single phenomenon, individual, community or institution. The output of this empirical study would be used in the original project to achieve of its goal for whole Kota city.
3.2 Data Collection
Data collection for this research followed multiple techniques. According to Berg (2009), following triangulation in data collection techniques confirms to investigate a single concept or construct very well. Additionally, at least three methods in data-collection helps researcher to interpret the collected data and to ensure the validation of findings. This empirical study also followed three different ways in data collection and these are briefly described below.
3.2.1 Stakeholder Meeting
A stakeholder meeting was organized by Center for Climate Science and Policy Research (CSPR) and Department of Chemistry, University of Kota, Kota on February 14, 2012 at Vice Chancellor‟s Secretariat, University of Kota, Kota. The subject of that meeting was „Designing
14
Climate Smart Water Adaptation Strategies for Kota City: Challenges and Chances‟. In that interface meeting, there were 18 (eighteen) participants from different government and non government organizations, education and research institutes.
A range of information was collected in the following steps:
An exercise on „Challenges and Chances‟ with the multi-departmental group of participants to identify the major challenges that Kota is experiencing because of climate change and development related. The available chances to address the challenges for sustainable development.
A brief discussion to identify potential stakeholders those should be considered in the future development planning.
A discussion on the ongoing development projects and the necessities to modify of available policies and planning.
3.2.2 Web Search
To get vast information and deeper knowledge on the challenges which were identified during stakeholder meeting, a robust internet searching was conducted. The web-based research allows the researchers to be more efficient in psychological assessments compare to traditional actions (Denissen et al., 2010). Moreover, according to Bar-Ilan and Peritz (2002), data collection from Web is becoming is far from trivial and particularly search engines are more than perfect than any other tools are available on the web.
In the case of this study, search engine „Google‟ (https://www.google.com/) was used for data collection on the identified challenges at stakeholder meeting. To elaborate the applicability of „Google‟ search engine in web based research, Bar-Ilan and Peritz (2002) argued that, no other search engine can provide as many URLs or links of different WebPages and sites as Google can perform to a given keyword. Alternative keywords for every challenge were used to collect data from the web as many as possible. A list of the empirical materials is attached in Appendix 1 those were found and used in this study. The „keywords‟ for every challenge are mentioned in Table 1 that were used during web searching.
Table 1: Keywords were used in web search
Challenges Keywords
Groundwater depletion Groundwater, Groundwater depletion, Groundwater level, Drought
in Kota, India Sanitation and sewage Sanitation, Sanitation problem, water
supply, sewage, sewage problem, open defecation
Solid waste Solid waste, solid waste management Flash flood Flood, flash flood, drainage, Kota
diversion channel
Pollution (water) Water pollution, water contamination Heat wave Heat wave, extreme weather
15
3.2.3 Data from Questionnaire Survey by Urban Local Body (ULB)
The research focused on the vulnerability assessment of a targeted group from Kota city and this was slum people. Data was collected from a questionnaire survey by Urban Improvement Trust (UIT), Kota on the slum people. Questionnaire survey is very popular and maximum used method for data collection in research particularly to get individuals knowledge, attitude or other basic information (Boynton and Greenhalgh, 2004).
A questionnaire (see Appendix 2) was developed by the responsible authority for a government scheme named „Rajiv Awas Yojana (RAY)‟ to create a „slum free India‟ under the Ministry of Housing & Urban Poverty Alleviation, India. A socio-economic survey was conducted by UIT among the 37,321 households in 45 slums of Kota with the questionnaire. For this study seven slums data were considered.
3.3 Data Analysis
Analyses of the collected data for this study followed „mixed methods‟ to reach the aim with answering its research questions. According to Johnson and Onwuegbuzie (2004), mixed methods or combination of qualitative and quantitative methods offers the researchers the most informative, complete, balanced, and useful research results and philosophically, this is the third research paradigm which is logical and practical alternative than any movement of past.
All of the collected data were analyzed into three steps. It was already accepted to assess the vulnerability in an integrated approach which emphasis to examine exposure, sensitivity and adaptive capacity of a system. A flowchart of the total process of data analysis is illustrated in Figure 2.
Several challenges were identified during the stakeholders meeting and these were discussed with the help of empirical materials collected from the web search. In addition, data from the slum survey with a questionnaire were also considered to have in depth analysis focusing slum areas. A qualitative method was used to analyze the challenges where the slum people are exposed.
In the next step, households‟ data of the slum people from the questionnaire survey were considered to assess the person‟s vulnerability. For this assessment both qualitative and quantitative analysis were used. This analysis was conducted to have estimation on the intensity of impact due to climate hazards which also indicates the sensitivity of vulnerability assessment. Finally, a qualitative analysis was conducted to measure the adaptive capacity of the slum population. In this case, a dataset by the combination from stakeholders meeting, web search and the output of previous two analyses were considered.
16 Stakeholder
Meeting
Web Search Questionnaire Survey
Data Sources
Ch. 5 Ch. 4 Ch. 6 & Ch. 7.2 Assessment of Vulnerability Qualitative Qualitative Quantitative Qualitative Exposure Sensitivity Adaptive Capacity17
3.4 Limitations of the Study
To carry out the research work there had some difficulties in collecting data. These problems have been considered as limitations of the study. Most of the data were collected from internet and the author had to rely only on English document. There were significant numbers of relevant documents on the government websites. The author had limited access to this resource as many of them were in Hindi language those are giving more emphasis to the local authorities. Additionally, online database is not strong enough; particularly those types of materials are focusing only on Kota. This study also relied on the data from Urban Improvement Trust (UIT), Kota through a questionnaire survey. This questionnaire was developed for another kind of research. In spite of realizing the necessities of more information, the author had to rely on available data rather than conduct a survey due to lack of sufficient time and financial support. Although, there are some limitations, this empirical study also has its strengths as well. The use of triangulation methods in data collection minimized any kind of partial results. Also, both qualitative and quantitative methods in data analyses have pledged the quality of its results.
18
4 RESULTS & DISCUSSION: EXPOSURE OF KOTA
CITY
In this chapter readers will find a broad representation on the nature and degree to which Kota city is exposed because of climate change. This study considers several challenges of Kota city as its area of exposure. There is also a deep insight of these challenges as well as the exposures for the slum areas of Kota city.
4.1 Identification of Challenges
India is one of the more vulnerable and risk-prone countries in the world. The coping capacity of its people that have learned over centuries is decreasing due to recurring climatic hazards. As a result the people are becoming more vulnerable with differing place and socioeconomic status. In case of India‟s urban centres, particularly, the urban poor communities are becoming more vulnerable with having limited access to the basic demands for their living (Revi, 2008). The vulnerability of Indian cities is coupled with exposure to risks (Sharma and Tomar, 2010) where people are becoming more vulnerable with changing landscape, altering livelihood opportunities and wealth distribution (Revi, 2008). The impact of climate change will make the Indian cities more vulnerable along with its population growth. The cities are already struggling with limited access to water, sewerage systems, drainage and solid waste management facilities which will become severe by the year of 2060 when approximately 500 million additional people will live in 7,000-12,000 urban centres (Sharma and Tomar, 2010).
In case of Rajasthan the sustainable economic growth is a crucial challenge. Among the major environmental challenges, to ensure increasing water demand has been placed at the top. The growing number of population in the cities in Rajasthan is becoming unable to meet the water demand as most of the cities have already faced various level of water shortage. The uses of groundwater for domestic and industrial purposes have been exceeded the recharge levels. Moreover, surface water sources as well as groundwater are polluted by the effluents from domestic, agriculture and industrial practices (DoE, 2010). Furthermore, in cities of Rajasthan state, environmental quality degradation is the consequence of the relative neglect to the sanitation. The authorities have given more emphasis to water supply than to sanitation as a matter of priority. As a result, more than 80% diseases is the consequence of poor water quality and sanitation which proves the environmental degradation due to the overlooking attitude to sanitation (Gov of India, no date). On the other hand, there is a close relation between poverty and environment. The degradation of environmental quality engages the people to spend more money and time for gaining better livelihoods. The diseases because of inferior environmental quality are becoming burden to the urban poor people which is consequently reducing their income and becoming more vulnerable being in the vicious cycle of poverty (DoE, 2010). An interface meeting was organized on February 14, 2012 at University of Kota, Kota on the subject of “Designing climate smart water adaptation strategies for Kota city: Challenges and Chances”. When carrying out the exercise “Challenges and Chances” the multi-departmental
19
group of participants identified a range of major challenges for Kota city. These challenges are elaborated in the later section with the help of relevant documents available on the web.
Table 2: Challenges and their impacts of Kota city
Challenges Impacts
1. Groundwater Depletion 2. Sanitation and Sewage 3. Solid waste
4. Flash Floods 5. Pollution (water) 6. Heat wave
Increase the intensity of droughts
Shortage of drinking water
Reduction of agricultural output
Contamination of surface water
Water borne diseases
Increase mortality
Increase vector borne diseases (Malaria)
Heart diseases
Economic losses
4.1.1 Groundwater Depletion
The major water source in Rajasthan is groundwater. Almost 90% of drinking water comes from groundwater source. Over uses of groundwater are making it not reachable in the future. In the year of 2001, 840 m3 was the per capita water availability and in the year of 2050 it will be 439 m3, which is much lower than the national average (1,140 m3). In addition, the groundwater recharge in Rajasthan is very limited due to hard rock and deep aquifer. Inadequate and irregular rainfall with recurrence drought is leading to decline the groundwater levels across the state. This declination of groundwater level has been accelerated by the over extraction to its annual replenishment and it is also increasing over time. In the year of 1984 the annual groundwater extraction was 34% and it was much higher in the year of 2008 (138%) of its replenishment. Moreover, the projected climate change scenario by United Nations Framework Convention on Climate Change (UNFCCC) for the period of 2041-2060 indicates that the major rivers in Rajasthan (Kutch, Saurastra and Luni) will face acute water shortage which covers almost 60% water of the entire state. The gradual increase of temperature due to climate change also is a major fact to shortage through evapo-transpiration (DoE, 2010).
The average groundwater level depletion in Rajasthan was varied from 0.18m to 10.3m during the year of 1984-2003 and in the case of Kota it was 6.39m (Narain et al., 2005). Kota is in moderate category in the classification of districts for depletion of groundwater in Rajasthan where the groundwater level is depleting with 0.10-0.20m annually (SPRI, 2004). Installation of wells without reference to groundwater potential is a vital reason for rapid depletion of water level in Kota city. In the year of 1999-2000 the density of wells in Kota was 3,530/1,000 km2; whereas it was 2,717/1,000 km2 in the year of 1981-82 (Rathore, 2005). Additionally, Chambal River is only the source for agriculture and industrial uses but in the dry season groundwater is also used by these sectors and causes water level depletion rapidly. According to Composite Ranks Assigned to Districts for Water Resources, Kota is in the first position (have available groundwater) and is hoping to be remaining in the future (SPRI, 2004). In fact, the household connection of water supply covers only 22% in Kota city where some other towns have already covered 100% (Reddy, 2010). On the other hand, the water demand is increasing with the population growth and presently Kota is in the third position in using groundwater among the
20
districts of Rajasthan. Though the city has available space to groundwater recharge but it is very difficult due to the geological formation and requires huge investments and efforts for artificial recharge.
Hence, groundwater level depletion is one of the major concerns in the development of Kota city. The impact of climate change on water level depletion has been added with the excessive use of groundwater in this city. The decreasing trend of annual rainfall will directly impact on groundwater with changing its volume and recharge. As the groundwater is the major resource of this industrial city thus it is needed to give more attention for its economic development.
4.1.2 Sanitation and Sewage
The water demand in the urban areas of Rajasthan is increasing with the growing number of population. However, the cities have been covered with supply facilities but the urban dwellers are getting very less amount of water and the quality of water is still not assured (DoE, 2010). Almost 40% households do not have proper sanitation facilities (DoE, 2010) and it is leading to the decline of water qualities by disposing the untreated waste water to the water bodies. Among the cities in Rajasthan only Jaipur has proper management of waste water and few other cities have industrial waste water treatment plant (RPCB, 2007). The situation is becoming worse in the urban areas through establishing new colonies. In fact, population growth in slum areas and introduction of new slums are the main reasons. The drainage system in slum areas is very bad and open defecation is a common practice (Reddy, 2010). In Rajasthan, urban slums are becoming more vulnerable to climate change with the growing population and economy. Slums are already having problem with inadequate sanitation and collection of solid waste. Hence, more attention should be given to the slum area for addressing climate change in urban development (DoE, 2010).
In case of Kota, in the year of 2011 around 37.47% of city population lives in the slum area and the annual growth rate of the slum population is 11.28% (UIT, 2011). This figure is too higher than the entire states slums population (14.5%) (DoE, 2010). Moreover, about 80% of this slum population is living in a small to large size clusters on the bank of various water reservoirs. This circumstance makes difficult to provide water supply, sewerage, and drainage system due to gradient factor. On the other hand, around 70% people in the slum of Kota city is practicing open defecation which is also higher than the national slum profile (24%) (ADB, 2007). Even the slum people are willing to have sewerage connection and better latrine facilities but it is very expensive and difficult because of Kota‟s hard rock. In this situation, more attention should be given for adequate sanitation and sewerage facilities to the areas prone to open defecation to ensure better life standard and urban development (Gov of India, no date).
4.1.3 Solid Waste
The urban areas are facing serious problem related to sanitation and health status as there is no proper management of solid waste. However, municipality is responsible for the management of solid waste (RPCB, 2007) but this authority can collect less than 50% of total solid waste from only 35% of urban households. Even more than 80% cities in Rajasthan do not have suitable engineering to manage this waste. As a result the unsustainable administration of the solid waste is making the environment worse to live by causing serious health impacts (ADB, 2007).
21
The daily solid waste generation in the urban areas of Rajasthan is about 6600MT at the rate of more than 0.5kg per person (Gov of Rajasthan, 2011 and RPCB, 2007). In the case of Kota city the figure is always higher than the average of entire state. Total daily production of municipal solid waste in Kota city in the year of 2001 was 434TPD with the rate of 0.617kg/day per capita waste generation. And in the year of 2011, total daily solid waste generation was 653TPD with the 0.704kg/day per capita waste generation (Annepu, 2012). On the other hand, as the city does not have any proper mechanism to manage this waste thus it is usually dumped in a low depression or it is disposed to the river. The pollution of Chambal River which is the main source of water of this industrial city would be the cause of hindrance for economic development of this city (Gupta et al., 2011a). Additionally, open dumping of solid waste is one of the sources for emission of green house gases. There is no actual estimate of such emissions from this sector in the city or at state level (Gov of Rajasthan, 2011).
4.1.4 Flash Floods
Flash floods are common phenomenon in Rajasthan instead of having a large drought-prone area of this state. Over the last century this state is suffering from significant number of flash floods particularly in the eastern and western regions. Though, floods are considered a natural calamity but for Rajasthan state it is an opportunity to rejuvenate the depleted groundwater level though managing the excessive flood water. By enhancing artificial recharge around 354.16 MCM of flood water can be stored in 10 years according to the present frequency of floods (Narain et al., 2005).
The poor drainage system in urban centres of Rajasthan causes the flash floods even in a small amount of rainfall. However, the urban population is increasing over time and the situation is becoming worse but the development in this sector is yet completely neglected (RPCB, 2007). In Kota, the problem with flash floods has been eliminated from the year of 2007 after constructing the diversion channel (ADB, 2011). On the contrary, because of climate change floods in the north-western region of India are expected to increase in many river basins in spite of existing upstream dams and „multi-purpose‟ projects (Revi, 2008). According to Gov of Rajasthan (2011), to avoid the adverse effect of flash floods from extreme rainfall due to climate change, it is urgently needs to take necessary actions particularly to save flood prone areas of Kota districts, such as Kota city, Kathun, Khajuri and Sangod.
4.1.5 Pollution (water)
Pollution control is one of the major challenges in Rajasthan. The geometric growth of industries with the pace of urbanization causes the pollution and unable to control with present laws and regulations (DoE, 2010). Water pollution in cities from developing countries is closely associated with untreated disposal of waste and industrial effluents to the water bodies (Gov of India, no date). In Rajasthan sewage water and industrial effluents are also the two major sources of water pollution. In the first case, no other city has sewage management system except Jaipur and water pollution from industrial effluents Kota is in the first position (Gov of Rajasthan, 2011).
Chambal is one of two major rivers in Rajasthan which is not having problem with significant water pollution as there have not been developed industries in the bank of these rivers except in the Kota city (DoE, 2010 and RPCB, 2007). However, the presence of several organic and
22
inorganic elements in Chambal River at significant level indicates high level of contamination around the Kota city. The absence of proper industrial effluent treatment and poor sewage system are the main reasons of water pollution in Chambal River. Though, there are two operating sewage treatment plant at Dhakadkhedi & Balita Village but there still needs more to keep the water clean (Gupta et al., 2011a). According to Gangawala (2011), Kota city‟s water reservoirs are becoming polluted from the pollutant of some specific areas. The main water source of this city; Chambal River is the most affected water body at present. The reason behind this situation is the areas with alarming situation which are located along the Right Main Canal and eastern bank of Chambal and drained by several nallahs. Most of these areas are slums and newly developed settlements where do not have proper sewage and sanitation facilities. Along with these settlements, also there have some small scale industries and contaminants from those sources directly pollute Chambal River draining through the nallahs.
4.1.6 Heat Wave
The relation between mortality rate and the impacts of climate change or variability is one of the major concerns in India. The decrease of rainfall and the increase of temperature in the mountain areas have the consequence of occurring heat waves and causes massive death in India. Summer monsoon rainfall has decreased gradually by 57% since 1957 in Rajasthan area. Because of this climatic variability in Rajasthan area; heat waves and malaria outbreak do suggest the role of El Niño. The number of deaths also increased with increase of heat waves and malaria epidemics (Singh et al., 2010a).
The present mortality rate in Rajasthan will increase because of heart diseases due to increase in frequency and intensity of extreme temperatures and heat waves (DoE, 2010; Gov of Rajasthan, 2011). Table 3 shows the frequency and intensity of heat waves in Rajasthan with the number of lives claimed over the period of 1986 to 1995. Additionally, Rajasthan experienced maximum number in the loss of human lives and heat waves from the other most affected states like Uttar Pradesh, Bihar and Orissa during 1978-1999 (Singh et al., 2010a).
Table 3: The chronology of heat waves in Rajasthan from 1986-1995 (Bhargava and Bhatt, 2006)
Time Affected Areas Total Death
16-20 June 1986 Entire state 68
6-16 May 1988 Entire state 337
1-6 June 1988 Entire state 82
10-13 May 1989 Entire state 9
5 June 1989 Jodhpur 1
1-11 June 1991 Entire State 226
1-4 July 1991 Ajmer and Bharatpur 2
12-15 May 1992 Entire state 3
25-27 May 1992 Entire state 4
4 June 1992 Entire state 1
12-22 June 1992 Entire state 94
27 April 1993 Jaipur 3
23
2 May 1993 Alwar and Jaipur 2
3-8 May 1993 Rajasthan (some parts) 12
27 May 1993 Jaipur 1
1-12 June 1993 Entire state 23
17 May 1994 Jodhpur and Kota 3
20-30 May 1994 Entire state 99
1-6 June 1994 Bhiwara, Bikaner, Bundi, Churu, Dholpur, Dungapur, Jhalawar, Jodhpur, Kota, Pali and Udaipur
90
9 June 1994 Dholpur and Kota 17
7 May 1995 Banswara 1
10-18 May 1995 Entire state 32
28-30 May 1995 Entire state 4
5-7 June 1995 Entire state 9
9-10 June 1995 Entire state 4
12 June 1995 Bikaner 1
16 June 1995 Alwar and Jaipur 5
18-20 June 1995 Entire state 20
It is projected that the temperature will increase 3.8°C and the relative humidity will also increase 7% in Rajasthan by the year of 2050 with considering the base year 2000 (DoE, 2010). However, in the year of 2010 northern, western and central India faced an intense heat wave and reported 10 lives. Rajasthan was the hottest and most affected region in this time also. Most importantly, Kota experienced the highest temperature ever and baked at 48.4°C (Singh et al., 2010b and India Today, 2010).
4.2 Challenges of Slum Areas
The specific challenges identified in the slum areas from the questionnaire survey have been arranged in Table 4. It is also understandable that all the identified challenges are associated with infrastructure development. These challenges are making the slum people more vulnerable to climate change and natural hazards. According to Holand et al. (2011), the characteristics of built environment or infrastructure related issues are important to consider in vulnerability assessment. The several factors in Built Environment Vulnerability Index (BEVI) to assess the social vulnerability by Holand et al. (2011) were in developed county context. A similar group of factors are considered for this study to suit with developing country to draw a fact of social vulnerability of slum population in Kota city.
The challenges identified for the slum population are also major challenges of Kota city which is discussed in the previous section of this chapter. However, the extent of the challenges; illustrated in Table 4; is incorporating the severity around slum areas from the whole city. The slum people are getting partial services in water supply and drainage sectors than other city dwellers and in case of sewerage system they are almost totally isolated from the city network. The poor drainage system also causes the slums flood prone areas due to rain. The survey
24
Table 4: Specific Challenges Identified in the Slum Areas Slum
Name
Challenges
Water Supply Drainage Sewerage Flood Latrine Facility
(no. of households)
Solid Waste Management
Connectivity to City-wide water supply system Connectivity to City-wide storm-water drainage system Connectivity to City-wide sewerage system Flood prone due to rains Using latrine (public, shared, own) Open defecation Frequency of garbage disposal Arrangement for garbage disposal Frequency of clearance of open drains Adarsh Nagar Partially connected Partially
connected Not connected
Upto 15 days 518 47 Once in 15 days Municipal contractor No clearance Bapu Nagar Partially connected Partially
connected Not connected
Upto 15 days 1558 727 Once in a week Municipal contractor No clearance Brij Raj Colony Partially connected Partially
connected Not connected
Upto 15 days 123 70 Once in a week Municipal contractor Once in a week Dost Pura- A * Partially connected Partially connected More than a month 186 14 Once in a week Municipal staff No clearance Dost Pura- B Partially connected Partially
connected Not connected
Upto 15 days 189 19 Once in a week Municipal contractor No clearance Ganesh Pal Balapura Partially connected Partially
connected Not connected Not prone 46 34 Once in a week Municipal contractor Once in 15 days Hazira Basti * Partially connected Partially connected 15-30 days 195 53 Once in 15 days Residents themselves Once in 15 days
25
data also shows that duration of flood is minimum 15 days whether the slum is affected to flood. The long duration flood might make them more vulnerable with limited access to basic needs of living. On the other hand, yet one-third households are not using latrine for defecation completely and many of them using shared or public latrines. The duties of municipal contractor or staff are not also satisfied in solid waste management at the slum areas. However, they are collecting the garbage once in a week but they are not cleaning the open drains in many cases. In addition, Moser and Stein (2011) combined sewerage, drainage and garbage collection as „physical vulnerability‟ in the identification of types of vulnerability to describe health hazards. Finally, it can be said that the several identified challenges are highlighting the slum population are more vulnerable group in the Kota city. Moreover, according to Holand et al. (2011), the spatial variation of several factors in BEVI makes particular group of population more vulnerable in spite of living under a same municipality. A further downscale assessment is also needed to have a better understanding.