3
Abstract
This thesis was conducted at Enics manufacturing unit in Västerås. This site employs 360 people out of a total of 2400 globally. The site produces electronics and is specialised toward low volumes and spare parts.
The site has problems with high inventory levels, long lead times and less than preferred service level towards customers. This is the reason for the project which will investigate if it possible to implement a cell configuration with one piece flow for a part of the production process. The difficulties consist of the high variation in products and process flows which makes planning and grouping of products difficult.
To aid this project a Six Sigma methodology called DMAIC (Define-Measure-Analyse-Improve-Control) was used. Tools and principles from Lean manufacturing was also used and discussed. Data from the production has also been collected by the author.
As a start a suggested product family was presented by Enics. Process mapping was done for all products by using process maps, spaghetti diagrams and value stream mapping. The initial product family had to be dismissed and a new product family was chosen by analysing process flows and demand for all products. This second product family was then analysed in order to decide if a cell configuration was possible.
In the end the project concludes that a cell configuration with one piece flow is feasible and it is partly implemented. A number of layout suggestions are made for future development. A discussion regarding the problems the company are facing follows before the author concludes that the company should continue implementing the fundamental strategies from lean
manufacturing despite being a smaller company. Much of the principles are applicable and possible despite the high product variation and lack of resources in the company.
5
Abbreviations
EMS Electronics Manufacturing Service
CTQ Critical To Quality
DFSS Design For Six Sigma
DMADV Define Measure Analyse Design Verify DMAIC Define Measure Analyse Improve Control
DPMO Defects Per Million Opportunities
FIFO First In First Out
HVLV High Variety Low Volume
ICT In Circuit Test
IMVP International Motor Vehicle Program
IPC Association Connecting Electronics Industries, previously Institute for Printed Circuits
KPI Key Performance Indicator
MTO Make To Order
PCBA Printed Circuit Board Assembly
ROHS Reduction Of Hazardous Substances Directive
SIPOC Supplier Input Process Output Customer
SME Small to Medium sized Enterprises
SMED Single Minute Exchange of Die
SUF Single Unit Flow
TOC Theory Of Constraints
TPM Total Productive Maintenance
7
Table of Contents
Abbreviations ... 5 1 Introduction ... 9 1.1 Background ... 9 1.2 Company presentation ... 10 1.3 Problem discussion ... 12 1.4 Purpose ... 12 1.5 Delimitations ... 131.6 Outline of thesis – disposition ... 13
4 Methodology ... 15
4.1 Approach / research strategy ... 15
4.2 Research purpose ... 16
4.3 Inductive or deductive research ... 16
4.4 Data gathering ... 17
4.5 Qualitative or quantitative research ... 17
4.6 Reliability and validity ... 19
5 Theoretical framework ... 21
5.1 Lean ... 21
5.2 Principles ... 24
5.3 Six Sigma ... 25
5.4 Lean and Six Sigma ... 34
5.5 Lean, Six Sigma and SME ... 35
5.6 Critique ... 35 5.7 Manufacturing flexibility ... 37 5.8 Factory layout ... 38 5.9 Group technology ... 39 5.10 Group dynamics ... 40 6 Define ... 43 6.1 Process overview ... 43 6.2 Project charter ... 47 7 Measure ... 49 7.1 Products ... 49 7.2 Time registration ... 50
7.3 Data collection plan and data source analysis ... 51
7.4 Work in progress ... 51
7.5 Process maps ... 51
7.6 Value stream map ... 52
8
8.1 Spaghetti diagram and future process flowchart ... 53
8.2 Product selection ... 55
8.3 Team creation ... 56
8.4 Cell layout design suggestions ... 58
8.5 5S, TQC ... 60
8.6 SMED ... 60
8.7 Pull system ... 60
8.8 Poka Yoke ... 60
8.9 One piece flow ... 61
8.10 Visualization ... 61
8.11 Layout ... 61
8.12 KPI’s and process control ... 61
9 Discussion ... 63
10 Conclusions ... 67
11 Source references ... 69
9
1 Introduction
This chapter will give the reader an overview of what the entire thesis contains. The chapter consists of background, company presentation, problem discussion, purpose, delimitations and outline. After reading this chapter the reader should have an understanding of what the thesis is about and how it is conducted.
1.1 Background
Business management strategies has been around for a long time, at least from the beginning of the last century and much of what is referred to as tools are originally common sense employed in a scientifically way.
Six Sigma is a quality orientated improvement method originally derived by Motorola in 1981. More specifically it was an engineer called William Smith who is known as the father of Six Sigma, although many more have been working on the problems with reducing variability and improving quality1 (essentials of lean six sigma). Six Sigma focuses on identifying causes for defects and removing them, always with the customer in focus. The underlying assumption is that every process can be described with a statistical distribution curve which can be used to measure the variability and behavior of the process.
Lean manufacturing is another production practice that has been developed from the Toyota Production System in the 1960s which in turn has origins from the beginning of the 20th century. Lean manufacturing differs between value adding activities and waste, everything not considered to add value to the product is considered to be waste. Another viewpoint is that value added is everything the customer is prepared to pay for, all the rest is waste. Fundamental approaches in Lean is to remove or at least minimize all stocks such as inventories and finished goods, this forces everyone involved to do their best in order to avoid costly mistakes as they will incur complete stops in production. Since there is no room for errors all problems are laid bare and can be dealt with.
One approach in both Six Sigma and Lean is to reduce variability in processes, to increase flow and smoothness. Recently these two
manufacturing philosophies have been combined into Lean Six Sigma where tools from both Lean and Six Sigma are used together. This thesis will use tools from Lean Six Sigma in the empirical part of the study. A
1
10
deeper and more thorough presentation of these business management strategies can be found in chapter 5.
1.2 Company presentation
Enics is an EMS (Electronics Manufacturing Services) company focused towards the global industry and medical business with more than 40 years of experience in Industrial Electronics2. The total numbers of employees are in the range of 2400 and annual sales in 2009 reached €271 Million. There are 7 manufacturing plants in Asia and Europe with headquarters in Zürich, Switzerland. Two Enics’ plants are located in Sweden, one in Malmö and one in Västerås. Enics business unit in Västerås is housed in a building of approximately 9000 square meters and has 360 employees. Of these 260 are blue collar workers working daytime, 2 shifts and night shift production. The factory produces a wide range of PCBA products from prototyping to spare parts production and therefore the product mix is very high, ranging from low to medium volumes. Currently the factory is responsible for more than 4500 different products. This high variety requires a very flexible production system and a deep knowledge of electronics since many products are spare parts from past decades. The services offered by Enics include engineering services, manufacturing, life extension, after sales, supply chain management and customer relationship management. The manufacturing part in turn consists of board assembly (both ROHS and non ROHS), box build assembly, low volumes production and prototyping. Typical processes used for PCBAs is surface mount technology, primary and or secondary sided, automated or manual through hole technology with selective or wave soldering, testing on board level; either through in circuit testing or with flying probe testing. In some cases PCBAs are coated with conformal coating and usually PCBAs are high voltage tested for any shortages. Most PCBAs are then assembled in some kind of box build solution with
following testing such as burn in testing and functional testing before being packed and shipped to customers. The high amount of testing is usually a customer demand because of the type of products being manufactured at this site, the majority being some kind of safety or monitoring solution in
nuclear power plants, electrical grids, railway control systems or onboard train safety systems.
2
11
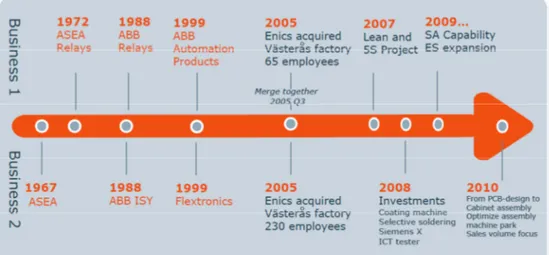
Figure 1 Enics Västerås history3
The production started in 2005 after two production units was acquired by Enics from ABB and Flextronics and merged in Q3 2005. The two different parts were founded in 1972 and 1967 respectively by ASEA. All of which are part of Enics idea to offer services over the whole life cycle, from developing and prototyping to maintenance and repair. The services offered in Västerås business unit cover the beginning and end of the life cycle management. The strategy is visualized in the following figure:
Figure 2 Enics life cycle strategy4
3
Enics company presentation, www.enics.com
4
12
1.3 Problem discussion
Manufacturing consisting of a very large product mix requires a very flexible production. Usually it is realised in a functional configuration with batch production; this is the case in the Enics business unit in Västerås. One difficult issue in high mix production is the need for is frequent changeover. Quite often this result in high inventories in the form of queues in between processes. One way of addressing this problem is with reduced changeover times and smaller batch sizes. In lean production the optimal way of producing is by using one piece flow, which is possible with mixed
production but much harder to do and possibly limited by high variation in the process flows. Some companies have approached the problem by starting a lean six sigma initiative to reduce quality problems and to create smoother manufacturing with less waste. This, however, is not easy in a smaller company with high product diversification and low to medium volumes, the framework was developed for and by companies with much larger production and fewer products. How a lean six sigma framework is applicable to smaller companies with higher product diversification will be discussed in chapter 5. Today Enics have problems in their production with high inventories, lots of work in process, long lead times and quality issues. In order to receive guidelines and assistance in dealing with these problems lean six sigma has been chosen and tools from this framework will be used within the company.
1.4 Purpose
A one piece flow cell would solve many of the problems with lead times, work in process, inventories and quality and has been chosen as the preferred solution, but implementing a one piece flow cell may not be possible because the high product diversification may cause long setup times, low utilization or lowered process efficiency. Also, there may not be enough products with similar routes. Therefore this projects task is to investigate how to choose products, design a work cell and implement the new work cell into the organization. If it is deemed impossible to create a one piece flow work cell the task will be to suggest alternative solutions to the problems at hand. The project will be finished off by suggesting further possible projects and improvement ideas. In order to structure the project the six sigma methodology DMAIC; Define, Measure, Analyse, Improve
13
and Control has been chosen, apart from this several lean tools will be used in the improvement. If time is available, an actual change of the production could be part of this project.
1.5 Delimitations
Certain delimitations has been done in agreement with the supervisor and Enics in order to match the extents of the work to the limited timeframe. Of the different phases the implementation and control phase will be done depending on available time. The processes included in the thesis start after surface mounting and end after surface coating; this means they include manual assembly, soldering, visual inspection, PCB depaneling, in-circuit testing (ICT), washing and conformal coating. Excluded processes are surface mounting, further testing and box build.
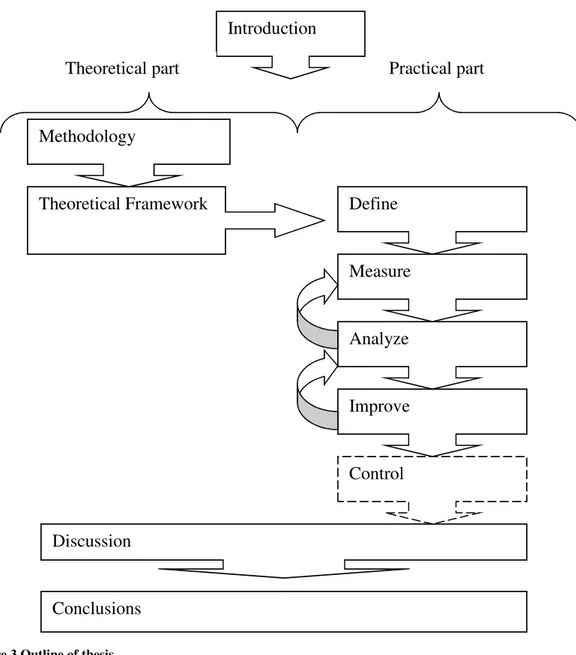
1.6 Outline of thesis – disposition
The thesis starts with an introduction to give the reader an overview of what the thesis contains. Here after the methodology is presented with a
discussion about research problems such as which approach to use and issues regarding this approach. In chapter 5 the theoretical framework is presented with some of the relevant theory. These first three chapters contain the theoretical part of the thesis, the following chapters contain the more empirical part with the DMAIC-method used in the project and each part has its own chapter. Following the empirical part is a chapter with conclusions and a discussion.
14 Introduction Methodology Define Theoretical Framework Measure Analyze Improve Control Discussion Conclusions
Theoretical part Practical part
15
4 Methodology
In this chapter the methodology used in this thesis will be described and different approaches and methods will be discussed. The general tools for the project will also be introduced.
4.1 Approach / research strategy
In Höst5 four different types of research approaches are discussed; case study, survey, experiment and action research.
A case study is meant to give an in depth description of a phenomenon, affecting what is described as little as possible. Common techniques used in a case study are interviews, observations and analysis of archives.
Surveys collect and present information in an effort to describe a phenomenon, information is gathered from a sample population and from the result of this information conclusions regarding the whole population are made. How to select the sample is an important question in this type of research and the data gathered can be analysed statistically.
Experiments are a way to find cause and effect for a phenomenon, experiments can also compare different applications. In an experiment factors are isolated and compared, and from these the conclusions can be made. Volunteers can be used in experiments but the selection of a sample of volunteers is important to avoid bias.
Action research is used when improvements are wanted at the same time as understanding and investigation. Action research according to Höst5 is done in consecutive steps starting with observations to identify the problem at hand. The next step is to analyse the observations and come up with solutions and the final step is to evaluate the solutions.
Another related approach used in quality improvement is presented in Bergman and Klefsjö6 called Shewart cycle and consists of the steps plan, do, study and learn. In this master thesis an experimental research approach called DMAIC from Six Sigma will be used consisting of the five steps Define, Measure, Analyse, Improve and Control. This choice is made
because the scope from Enics side is not just to describe or investigate but to actually change their production process and experimental research
methodology does just that. In combination with this experimental research
5
Höst et al. 2006
6
16
a literature study of the related theory is performed in order to provide a good theoretical foundation for conclusions and discussion later in the thesis.
4.2 Research purpose
Exploratory research is a type of research done when there is no predefined theory to start with; exploratory research is often very fundamental and often answers the question whether there is a problem to investigate further. Descriptive research is also known as statistical research as it uses averages and numbers to describe a phenomenon. It is however limited as it does not explain the causes behind the phenomenon despite being accurate in
numbers. Explanatory research looks for cause and effect as well as explanations to how something works or is performed while problem solving research has the purpose of solving a specific problem.7 These are some of the different purposes a research project can have. The purpose of this thesis is problem solving but all elements are present to some extent, descriptive elements will be found in the definition and measure phases and explanatory elements can be found in the analyse phase. Exploratory
elements could be found in the theoretical chapter since discussion
regarding small enterprises and lean manufacturing are rather uncommon.
4.3 Inductive or deductive research
Inductive or deductive approaches stem from two completely different philosophical branches, rationalism and empiricism. Rationalism claims that it is possible to come to a conclusion only from using reason and logic while empiricism claims that it is only possible to make a valid claim if it is built on experience and evidence. Therefore inductive research starts with gathering of evidence and observations; these are then analysed in order to find patterns to form hypotheses on. These hypotheses are turned into theory and results. Deductive research on the other hand starts with theory and hypotheses which are then examined with observations and evidence. In the end a hypothesis is confirmed or dismissed. This thesis is mainly deductive; it starts out with an idea of what might be possible then data is gathered to be analysed to confirm or dismiss this idea. If the original theory turns out not to be true an alternate theory is formed based on the data analysed and later tested. This iterative approach is mainly deductive but could be said to have inductive elements if an alternative hypothesis is found based on the
7
17
observations made. An iterative approach is supported in the DMAIC methodology both by returning to a previous step or by repeating the whole process once a solution is implemented in order to find further
improvements. The reason DMAIC has been chosen as the tool for this project is the straightforward methodology that goes well with experimental research and the fact that knowledge of this methodology exists within the company. Experimental research in turn fits the scope of the thesis; to come to a conclusion about and hopefully implement a solution to some of the problems within the production.
4.4 Data gathering
When gathering data it is important to reflect on what the data is supposed to measure and how to make sure the data is accurately describing the phenomenon. There are two main types of data collection methods, qualitative and quantitative. Data can also be of two types, primary and secondary, secondary data is data not directly related to the study while primary data is. An example of secondary data is literature. Primary data will be collected within Enics in the form of cycle times, work in process and setup time among other things while secondary data is used for the theoretical chapter.
4.5 Qualitative or quantitative research
Qualitative research is a method of inquiry used when an in-depth
understanding is needed; it is usually used in the social sciences. Qualitative data is non-numerical and explanation based. Other terms for qualitative research are naturalistic, humanistic and interpretative. Quantitative research on the other hand is systematic empirical investigation of phenomena that have quantitative properties. The data in quantitative research is numbers, mathematical models, expressions and graphs. Qualitative data can often be used in combination with quantitative data in order to verify that the
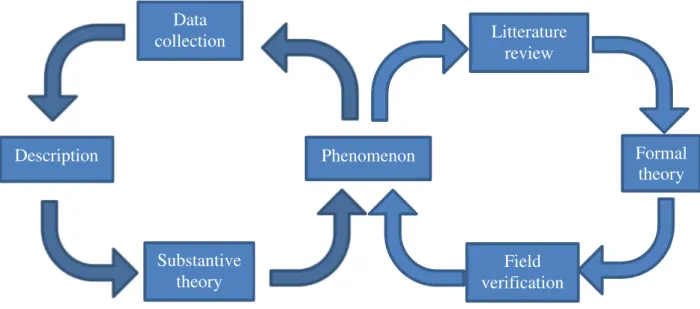
quantitative data is measuring what was intended to be measured. Quantitative research is often performed in three steps8; a first step
involving reviewing literature to develop a theoretical foundation on which the research will be based, a second step in which a formal theory is
developed and in the third step data is collected to verify or dismiss the previously developed theory, this is essentially a deductive research
approach. This thesis will mainly be quantitative as large amounts of data in numerical form will be collected during the production but it will also be qualitative in nature since investigation is also performed through interviews
8
18
with people in the production. It is important to combine methods of
research in order to reach a more balanced approach (Figure 4 Illustration of a balanced approach from Golicic et al.) and in order not to delimit the scope of the research.9
4.5.1 Data gathering in this project
There are multiple sources for data; there is a time registration system, internal standard times used for planning and quoting and also actual timing of production with a stopwatch. All of these different sources will be used depending on what will be measured; the reliability of the sources is continually evaluated to ensure validity. Apart from this data a literature review is performed and the sources were carefully chosen from article search engines such as ELIN (Electronic Library Information Navigator) from Lund University.
9
Golicic et al. 2005
Figure 4 Illustration of a balanced approach from Golicic et al. Phenomenon Litterature review Formal theory Field verification Data collection Description Substantive theory
19
4.6 Reliability and validity
The validity of research is how relevant the measured facts are for the research. In order to ensure validity there are a few things to consider. Firstly the data collection technique has to give us the information we are interested in, this can be verified by asking people with insight to check the face validity. Secondly the criterion validity has to be verified to ensure that the result matches that of similar measures. This is checked through
multiple different sources of data in this thesis. Thirdly, construct validity is whether related measures support our conclusions. Fourthly there is a
communicative validity which is the researcher’s ability to communicate the methodologies used and conclusions made. Lastly there is a pragmatic validity which is whether the knowledge is useful or not. Reliability of research is how reliable the information are, how accurate our measures are. In order to ensure reliability there are a few things to consider, one is
whether the measurements are free from bias or not. Another thing to consider is whether the measurements are time independent or not, measurements made at different points in time should not differ. Both validity and reliability is important and it is important to remember that a high reliability does not guarantee a high validity and a high validity requires a high reliability. The reliability and validity of clocked times is good since the data can be confirmed while the measuring is done. Clocked time is also statistically verified for reliability by checking variance and not just looking at mean values. Other sources of data such as time taken from the internal time collection system and time in the production system cannot be verified and therefore they cannot be used to make conclusions, however, they can be used in order to filter products for closer analysing such as grouping. This will be done in this thesis.
21
5 Theoretical framework
This chapter will lay the theoretical foundation for the practical part of the thesis; it will go through the principles of lean production and six sigma and the combination of the two. Six sigma and lean implementation in small to medium sized enterprises is also discussed and in the end some critique of these toolsets are brought up.
5.1 Lean
Many different names have been used to describe what is sometimes
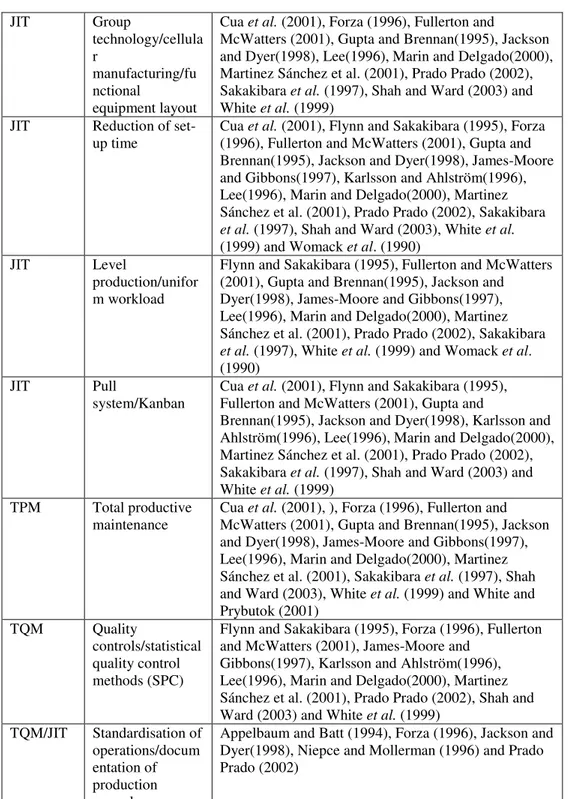
referred to as Lean Production; other examples are Just-In-Time and Toyota Production System. Depending on which author is read different definitions are found. In Bonavia & Marin 200610 several different opinions are found and agreement between three so called bundles are found; JIT, TQM and TPM and also support for a fourth bundle, human resource management, HRM. As to what tools these bundles in turn consist of there is also disagreement and different versions exist between different authors, an example of the different existing views can be seen in Table 1.
Bundle Practice Authors
HRM Multifunctional
employees/cross training/task rotation
Cua et al. (2001), Forza (1996), Fullerton and
McWatters (2001), Gupta and Brennan(1995), Jackson and Dyer(1998), James-Moore and Gibbons(1997), Karlsson and Ahlström(1996), Katayama and Bennet(1996), Lee(1996), Marin and Delgado(2000), Martinez Sánchez et al. (2001), Prado Prado (2002), Shah and Ward (2003), White et al. (1999) and Womack et al. (1990) HRM/TQ M Group suggestions programmes (quality circles,…)
Cua et al. (2001), Forza (1996), Fullerton and
McWatters (2001), Jackson and Dyer(1998), Karlsson and Ahlström(1996), Lee(1996), Marin and
Delgado(2000), Martinez Sánchez et al. (2001), Prado Prado (2002), Sakakibara et al. (1997), Shah and Ward (2003) and White et al. (1999)
HRM/TQ M/TPM Visual factory /information and feedback to employees/industr ial housekeeping
Cua et al. (2001), Jackson and Dyer(1998), Karlsson and Ahlström(1996) and Prado Prado (2002)
10
22 JIT Group technology/cellula r manufacturing/fu nctional equipment layout
Cua et al. (2001), Forza (1996), Fullerton and
McWatters (2001), Gupta and Brennan(1995), Jackson and Dyer(1998), Lee(1996), Marin and Delgado(2000), Martinez Sánchez et al. (2001), Prado Prado (2002), Sakakibara et al. (1997), Shah and Ward (2003) and White et al. (1999)
JIT Reduction of
set-up time
Cua et al. (2001), Flynn and Sakakibara (1995), Forza (1996), Fullerton and McWatters (2001), Gupta and Brennan(1995), Jackson and Dyer(1998), James-Moore and Gibbons(1997), Karlsson and Ahlström(1996), Lee(1996), Marin and Delgado(2000), Martinez Sánchez et al. (2001), Prado Prado (2002), Sakakibara et al. (1997), Shah and Ward (2003), White et al. (1999) and Womack et al. (1990)
JIT Level
production/unifor m workload
Flynn and Sakakibara (1995), Fullerton and McWatters (2001), Gupta and Brennan(1995), Jackson and Dyer(1998), James-Moore and Gibbons(1997), Lee(1996), Marin and Delgado(2000), Martinez Sánchez et al. (2001), Prado Prado (2002), Sakakibara et al. (1997), White et al. (1999) and Womack et al. (1990)
JIT Pull
system/Kanban
Cua et al. (2001), Flynn and Sakakibara (1995), Fullerton and McWatters (2001), Gupta and
Brennan(1995), Jackson and Dyer(1998), Karlsson and Ahlström(1996), Lee(1996), Marin and Delgado(2000), Martinez Sánchez et al. (2001), Prado Prado (2002), Sakakibara et al. (1997), Shah and Ward (2003) and White et al. (1999)
TPM Total productive
maintenance
Cua et al. (2001), ), Forza (1996), Fullerton and McWatters (2001), Gupta and Brennan(1995), Jackson and Dyer(1998), James-Moore and Gibbons(1997), Lee(1996), Marin and Delgado(2000), Martinez Sánchez et al. (2001), Sakakibara et al. (1997), Shah and Ward (2003), White et al. (1999) and White and Prybutok (2001)
TQM Quality
controls/statistical quality control methods (SPC)
Flynn and Sakakibara (1995), Forza (1996), Fullerton and McWatters (2001), James-Moore and
Gibbons(1997), Karlsson and Ahlström(1996), Lee(1996), Marin and Delgado(2000), Martinez Sánchez et al. (2001), Prado Prado (2002), Shah and Ward (2003) and White et al. (1999)
TQM/JIT Standardisation of
operations/docum entation of production procedures
Appelbaum and Batt (1994), Forza (1996), Jackson and Dyer(1998), Niepce and Mollerman (1996) and Prado Prado (2002)
Table 1 A compilation of authors’ different views of lean production.11
11
23
Regardless of exactly which so called bundle is chosen there is a long discussion in ‘The machine that changed the world’ regarding the findings of IMVP (International Motor Vehicle Program)12. What distinguishes Japanese auto manufacturers from the rest are not labelled as sets of tools in this book, instead the 20 year long process that the car manufacturers went through is described. Lean is not characterized best with a list of tools, it is best described by a process that has emerged over time and is very hard to implement over a short time period. Lean is more than a system; it is a philosophy and a culture that runs through an entire company. The listing of tools is an attempt to transfer techniques in a way which is easy to
understand and have its benefits but also limitations.
The different elements of lean production as described in13 are:
5.1.1 Factory design
Womack and Jones discusses the differences between large auto
manufacturers factory layouts, lean producers tend to have smaller factories, yet a higher productivity. Inventories are much smaller, measured on an hourly basis instead of daily. The reasons for higher productivity are
discussed and the findings according to Womack and Jones are that a certain level of automation is beneficial but one of the main reasons is
manufacturability. Other reasons are the multi skilled workers divided into teams as opposed to workers of low skill supported by specialists. The lack of space in the factory is a consequence of the lack of inventories cluttering the floor space and just in time supply of materials.
5.1.2 Product design
Lean product design and development is compared to mass production product design and development and the major differences are the roles and power given to the leader of the project. Also a lean product development starts with many people involved and also integrates all the different aspect of the company from the start in an attempt to reduce mistakes and later revisions.
5.1.3 Supply chain
The supply chain of a lean enterprise consists of fewer suppliers than traditionally and the suppliers are given more responsibilities such as product development and process development. The gains from optimizing the production over time are split between supplier and assembler and
12
Womack et al. 1990
13
24
information is shared openly. The relationship between assembler and suppliers are supposed to channel the effort of both parties toward mutually beneficial goals.
5.1.4 Worker environment in lean
Worker environment has been criticised in lean because there are opinions that lean methods pushes workers continually in a way that puts a lot of stress on the individual worker. Lean advocates will point out that workers in a lean environment has much higher possibilities to improve their work place and much more responsibilities, things that enables a more rewarding as well as challenging career.
5.2 Principles
5.2.1 Value
Creating value for the customer is the first step; this is the most important task for a company. Value is what the customer is prepared to pay for; this is the definition that should be used, to specify value correctly is crucial. Where the value is created is irrelevant, the creation is what matters.
5.2.2 Value flow
To identify where value is created is important, this can be done by dividing activities into value adding, non-value adding but necessary and non-value adding and unnecessary. A way of doing this is by setting up value stream maps for products; this will be done later in the practical part of the thesis.
5.2.3 Flow
To create a continuous flow through processes focused on the product is a goal in lean. In more traditional manufacturing batches are used and the majority of time is spent waiting in between processes, something that creates large inventories and other problems. In lean production the goal is to have one piece flow throughout the production.
5.2.4 Pull
In traditional manufacturing push productions is used, in lean production the preferred way is pull production. In pull production manufacturing is done on signals from downstream production when inventories are running low and in the end the signal comes from the customer itself. This leads to right products made at the right time and reduced waste from overproduction.
25
5.2.5 Perfection
The culture of a company is very important and in lean the goal is to create a mindset among co-workers to strive towards perfection, to never be satisfied and always try to improve. This is essential to maintain a competitive edge and not lag behind competition.
5.2.6 Muda
Lean production stipulates seven different types of wastes, all of which the goal is to eliminate (or at least reduce). This is a central part of lean
production.
Overproduction is considered the worst waste since it could create or hide more of the other wastes. Overproduction is simply producing more than what is required from customers or do earlier than needed.
Waiting is when products are not being moved or processed; it should not lead to overproduction, in batch production much time is spent waiting in queues.
Movement is unnecessary travelling of products, people or equipment. Inventory is materials, products or work in progress and binds capital; this incurs cost and is therefore waste.
Transportation does not add any value for the customer and is therefore considered waste. Transportation also exposes products for risk of being damaged or lost.
Over-processing is when more work is done than required by the customer and therefore not paid for. This can be better tolerances or more complex solutions than requested.
Defects, scrapped products or rework due to quality problems is waste.
5.3 Six Sigma
This section will present the Six Sigma framework, methods and theory since the practical improvement project that is part of this thesis is done using some Six Sigma tools. As Lean tools are used together with Six Sigma tools in the project they will be presented together in this part, there are more tools than will be presented in this thesis but restrictions has been done to increase readability and relevance, for the interested reader there is
extensive literature on the subject, see the references for further reading. Some discussion and critique regarding Six Sigma will also be presented as well as a discussion about the joining of Lean and Six Sigma.
26
“(Six Sigma is a) business process that allows companies to drastically
improve their bottom line by designing and monitoring everyday business activities in ways that minimize waste and resources while increasing customer satisfaction.”
-Mikael J. Harry14 Six Sigma was developed by Motorola in the 1980’s as a toolset to deal with quality conformance problems. The reason for the development was the purchase of a Motorola factory by a Japanese company in the 1970s which soon after the purchase was producing at 1/20th the error rate compared to Motorola; this obvious lack of quality on Motorola’s part caused the development of Six Sigma15. The name derives from the goal to reduce quality defects to the size region of six standard deviations, which translates to 3.4 defects per million produced products. Six Sigma relies heavily on the use of statistical methods to identify quality problems. Improvement
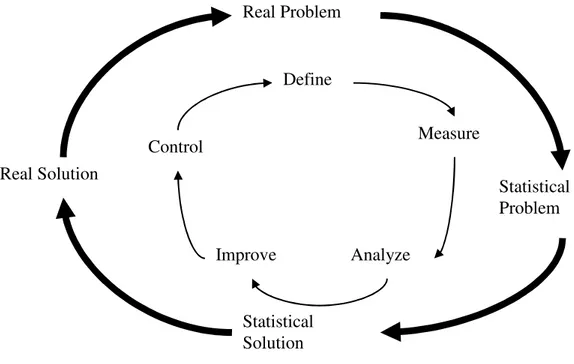
projects are often led by individuals trained in the methods and tools of Six Sigma, these people are referred to as Champion or Sponsor, Master Black Belts, Black Belts and Green Belts. The projects carried out are done in similar steps which are predefined and has predefined targets, there are two different types of projects, DMAIC for existing processes and DMADV (or DFSS) for new products or processes. As mentioned above DMAIC stands for Define, Measure, Analyse, Improve and Control while DMADV stands for Define, Measure, Analyse, Design and Verify. DFSS simply stands for Design For Six Sigma. This thesis will use the project form DMAIC for the practical improvement project. The mindset used when solving complex problems with DMAIC is illustrated in this figure, each phase of DMAIC has a number of tools.
14
Magnusson et al. 2003
15
27
Figure 5 The Six Sigma+Lean Toolset16
5.3.1 The Phases and tools in DMAIC
Commonly used tools in DMAIC projects as described in Six Sigma Handbook17, some of these will be described in more detail below. Project Phase Candidate Six Sigma Tools
Define Project charter Process map SIPOC
Benchmarking
Project planning and management tools Pareto analysis
Measure Measurement systems analysis Process behaviour charts (SPC) Exploratory data analysis Descriptive statistics Data mining Run charts 16 John et al. 2008 p.11 17 Pyzdek et al. 2009 Real Problem Real Solution Statistical Problem Statistical Solution Define Measure Analyze Improve Control
28 Pareto analysis
Analyse Cause-and-effect diagrams Tree Diagrams
Brainstorming
Process behaviour charts (SPC) Process maps
Design of experiments
Enumerate statistics (hypothesis tests) Inferential statistics (Xs and Ys) Simulation
Improve Force field diagrams FMEA
7M tools
Project planning and management tools Prototype and pilot studies
Simulations
Control SPC
FMEA ISO 900x
Change budgets, bid models, cost estimating models Reporting system
Figure 6 List of Six Sigma tools
5.3.2 Define
The define phase is meant to describe the specific problem, determine the goals, schedule and the exact scope of the project. It also describes the key customers to the process and their critical requirements. During the define phase it is also important that the project gains acceptance among those involved.
Tools
Project charter Stakeholder analysis Kick-Off meeting
The project charter lists the business case describing the starting situation, the problems and goals in measurable terms, the scope and the roles of the people involved. It is an important tool to get an overview of the project and make sure everyone understands the purpose and goal of the project.
29
The stakeholder analysis generates support for the project, and if there is resistance towards the project that is dealt with. It can be on a person to person basis in the forms of training.
The Kick-Off meeting is also supposed to build support for the project but also generate involvement and integration of the team members. During the kick-off meeting the projects importance and significance is described. After the meeting every member should know and understand his or hers role in the project. The kick-off meeting can be followed up by team building exercises if that is thought to increase the chance of success for the project. Sometimes such actions may be necessary, especially if participants are from various parts of the company.
5.3.3 Measure
The major function of the measure phase is to gather data on which the analysis can be made. It is also supposed to verify the accuracy of the data and relevancy for the problem at hand. It is easy to measure the wrong things and not capture the important aspects of the problem and therefore the process should be defined as well. In the measure phase the input factors and their related output should be identified, a mental model where input factors and their variances are affecting the output and the variation of the output can be used18. Variation is viewed as one of the biggest threats and the root cause to quality defects. The performance of the process should also be measured in this stage in order to compare changes so that improvements can be visualized.
Tools
Data collection plan Data source analysis Variation
The data collection plan simply describes when and which data will be collected by whom.
Data source analysis serves as a tool to reduce the effort needed to gather data, if possible already gathered data should be used in order to save time. The variation of the collected data is an important tool in order to give an understanding of the accuracy and behaviour of the data, valuable
18
30
information about the data can be found by visualizing and studying the distribution of the data.
5.3.4 Analyse
In the analyse phase the causes for problems are verified and relationships between input and output of the process are identified and verified. Focus is on root causes of problems. What tools to use depends a lot of the problem and what process that is studied.
Tools
Process flow chart Spaghetti diagram Value analysis Value stream map Group technology Factory layout
A process flow chart maps the processes in a way easy to overview. It gives a better understanding for the people involved; it secures a common
understanding as well so as to eliminate any misperceptions among the team. This map is the building block on which the more in-depth and advanced analysis is based. The flow chart also helps visualize how complicated a products flow may be.
A spaghetti diagram is essentially the same thing as a process map but with the added dimensionality of physical distances. This easily shows
suboptimal layouts in the factory floor layout and waste in the form of transportation and queues.
A value analysis distinguishes which activities are value-adding, non-value-adding and value-enabling. Non-value-non-value-adding activities are also referred to as waste. This is a very basic tool which could be very useful in determining what to focus when considering process improvements.
The value stream map is a very important tool which gives a lot of
information in an easy to understand way; some key data which may be put into the VSM is cycle times, inventory levels, number of operators and an overview of the information flow in the company. The value stream map separates waiting time and value adding time making it easy to identify waste. Since much problems stem from long lead times it can be a very useful tool in visualizing waste. A common method when creating the value
31
stream map is to draw the map by hand with representatives from the entire organization present; usually it is a good idea to follow the product through the shop floor physically. Later the map can be drawn using software and analysed in order to create the future state value stream map.
Factory layout; see Factory layout 5.8.
Group technology; see Group technology 5.9.
5.3.5 Improvement
The improvement phase is when solutions to the found problems are generated and the best solutions are chosen for implementation. If the work in the previous phases has been successful the solutions will address the real root causes and they will be based on real data reflecting the reality.
Tools
Levelling/Heijunka 5S
Setup time reduction or SMED Future value stream map One piece flow
Statistical process control/+QDIP
Heijunka is production levelling by both product mix and volumes. The idea is not building products according to customer demand which may swing up and down but instead take the total volumes for a period and use this data to create a mix and volume which is the same every day. By analysing pattern and volume of the customers demand it is possible to convert this demand into a levelled schedule every day, a mixed-model production.19
5S is a fundamental strategy for keeping the workplace organized and neat, the acronym stands for Sorting, Straightening or setting in order, Sweeping or shining, Standardizing and Sustaining. Implementing 5S helps keeping the workplace efficient and safe by keeping everything in its own place, nothing in excess and everything clean. Originally the 5S’es come from the Japanese terms Seiri, Seiton, Seiso, Seiketsu and Shitsuke.
When sorting a workplace it is a good idea to eliminate everything that is not needed, a good idea is to remove everything and only put those things back that are needed in the near future. Straightening or setting in order
19
32
means that everything should be in its place, every item should have a clearly marked position and items that are not needed on a daily basis should be put away. The items that are needed the most should be nearest. Sweeping or shining means that the workplace should be kept clean at all times, when machine equipment is kept clean dirt or oil spills can be used as indicators of maintenance needs. In order to maintain the cleanliness
cleaning should be part of every day’s schedule, for instance the last part of everyday could be dedicated to cleaning. Standardizing means that every workplace used for the same type of job should look the same with the same tools in the same place; a worker should be able to move between
workplaces without having to look for tools. Sustaining is the last S and concerns the previous 4S. In order not to revert to old ways, standards has to be set and the previous 4S should be reviewed and improved as the business evolves.
Setup time reduction or SMED is an important tool to reduce batch sizes and improve system flexibility. SMED is the lean concept and stands for Single digit Minute Exchange of Die and is the idea of completing a changeover in a single digit of minutes, hence less than ten minutes. The steps involved in performing SMED improvements are the following:20
• Separate internal from external operations • Convert internal setup operations to external • Standardize function, not shape
• Use functional fasteners or eliminate them
• Use mediated jigs, centering can be done as an external setup if jigs are standardized
• Use parallel operations, if it is possible to split the job on two people instead of one the setup time can be cut in half
• Eliminate adjustments; screws have an unlimited number of settings while switches have a finite number
• Finally use mechanization
These steps are derived from the car industry but they can be generalized and applied in almost all types of manufacturing.
Future value stream map, this is how the process should look like in a future state, the goal of an improvements project. The time horizon can be
anything from a couple of weeks to years. The future state value stream map is created when a present state value stream map is analysed for
20
33
improvements, from the future state value stream map the activities needed to reach the goal can be identified.
One piece flow is what it sounds like, a batch-less production, often in a cell, where products move from station to station one by one. The
advantages of doing this is greatly reduced work in progress and lead times, producing this way also exposes imbalances and other problems that can thereby be corrected.
Statistical process control is the measuring and monitoring of a process outputs in order to ensure the stability and effectiveness of the process. By using control charts it is easy to analyse the variation and draw conclusion as to whether the process is stable. Statistical process control can be used together with other KPI’s such as OEE, overall equipment effectiveness, which gives an overview of the total utilization of equipment used in a process. OEE measures the aggregated utilization based on three metrics arranged in a hierarchy; availability, performance and quality. There is also a top hierarchy called loading which gives the measurement TEEP, total effective equipment effectiveness.
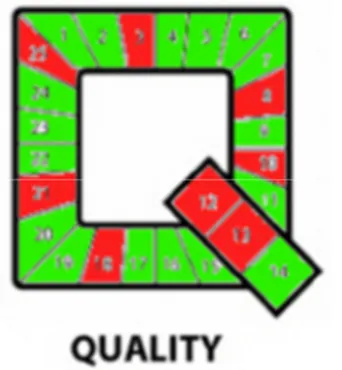
By presenting control charts and other process control measures on the factory floor operators themselves are able to suggest corrective actions and continuous improvement actions. These are then implemented by the responsible people. One way of presenting such statistical measures in a visual way is the +QDIP sheets, these sheets simply consists of the letters +, Q, D, I, P which could stand for safety or health, quality, delivery, inventory and productivity, any other definition is possible. The letters are divided into fields, for example 25 fields for 25 working days in a month, and these fields are coloured red or green every day based on underlying criteria, for instance a DPMO of less than 100. When the days go by it is easy to see how well a certain process or manufacturing cell is performing.
34
5.3.6 Control
In this phase the optimized process is controlled, measurements that
accurately describe the process are chosen to be monitored in the future. All in order to secure that the optimization is maintained long term.
Process documentation is important in order to standardize and document the improvements. This enables employees to be trained and knowledgeable about what has changed.
A process monitoring plan is critical to uphold the improvements. It clarifies how the process will be continuously monitored and what response by whom is necessary if a problem is identified. For example when the process does not meet the satisfactory standard specified. The monitoring plan can contain control charts that are updated continuously with measurements that are chosen for their accuracy in describing the process. The control charts should identify changes in the process that need to be adjusted. The process monitoring plan could also contain plans that stipulate how to deal with process changes. These changes are inevitable as processes change with time and it is important to make sure the optimization is not endangered by these changes but maintained.
5.4 Lean and Six Sigma
“What has been will be again, what has been done will be done again; there
is nothing new under the sun.”
Old Testament21
The joining of Lean and Six Sigma is one of the latest production
management philosophies. The idea is to join two of the most successful philosophies into one. When reading about lean six sigma it is clear that no unified approach exists, instead each author has his or her own view of how to implement this strategy. The reader understands then that there are multiple viewpoints, but essentially lean six sigma is the joining of the six sigma improvement project structure and tools with lean tools and ideas of waste and value. In the improvement project carried through during the course of this thesis the six sigma structure will be used with incorporated lean production tools and ideas.
21
35
5.5 Lean, Six Sigma and SME
Lean and Six Sigma implementation in Small and Medium sized Enterprises is a debated question, there are conflicting findings on whether
implementation is higher in larger companies or not. Bonavia & Marin22 discusses the conflicting findings of lean implementation from several different authors and concludes that it is indeed difficult to implement the whole set of practises for a smaller company and instead they often choose to implement a smaller subset of practises that they can afford. Thomas, Barton & Chuke-Okafor23 claim that there is a low application of statistical methods in smaller companies and that there is a lack of sufficient
theoretical knowledge in management to see the potential benefit of these tools. They even go so far as to say “In many cases they (management), and their employees, even become frightened when statistical tools are
discussed.” In the end they also recommend that a smaller company’s primary focus should be to undertake the project in the most cost efficient manner in order to be able to recoup the cost as fast as possible. One of the most important ways of achieving this should be to undertake lean six sigma project in-house instead of hiring costly consultant expertise.
5.6 Critique
One critique is that Six Sigma is simply old practices put into a new package and given flamboyant terms such as black belts. This is expressed by Joseph M. Juran in an interview24, and it is one of the most common critiques. This opinion has some truth to it as a lot of the practices in six sigma are indeed known from before the introduction of six sigma, but the bundling of practices into a package has advantages such as ease of implementation and a wider spreading of knowledge.
Another critique is that Six Sigma is not proactive enough, that it is more of a corrective action system25. An improvement program like six sigma increases the awareness of the entire workforce by educating large parts of it so the criticism is not entirely fair.
22
Bonavia and Marin 2006
23 Thomas et al. 2009 24 Paton M. 2002 25 Ramberg J. 2000
36
More technical criticism is that the normal distribution is not a good measure of the reality. This is true, but it does not mean that a model based on a normal distribution is not useful. Also there are arguments that the drift of 1,5 sigma is ridiculous and arbitrarily chosen. One could always argue about how many standard deviations the drift should consist of but the fact is that it is not realistic to assume that a process will not drift from its mean over time.
Lean has been criticized for inducing high level of stress onto the workers, Conti et al. raises the question “Is lean production deterministically
stressful, with benefits gained at the expense of workers?” in their article “The effects of lean production on worker job stress” 26.
Lean production does contain elements which might increase stress, such as the elimination of all waste which in turn can increase the intensity of work. This increased intensity could increase the stress induced on workers, also the practice of poka-yoke, fool proofing tasks, de-skill the tasks and reduces the workers active involvement. However, lean
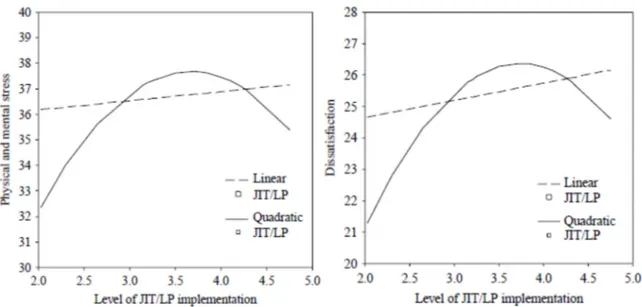
production has other characteristics that offset these properties, a factory with low inventory is easy to navigate and frustration of fitting parts that does not come together is reduced. Also in lean production workers are given additional responsibilities in improvement projects compared to normal production, in these projects creativity is important and they can serve as a stimulating factor. The findings27 from a number of surveys and questionnaires show an increasing level of workers stress and dissatisfaction as the level of lean production increases. This level is not linear and
decreases again as the level of lean productions continues to increase, see
Figure 8. Similar results are found for worker commitment, decreased
commitment at first but then increased as lean production implementation increases. 26 Conti et al. 2006 27 Conti et al. 2006
37
5.7 Manufacturing flexibility
There are several different dimensions to the term flexibility; it can mean the ability to cope with variation in demand, product types, volumes or introduction of new products.28 There are also flexible manufacturing
systems, usually automatic NC systems designed to handle different types of products efficiently.
The ability to cope with the introduction of new products is vital and plays a key role in most companies, especially in companies with a large range of products. Variation in demand is usually dealt with by using batch
production since the volumes for dedicated processes usually are not available. By using batch production it is possible to handle variation in demand not only between product ranges but also for the same product but over time. The ability for processes to change fast between different products is crucial for the flexibility. Variation of product types is usually also dealt with by using batch production since it enables different process flows to be used for different products and in order to be flexible change over time are key, the shorter the changeover is, the more flexible the company will be. Variation in demand can be tackled in different ways, by keeping inventory, by maintaining free capacity of the ability to ramp up production quickly. When a company takes decisions regarding the
28
Hill et al. 2009
38
flexibility of its operations it is important to look at what dimension of flexibility is needed since the dimensions differ in investment need. It is also important to consider the strategic relevance of the different dimensions so the cost can be related to the benefit of the improvement.
5.8 Factory layout
Factory layout is important for good flow, low inventories and waste elimination. A good layout is simple, easy to understand and visual, it creates a minimum of material handling and work in progress; it is also adapted to the type of production and current conditions. There are many strategic layouts to choose from, product layout, functional layout, cellular layout or line layout and in between those there are hybrid layouts. Which layout to choose is a strategic decision based on type of products, product range, order quantities, rate of new product introductions, and which aspects wins customer orders.29 Cellular layouts are a hybrid between batch and line processes often advocated within lean manufacturing. Some of the benefits of cellular manufacturing are reduced lead times which in turn means reduced work in progress, reduced setup times and improved direct labour productivity. It also enables easier planning and easier levelling or
smoothing of production. Cellular layout is sometimes referred to as group technology layout30 as the choices and grouping of products for a cell could be done by some kind of group technology selection. Group technology is especially interesting when there are not enough products of the same type to support cellular layout. Manufacturing cells can be of many different shapes, U-shaped, straight, L-shaped and so on. The benefit of not having a straight cell layout is the ability for operators to handle several tasks within the cell which makes is easier to balance the work and capacity of the cell. An important part of designing a cell is the aspect of material handling; bad material handling can create much waste in a production in the forms of transportation, scrap and searching. Important questions to ask when considering the aspect of material is when, what and how much, the goal is to supply a production line with exactly what is needed exactly when it is needed. 29 Hill et al. 2009 30 Mukherjee et el. 2009
39
5.9 Group technology
Group technology is a manufacturing philosophy aimed at increasing production efficiency by grouping products together based on different similarities such as manufacturing processes, geometry or manufacturing problems. The key idea is to bring some of the benefits of mass production to a mixed type of production. Some of the characteristics of a group technology system are the grouping of products into families, balancing of workload between production groups, a certain degree of autonomy and the clear identification of manufacturing cells on the shop floor. By grouping products together and standardizing their activities manufacturing,
engineering, purchasing and planning can be made more efficient. Grouping can enable the creation of manufacturing cells in which setup changes, unnecessary transportation, handling, inventory and lead time are reduced. In a manufacturing cell it is also easier to improve quality by direct
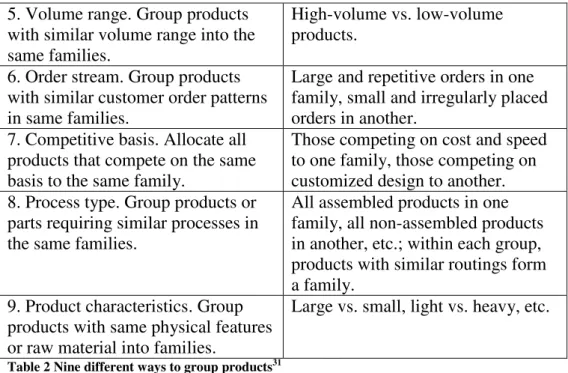
feedback between operators and because of the low throughput time, the cell can also be held accountable for the work easier. When grouping products there are several ways to group products into families which can then be further grouped into subfamilies with further internal similarities, nine ways of grouping are presented in the diagram below;
Criteria for Identifying Product Families
Examples 1. Product type. Group products of
the same type or function into families.
Motors and generators.
2. Market. Group all products sold in a certain geographic market in one family.
North America, Europe; market segmentation can also be based on type of user, e.g., commercial vs., residential user.
3. Customers. Group all products sold to one or more customers in the same family.
The products for two dominant customers make up two families, the rest of the products a third family; this segmentation does not work if several customers purchase the same products.
4. Degree of customer contact. Group products according to the degree of influence the customer has on the final product.
Group all stocked items in one family, all made to order in another, etc.
40 5. Volume range. Group products with similar volume range into the same families.
High-volume vs. low-volume products.
6. Order stream. Group products with similar customer order patterns in same families.
Large and repetitive orders in one family, small and irregularly placed orders in another.
7. Competitive basis. Allocate all products that compete on the same basis to the same family.
Those competing on cost and speed to one family, those competing on customized design to another. 8. Process type. Group products or
parts requiring similar processes in the same families.
All assembled products in one family, all non-assembled products in another, etc.; within each group, products with similar routings form a family.
9. Product characteristics. Group products with same physical features or raw material into families.
Large vs. small, light vs. heavy, etc.
Table 2 Nine different ways to group products31
To support this kind of classification of products some companies use a coding system for the properties of parts and then use this coding system to divide products or parts into families to be produced together. This type of system is often best when there are large amounts of different products to categorize; it is less useful for a lesser degree of diversification because of the costs associated with it. When there are lesser amounts of products and lesser degrees of diversification it is more useful to choose a method of clustering which does not require as much administration.
5.10 Group dynamics
5.10.1 Worker commitment
When introducing change into a workplace it will most likely bring about emotions and turmoil since most people prefer to do things in the same way as they have been doing and are used to. People want to do what feels safe and is well known. Because of this many initiatives to improve fails when people return to their old ways. This is one of the reasons a lot of the
literature dissuades the use of consults, they will by definition disappear and when they do, things are very likely to reverse to the way they were before. Lean manufacturing advocates worker involvement and responsibility, pushing responsibilities down in the organization to the factory floor
31
41
enables a long term change when workers understand the benefits of the change. To do this, education and empowerment is needed, otherwise the understanding will not be great enough.
5.10.2 Change teams and FIRO
When starting improvement projects it is often a good idea to set together a cross functional team with representatives from the entire organization. In order to get this team to work together in the best possible way it is
important to consider group dynamics. One such model is the FIRO model created by Will Schultz in 195832; this model stipulates that a group of people will go through three stages with two resting phases in between. The three main stages are inclusion, control and affection and in between these are the two resting phases were people will be content and relax in order to regain some energy. The first phase inclusion is when people first meet and ask themselves the questions. Do I want to be here? Do I fit in the group? Am I accepted by the group? And do I accept the other members of this group?
After this initial period where everyone has accepted each other, there is relief and contentment in the resting phase before the second phase starts. In the control phase the roles of the individuals in the team are shaped, this phase often contains struggles and confrontations. Questions often asked in this phase can be. Is my competence recognized? Do I recognize the others’ competence? In this phase it is important to focus on the task and not end up in conflicts. After the control phase the group goes into the resting idyll phase where everyone is happy that the conflicts have been resolved. The third and last phase affection is when the group is a team and this phase is the most productive one as everyone is focused on their own task and is comfortable enough to disclose their strength and weaknesses.
According to Schultz a team can at any time fall back from the attention phase to one of the previous phases again, especially if there is an event such as the disappearance or inclusion of a new member. If a project leader uses this model it is possible to avoid unnecessary conflicts and enable a faster teambuilding and in the end a higher probability of achieving his goals.
32
43
6 Define
This chapter presents the define step in the DMAIC improvement project, which is the empirical part of the thesis. Define is the first step and lays the foundation for what will be done later, after the define phase everyone involved should have a good understanding of why the project is needed, what impact it is intended to have and how it will be implemented. Much of the work done in the define phase has been done by Magnus
Kristensen, planning and logistic development manager at Enics, prior to the start of this thesis in order to motivate a master thesis being done at Enics. The delimitation to focus at parts of the Kanban line was also done prior to the definition of the thesis itself. The problem studied has been known by the planning department at Enics but the time to investigate potential solutions has not been available. Complaints from customers are common but accurate statistics regarding the number of complaints are not available. The complaints often concern delivery times and sometimes defective cards but this is not as common. Problems with the current processes are bad productivity, very high work in progress, long lead times and several long queues. Accurate data as to how large these problems are is not available and this will be part of what needs to be done in the define phase. In order to grasp the extent of the problems average queues, lead times and work in progress will be measured.
6.1 Process overview
In order for the reader to have a good understanding of the thesis the processes are presented and the parts of manufacturing considered in this report are specified.
44
Process overview
6.1.1 Automated assembly of PCBAs
Printed circuit boards are printed with solder paste, mounted with surface mounted components and heated to solder the components in place. This is done in automated surface mounting machines loaded with reels of
components. This process will not be studied in this thesis, although problems with long changeover time and lack of components are known.
45
The long changeover cause large batch sizes and an uneven flow for the rest of the shop.
6.1.2 Manual assembly of through hole components
Most boards require additional connectors screwed in place and through-hole components mounted, this is done by hand in different groups. One of the groups is controlled with Kanban cards and this is the group where the boards studied pass through. Before boards enter manual assembly there is a queue of incoming parts where they are stored order wise in racks. Next to the manual assembly area the components needed for each job are stored on shelves sorted by job types; the refilling of components is done by the storage staff several times per day. Each new job also requires printing of so called mol-lists which contain all the operation steps and components as well as the order number and some additional information such as number of boards and type of board. The setup time for each new job is quite long, roughly around 20 minutes.
6.1.3 Soldering
Components from the previous process are soldered in lead free machines or in machines with lead based solder. The machines consist of two wave soldering machines and two selective soldering machines. Some cards are also partly soldered by hand. The boards initially looked at pass through the selective soldering and the wave soldering machine. The selective soldering machine is semi-automated and has a small conveyor on which the boards enter and leave the machine. Monitors display the actual soldering being performed in the machine and on these the operator can monitor the process in real time and high detail. The changeover in this machine requires a new program being loaded and the adjustment of the width of the conveyor, the time it takes for this is approximately 10 minutes. Also part of this process is inspection of the soldering, labelling of boards and depaneling by scoring or V-cut. Scoring or V-cut is when multiple printed circuit boards initially held together are separated with a simple rolling blade sliding through a score. If the soldering in the machine is not done properly it is redone by hand during the inspection.
6.1.4 Visual Inspection
After soldering most boards return to the area of manual assembly for visual inspection. The steps involved in inspection differ between boards but involve a visual control of components, the soldering previously done,