Hygro-thermal and Energy Related Performance of Vertical
Greening on Exterior Walls – A Field Measurement Study
Johnny Kronvall, Professor 1Hans Rosenlund, Ph.D. 2
1 Malmö University and Green Building Science, Sweden 2 Malmö University and CEC Design AB, Sweden
KEYWORDS: vertical greening, green walls, living walls, moisture conditions, evaporative cooling, energy balance, mould growth.
SUMMARY:
Vertical greening on external walls has lately been the subject of increasing interest, where much hope is spent upon the benefits of enhanced energy performance of buildings. However, there is a lack of knowledge and experiences of the technical performance of such walls, especially their hygro-thermal and energy related behaviour under different climatic conditions.
This paper presents a long-term, full-scale field experiment study on a masonry wall in the southern part of Sweden. Different kinds of wall greening have been included in the experiment, mainly solutions based on commercially available cassettes, simple home-built pocket-like plant pots and different climbers.
Monitored parameters in the technical part of the program include outdoor and indoor climate, air gap and surface temperature and relative humidity, driving rain and thermal flux.
The wall greening systems studied quite strongly influence the hygro-thermal behaviour of the original walls; greening may even contribute to dryer conditions by protecting from driving rain. Caution must be paid to protect from water leakage, which may cause mould growth. The energy balance of poorly insulated walls is slightly improved in winter by raised air gap temperatures, and in summer by shading. No evaporative cooling effect has been found in this study.
1. Introduction
Vertical greening on external walls has during the last years been the subject of increased interest from city planners, architects and real estate developers (Köhler 2008). Much hope is spent upon the
benefits of green walls, not only from an esthetical point of view, but also technically: e.g. enhanced energy performance with vertical greening, cooler street canyon climate during hot days and traffic noise reduction. Vertical greening concepts have been developed in a number of countries during the last decades, especially in Germany, Austria, the Netherlands and the US (Perini et al. 2013, Enzi 2011, Mir 2011, Tilley et al. 2012). In the northern parts of Europe and North America there exists however much less practice and thus experience of exterior wall greening and so little is known today about different greening systems and adequacy of different plants as well as the technical behaviour of wall greening in relation to the building under influence of e.g. more severe winter conditions. In a collaborative research project with the Swedish University of Agricultural Sciences (SLU), Malmö University and the building developer and contractor PEAB as partners, research on the hygro-thermal and energy related performance forms one part which is performed by Malmö University and CEC Design AB. The results from this part of the project form the basis for this paper. The most extensive part of the project, however, is related to horticultural issues, such as planting systems, plant choice and adequacy, irrigation solutions etc. This research is mainly performed by SLU.
2. Hypotheses and methods
The following hypotheses were formulated for the behaviour and hygro-thermal and energy related performance of vertical greening on exterior walls:
• The vertical greening modifies the microclimate for the exterior wall behind the greening in the following respects:
o Cooler summer conditions o Warmer winter conditions
o Relative humidity is affected by the air temperature in the gap between the wall greening and the wall behind
o Vapour content of air nearly equals that of ambient outdoor air
o The wall behind the wall greening is effectively protected against driving rain • The risk for mould growth behind the wall greening must be paid attention to when designing
wall greening systems
• Vertical greening on exterior walls influence the energy balance of poorly insulated buildings: o in wintertime by creating an increased thermal insulation
o in summertime by decreasing the cooling load of the building, while o for modern well-insulated buildings these effects are negligible
The hygro-thermal and energetic behaviour of outer walls with and without vertical greening was studied by means of field measurements described below.
3. Experimental setup
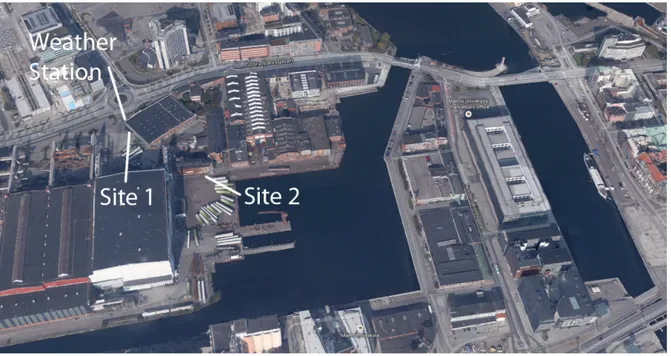
The study is using two experimental sites, both located in an industrial area in the city of Malmö in southern Sweden (N 55.6108, E 12.9896), see FIG 1.
3.1 Site 1 – Driving Rain
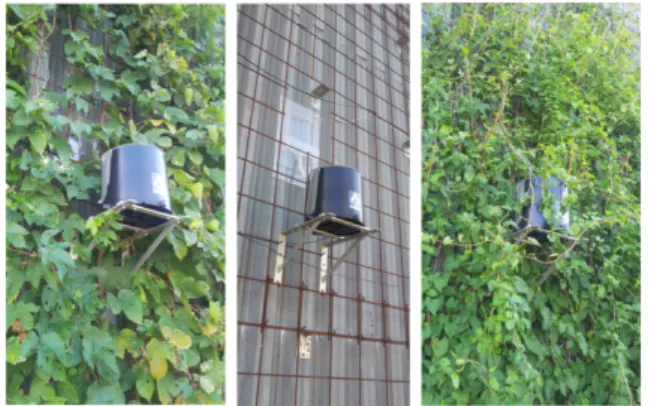
Site 1 is a south-west-facing corrugated steel façade of an industrial warehouse building. The wall was prepared for the propagation of climbers by mounting a standard reinforcement mesh #100 mm at a distance of 150 mm outside the wall surface, thus creating a trellis. A number of different climbers were planted and established in the ground and consequently climbing up in the trellis. The objective of the study at this site was to monitor the ability of wall vegetation to protect the wall behind against driving rain. In order to quantify this protection capacity, driving rain was monitored behind the vegetation layer and compared to the amount hitting the free, unprotected wall. A special meter device, the type of which has been used earlier and validated in a number of extensive studies of driving rain on buildings (e.g. Sandin 1984) was used, see FIG 2. The driving rain collected by the meter is further led to a standard tipping bucket rain gauge producing electrical pulses to the monitoring system depending on the intensity of the driving rain hitting the façade.
FIG 2. Site 1 with driving rain meters. Left: Humulus lupulus (Hops)
Right: Fallopia baldschuanica (Bukhara fleeceflower)
FIG 3. The wall-greening systems (Site 2). Left: Felt pocket module
Right: Modular panel
3.2 Site 2 – Temperature, Moisture and Thermal Flow
Site 2 is an old unoccupied, yet heated, office/workshop building with a south-facing ≈ 40 cm thick massive yellow masonry wall, rendered on the inside. Two different wall greening systems were mounted on the outside of the wall: 1) Modular panels (Vertigreen™ ) from Zinco Gmbh: a) placed with an air gap of 100 mm between the back of the panel and the wall and b) with mineral wool insulation bat (70 mm thick) close to the back of the panel leaving an air gap of 30 mm between the back of the bat and the wall and 2) On-site-made felt pocket modules placed with an air gap of 30 mm between the back of the panel and the wall, FIG 3. Also the microclimate close to the wall created by an already present and well-established plant of Virginia Creeper (Parthenocissus quinquefolia) growing on the wall was the subject of field measurements.
On locations on the inside of the exterior wall, where there was a greening system on the outside or where there was an undisturbed reference area without any greening, heat flow meters were glued to the wall. Further, indoor air temperature was monitored in the seasonally heated office room.
3.3 Monitoring System
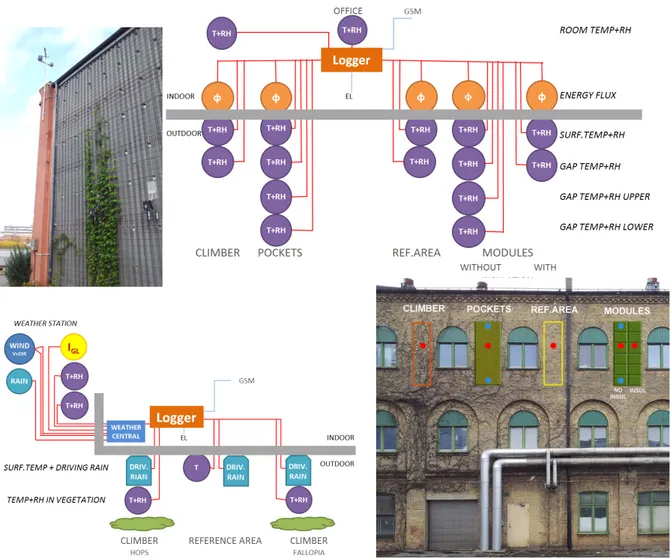
Ambient weather conditions were monitored by means of a weather station built up with commercially available sensors for air temperature (radiation protected), relative humidity, total solar radiation hitting a horizontal plan, wind velocity and direction, precipitation and driving rain (site 1). Weather data, as well as data regarding temperatures, relative humidity levels and heat fluxes were continuously collected for further analyses by means of two data loggers, see FIG 4.
FIG 4. Monitoring setup. Left: Weather station and Site 1 with driving rain tests. Right: Site 2 with hygro-thermal and energy performance measurements.
4. Results and Discussion
This section presents measured data, either as monthly averages during a year or as details from two winter and two summer days. The days chosen; 17–18 January are cold with easterly wind, and 17–18 July are averagely warm and sunny with winds around west.
4.1 Thermal Performance
The thermal performance is evaluated through the temperature difference between the outdoor air and the air in the gaps or close to the wall surface (FIG 5).
The winter case shows considerable temperature rise, especially in the thinner gaps behind the
insulated modules and pockets. The latter also has a steel sheet cover on top, decreasing the ventilation rate.
In the summer, the air space temperatures are closer to outdoor, except for the climber and the reference area, where the solar radiation makes temperatures increase during daytime. This effect is also seen in the January case, where the first day is sunny, but the second is not.
Also the wind affects the temperatures; higher wind speeds increase the ventilation rate and make the temperatures approach the outdoor ones.
FIG 5. Air temperature differences in the air spaces or close to the wall compared to outdoor air during; 17–18 January (top); and 17–18 July (bottom).
It is often argued that vegetated walls and roofs generate a considerable evaporative cooling effect that reduces the need for active cooling of the building. The backside temperatures of the systems were not measured, but in FIG 6 we see the differences between wall surface and air gap temperatures of the test areas. A negative balance could thus indicate a radiative cooling effect from the green systems. However, this effect seems to be very marginal. Probably most of the evaporative heat exchange will take place between the plants and the surrounding air outside the plants, thus cooling the air in e.g. a street canyon. Later in the project this will be studied by means of simulations.
FIG 6. Monthly average temperature differences between wall surfaces and air gaps.
-‐4 -‐3 -‐2 -‐1 0 1 2 3 4 5 -‐2 0 2 4 6 8 10 12 14 16 00:00 06:00 12:00 18:00 00:00 06:00 12:00 18:00 m/s
K Climber Pockets RefArea Module (NoIns) Module (Insul) WindSpeed
-‐4 -‐3 -‐2 -‐1 0 1 2 3 4 5 -‐2 0 2 4 6 8 10 12 14 16 00:00 06:00 12:00 18:00 00:00 06:00 12:00 18:00 m/s
K Climber Pockets RefArea Module (NoIns) Module (Insul) WindSpeed
-‐1 0 1 2 3 4 5 6
okt-‐12 nov-‐12 dec-‐12 jan-‐13 feb-‐13 mar-‐13 apr-‐13 maj-‐13 jun-‐13 jul-‐13 aug-‐13 sep-‐13 okt-‐13
K Climber Pocket RefArea Module Module-‐Insul
Missing data
4.2 Hygric Performance
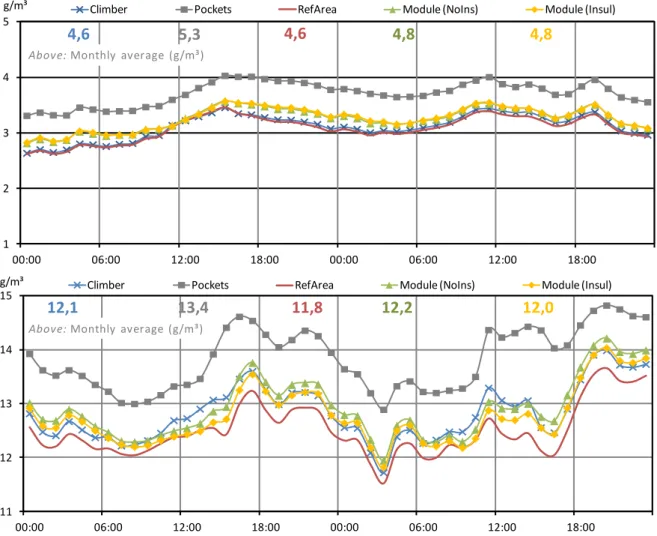
In both winter and summer, the vapour concentration levels are quite similar in all locations, except behind the pockets, where they are considerably higher (FIG 7). Winter conditions are stable, while in the summer moisture levels vary more due to evaporation processes from plants and surroundings.
FIG 7. Vapour concentrations in the air spaces or close to the wall during; 17–18 January (top); and 17–18 July (bottom). Monthly averages also included.
There are two reasons for the higher moisture level behind the pockets; 1) the above mentioned steel sheet cover on top of the space reduces ventilation; 2) at the same time water transport through the felt structure into the space was discovered. Conditions suitable for mould growth occur from time to time and a preliminary investigation performed with an endoscope seems to confirm the existence of cob web and signs of mould growth. High moisture levels found in the wall surface could also indicate water leakage from the irrigation system. These issues will be further investigated.
4.3 Energy Performance
The thermal transmittance of the poorly insulated south-facing heavy brick wall varies considerably with outdoor weather conditions and seasons, see Fel! Hittar inte referenskälla.. During the winter, when solar radiation is low, all test areas have similar transmittance values. However, increasing solar radiation accumulation in the summer counteracts energy losses from the building, clearly seen at the unprotected reference area. We also notice the effects of shading; by the modules, but also by the leaves of the climber from May to September.
1 2 3 4 5 00:00 06:00 12:00 18:00 00:00 06:00 12:00 18:00
Climber Pockets RefArea Module (NoIns) Module (Insul)
g/m³
4,6 5,3 4,6 4,8 4,8
Above: Monthly average (g/m³)
11 12 13 14 15 00:00 06:00 12:00 18:00 00:00 06:00 12:00 18:00
Climber Pockets RefArea Module (NoIns) Module (Insul)
g/m³
12,1 13,4 11,8 12,2 12,0
FIG 8. Annual and monthly average variations in thermal transmittance of the different test areas and the bare brick wall. Monthly global solar radiation and average outdoor temperature included.
The monthly values presented are based on diurnal averages, since such a representation of the thermal transmittance should fairly well reflect the thermal inertia effects of the approximately 40 cm massive masonry wall. The variations of the modules’ performance in the warmer period, when the flux is not unidirectional, could thus be explained by the effects of time lag versus outdoor
temperature stability. For instance, in May the range of average diurnal outdoor temperatures was 13 K, while in June only 6 K. Average monthly wind speeds during the summer were 2,5–2,9 m/s, which range should not affect the transmittance to a noticeable degree.
The average annual energy loss from this poorly insulated wall is lowest without any vegetation systems. However, the important winter transmissions are very similar, except for the insulated modules, which is slightly lower. Further, it should be kept in mind that in summer the heat gains through windows are usually dominating those through walls.
4.4 Driving rain
Even if the resolution of the driving rain gauges are rather coarse for detailed analyses, when
summarized over the year we get remarkable differences between the reference area and the collectors behind the two climbers. The vegetation reduces the driving rain penetration of the wall by more than half, see FIG 9. Also during the winter, when only branches and some dead leafs remain, there is a clear protection effect of the vegetation.
FIG 9. Driving rain. Two climbers compared to bare reference area on a wall facing prevailing wind.
-‐20 0 20 40 60 80 100 120 140 160 180 -‐0,5 0,0 0,5 1,0 1,5
nov-‐12 dec-‐12 jan-‐13 feb-‐13 mar-‐13 apr-‐13 maj-‐13 jun-‐13 jul-‐13 aug-‐13 sep-‐13 okt-‐13
Solar radiation (kWh/m²) Temperature (°C) Thermal Transmittance
W/m²K Climber Pocket RefArea Module Module-‐Insul I-‐GL T-‐ave
0,55
0,88
0,45
0,82
0,67
Annual average: 0 2 4 6 8 10okt-‐12 nov-‐12 dec-‐12 jan-‐13 feb-‐13 mar-‐13 apr-‐13 maj-‐13 jun-‐13 jul-‐13 aug-‐13 sep-‐13 okt-‐13
l/m² Fallopia (left) RefArea (mid) Hops (right)
Co rr up te d da ta
13,6
30,9
12,7
Total:
44% 100% 41%5. Conclusions
The hygro-thermal and energy related performance of a number of vertical vegetation systems on outer walls in Malmö, southern Sweden, has been investigated in this year-round field measurement study. In summary, the result of the study can be concluded as follows:
The thermal conditions in air gaps behind the greening systems are slightly warmer in both winter and summer. However, solar radiation raises temperatures close to the bare wall and also in climbers.
Vapour concentrations are marginally elevated behind the greening, but since temperatures vary
diurnally, relative humidity does not reach high and stable levels that indicate risk for mould growth. Nevertheless, mould growth was found in one case, where water leaked into the air gap, probably through the felt material and/or from the irrigation system. These risks require close attention at design and construction stages.
Wall greening effectively protects against driving rain. Climbers reduced the annual amount of driving rain on the facade by more than half.
The energy balance of poorly insulated buildings benefits from the slightly raised air gap temperatures. In summer the shading of the greening reduces solar heat load and thus risk for overheating. Climbers, dropping their leaves in the winter, combine this beneficial shading with allowing for solar access in the winter, thus reducing heat loss. These effects decrease with increasing thermal insulation, and is not estimated to play any significant role for modern standard buildings. This study has not been able to identify any evaporative cooling effect of the green module systems – an effect that is often argued for in the debate.
6. Acknowledgements
The Swedish Research Council FORMAS and the building developer and contractor PEAB have financially supported the research study. The support is gratefully acknowledged.
References
Enzi V. et al. 2011. Leitfaden Fassadenbegrünung. (Guide book for vertical greening.) ÖkoKauf Wien, Arbeitsgruppe 25 Grün- und Freiräume. www.oekokauf.wien.at
Köhler M. 2008. Green facades – a view back and some visions. Urban Ecosystems, 2008, Vol. 11:423-436. Springer.
Mir M.A. 2011. Green facades and building structures. Master thesis CIE5060, TU Delft.
Nevander L.E. & Elmarsson B. 1994. Fukthandbok, Praktik och teori. (Moisture handbook, Practise and theory) 2nd ed. Stockholm, AB Svensk Byggtjänst and the authors. 538 p.
Perini K. et al. 2012. Vertical greening systems, a process tree for green facades. Urban Ecosystems, 2012, Vol. 16:265-277. Springer.
Sandin K. 1987. Fukttillstånd i autoklaverade lättbetongväggar. (The moisture condition in aerated lightweight concrete walls.) Report TVBM-3026. Div. of Building Materials. Lund Institute of Technology, Lund, Sweden
Tilley D. et al. 2012. Vegetated walls: Thermal and growth properties of structured green facades. Final report to Green Roofs for Healthy Cities – Green Walls Group. UM-09040836. Toronto.