Particle emissions from rail traffic: A literature review
Saeed Abbasi,1 Anders Jansson2, Ulf Sellgren1, Ulf Olofsson11- Machine Design, KTH Royal Institute of Technology, Stockholm, Sweden 2- Dept. of Applied Environmental Science, Stockholm University, Stockholm, Sweden
Corresponding authors’ email: sabbasi@md.kth.se
Abstract
Particle emissions are a drawback of rail transport. This work is a comprehensive presentation of recent research into particle emissions from rail vehicles. Both exhaust and non-exhaust particle emissions are considered when examining particle characteristics such as PM10, and PM2.5
concentration levels, size, morphology, composition, as well as adverse health effects, current legislation, and available and proposed solutions for reducing such emissions. High concentration levels in enclosed rail traffic environments are reported and some toxic effects of the particles. We find that only a few limited studies have examined the adverse health effects of non-exhaust particle emissions and that no relevant legislation exists. Thus further research in this area is warranted.
Nomenclature / Abbreviations
ACGIH: American Conference of Governmental Industrial Hygienists ATSDR: Agency for Toxic Substances and Disease Registry
BC: Black carbon
CEN: The European Committee for Standardization DFG: Deutsche Forschungsgemeinschaft
DPM: Diesel particulate matter EC: European Commission
EPA: Environmental Protection Agency EU: European Union
EUROMOT: The European Association of Internal Combustion Engine Manufacturers IARC: International Agency for Research on Cancer
MECA: Manufacturers of Emission Controls Association MMT: Methylcyclopentadienyl manganese tricarbonyl MMD: Mass median diameter
MSHA: Mine Safety and Health Administration
NIOSH: The National Institute for Occupational Safety and Health PAHs: Polycyclic aromatic hydrocarbons
PM: Particulate matter (Subscripts 10 and 2.5 denote particles less than 10 and 2.5 µm respectively)
UFP: Ultrafine particles (Particles less than 100 nm) UIC: International Union of Railways
UNIFE: The Association of the European Rail Industry WHO: World Health Organization
1. INTRODUCTION
Commercial rail transport appeared in the UK between 1804 and 1812, by means of steam locomotives running on cast iron rails. The London Underground, the oldest subway in the world, opened in 1863, 10 years before Carl Benz invented the first four-stroke gasoline engine for commercial vehicles used in road transport (Williams et al., 2000). Today, both of these transport modes are recognized as particle emission sources. However, the amount of research and legislation to limit particle emissions from rail transport is markedly small. Ever since the investigation of wear particles in rail transport began in 1909 (Anonymous, 1909), the high mass concentration levels of these particles in enclosed environments have raised worries among researchers concerned with air quality as was pointed out by Olander and Jansson (1997). They also emphasized the need for emission mitigation measures. However, effective action has yet to be taken because of lack of relevant knowledge.
It can be noted that the exhaust emissions of CO, NOx and PM from rail transport sector are less
than those from the road transport, aviation, and shipping sectors (Uherek et al., 2010; Fuglestvedt et al., 2008). However, no reports on the relative contributions to non-exhaust emissions are known to the authors, and increasing rail transport and ongoing development of high axle load trains and of high-speed trains can increase non-exhaust particle emissions. This necessitates more accurate considerations in this context.
Rail transport involves various particle emission sources. Exhaust and non-exhaust emissions are two categories of particle emissions from rail vehicles, and research has addressed these in recent years. The aim of the present review is to consider the following aspects of the selected studies:
current legislation and standards. adverse health effects of particles.
particle characteristics (e.g., size, morphology, mass concentration, and composition). current strategies for reducing emissions of these particles.
Table 1 summarizes the works selected; as shown, both exhaust and non-exhaust emissions were taken into account. It should be noted that most studies of non-exhaust emissions have examined electric railways or subway systems, while most studies of exhaust emissions have examined railway systems with diesel locomotives, diesel multiple units (DMUs) or other diesel rail cars. However, both exhaust and non-exhaust emissions are traceable in all rail traffic, because even electric railways or subways use rail vehicles with diesel engines for shunting or maintenance purposes, while in locomotives and DMUs, wheels, rails, brake pads, and brake blocks, for example, contribute to non-exhaust emissions.
Selected topics Publication year (number of studies)
Exhaust emissions Non- Exhaust emission
Current legislation 2009(1) ; 2008(1); 2004(1); Relevant literature, as there is no specific legislation. Health effects 2011(1); 2009(1); 2008(1); 2006(1); 2005(2); 2002(1); 1989(1) 2011(1); 2010(2); 2009(2); 2008(2); 2007(2); 2005(2); 2004(1); 2003(1); 2000(1), 1999(1)
PM levels in particular environ-ments, such as stations, platforms,
tunnels, and rail vehicles 2010(2)
2011(1), 2010(2); 2009(1); 2008(1); 2007(7);
2005(1)2006(4); 2002(3); 2001(2); 1998(1)
Chemical composition of particles 2007(1); 2006(1); 2004(1);
1998(1) 2012(1); 2011(2); 2010(1); 2009(1); 2007(4); 2005(3); 2004(1); 2001(2); 1909(1) Particle morphology 2010(1); 2007(1); 2006(1); 2002(1); 1999(1); 1998(1) 2012(2);2011(2), 2010(1); 2009(1); 2008(1) Particle size 2010(1); 2007(1); 2006(1); 2002(1); 1998(1) 2012(2);2011(4); 2010(2); 2009(1); 2006(2); 2004(1) Current methods for reducing
emissions or concentrations of particles 2012(2); 2011(2); 2010(1); 2009(1); 2007(3); 2006(2) 2012(2); 2009(2); 2006(2); 2005(1); 2002(1); 1997(1), 1993(1) 2. METHOD
We applied the integrative research review method of Cooper (1989), who suggested the following five stages for a research review:
I) defining a problem and hypothesis, resulting in an integrative research review
II) determining the data collection strategy and selecting multiple channels to prevent bias in coverage
III) evaluating retrieved data and deciding what data to include in the review IV) analyzing the reviewed literature
V) reporting the results
In evaluating and analyzing data we have not applied strict quality criteria since this would leave very few qualifying data and since the systems studied are inherently not a well-defined entity. Computerized key word searching was used in this review, as the technique is fast and efficient. However, this approach limits the search to electronically available studies, usually published after the 1980s. To compensate for this restricted coverage, we also performed some limited physical searches of the collection in the library of KTH Royal Institute of Technology, Sweden, searching technical magazines (not scientific journals), reports, and dissertations. That survey mainly included English documents. The key words used in the search were “underground”, “subway,” “railway”, “train”, “locomotive”, “platform”, “commuter”, “compartment”, “particle”, “ventilation”, “PM10” ,“PM2.5”, “brake block”, “brake shoe”, and “brake pad”,
Electronic documents in German, Swedish, and French documents were also searched to a limited extent, using comparable keywords.
We compiled 133 publications, comprising 99 articles in scientific journals and from conferences, five book and dissertation chapters, and 29 technical reports. In addition, we also examined various relevant pieces of legislation.
3. RESULTS
3.1 LEGISLATION
Both the USA and the EU have issued directives that set standards for exhaust emissions from diesel locomotives and railcars. These standards focus on controlling the mass of emitted hydrocarbon, NOx, CO, and PM (in g) per unit of power output. Both sets of standards contain
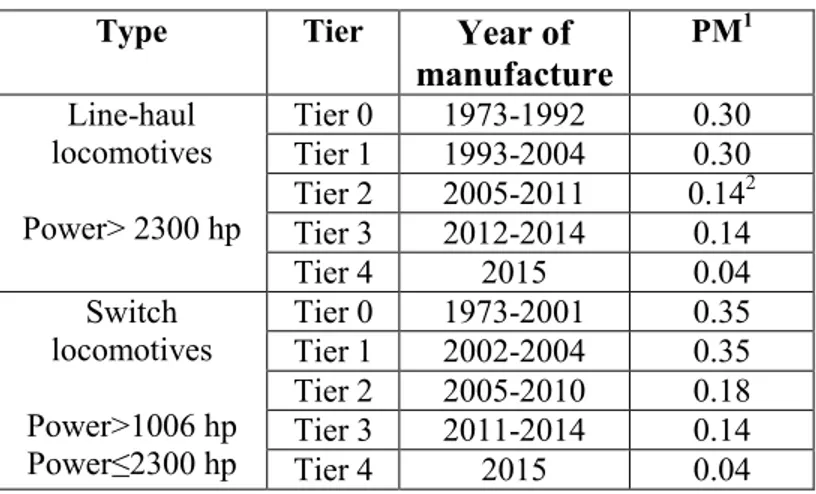
subcategories for the various applications or output powers of diesel engines. In the USA, the EPA is using three approaches to controlling and reducing exhaust emissions from rail traffic: tightening emission standards for existing locomotives; specifying near-term engine-out emissions for newly built locomotives (TIER 3); and determining long-term standards based on applying high-efficiency exhaust gas treatment starting in 2015 (TIER 4). The current regulatory framework regarding PM is summarized in Table 2.
Type Tier Year of
manufacture PM1 Line-haul locomotives Power> 2300 hp Tier 0 1973-1992 0.30 Tier 1 1993-2004 0.30 Tier 2 2005-2011 0.142 Tier 3 2012-2014 0.14 Tier 4 2015 0.04 Switch locomotives Power>1006 hp Power≤2300 hp Tier 0 1973-2001 0.35 Tier 1 2002-2004 0.35 Tier 2 2005-2010 0.18 Tier 3 2011-2014 0.14 Tier 4 2015 0.04 1 g bhph-1 converted into g kWh–1
2Until January 2013: group (a), PM, 0.27 g
kWh–1;group (b), PM, 0.33 g kWh–1.
In the EU, legislation regulating the exhaust emissions of locomotives came into force in 2004. In April 2004, EU Directive 97/68/EC was revised and Directive 2004/26/EC was introduced. This standard sets limit values for non-road mobile machinery (NRMM) engines, including DMUs and locomotives, based on their output powers. As Table 3 shows, these limit values were implemented in two stages, the first (IIIA) effective 2005–2009 and the second 2011–2012. Table 2. Current US regulations covering particle emission factors (g kWh–1)
for line-haul and switching locomotives (CO, NOx, HC levels are excluded).
All locomotives must be equipped with an automatic engine stop/start (AESS) idle control (EPA Locomotives, 2011).
However, UNIFE has predicted that stage IIIB will not be fully realized before mid-2015 because of the recent economic crisis (Bönnen, 2009). This EU legislation is summarized regarding PM in Table 3.
Table 4 shows selected data on US and EU outdoor air quality regulations, which limit emissions of PM10, PM2.5, PAHs, and certain metal compounds. These emissions are considered
independently of emissions of nitrogen dioxide, sulfur dioxide, ozone, and carbon monoxide, the limits for which are not shown in the table (EPA NAAQS, 2011; EU Directive 2008/50/EC, 2008).
(µg m-3) (µg m -3) (µg mLead -3) (µg mNickel -3) (µg mArsenic -3) Cadmium (µg m-3) (µg mPAHs -3) US
EPA NAAQS Daily (24 h) Annual 35 12 150 ⎯ 0.15 ⎯ ⎯ ⎯ ⎯ ⎯ ⎯ ⎯ ⎯ ⎯
EU directive 2008/50/EC
Daily (24 h) ⎯ 50 ⎯ ⎯ ⎯ ⎯ ⎯
Annual 25 40 0.5
aThe rolling three-month average.
bThe limit 50 µg m-3 must not be exceeded 35 times a calendar year.
cTarget value enters into force 31 December 2012.
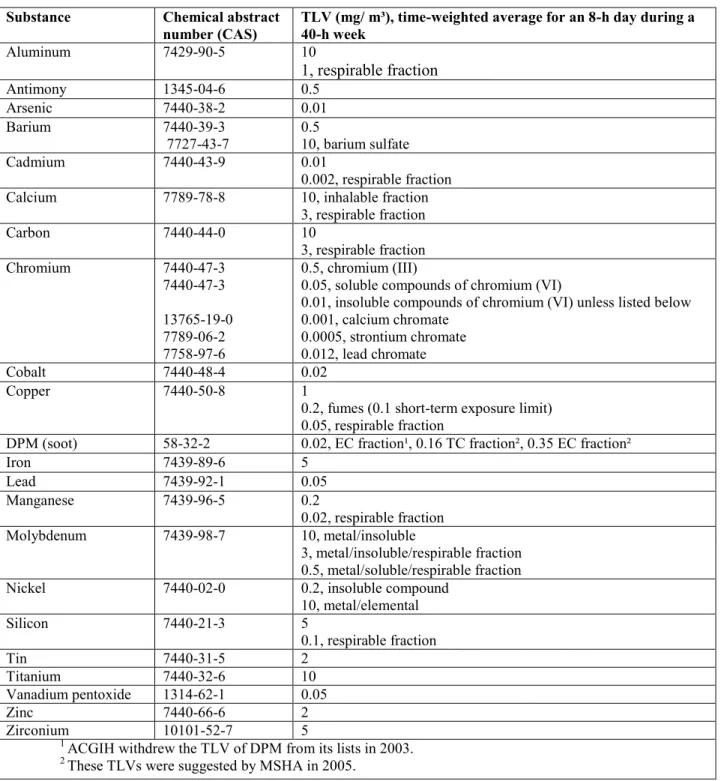
Occupational exposure limits (OELs) specify guidelines that help to protect people’s health during exposure to natural or man-made substances, and several national and international organizations are currently investigating them. ACGIH is one of the pioneering organizations. Recently, Schenk et al. (2008) compared exposure limit values set by ACGIH with those of 17 well-known organizations in Europe, North America, Japan, and Australia. They reported that the broadest substance coverage was offered by ACGIH, and that the OELs set by ACGIH were usually the lowest or next to lowest. The threshold limit value (TLV) is one of the indices used by ACGIH and refers to conditions under which nearly all workers may be exposed day after day during a working life without adverse health effects. Table 5 shows some of rail traffic relevant OELs for various materials and substances.
Stage Propulsion by: Approval
from Replacing on the Market g kWhPM -1
IIIA Railcar P>130 kW 01/07/2005 01/01/2006 0.2 Locomotive 560kW≥P≥130k W 01/01/2006 01/01/2007 0.2 Locomotive P>560 kW 01/01/2008 01/01/2009 0.2 Locomotive P>2000 kW & SV>5 l/cylinder 01/01/2008 01/01/2009 0.2 IIIB Railcar P>130 kW 01/01/2011 01/01/2012 0.025 Locomotive P>130 kW 01/01/2011 01/01/2012 0.025
Table 3. Summary of EU Directive 2004/26/EC (2004) about PM levels (CO, NOx, HC levels are excluded.)
Table 4. Comparison of US and EU outdoor air quality regulations and some of the parameters (CO, NO2, SO2, O3 are
Substance Chemical abstract
number (CAS) TLV (mg/ m³), time-weighted average for an 8-h day during a 40-h week
Aluminum 7429-90-5 10 1, respirable fraction Antimony 1345-04-6 0.5 Arsenic 7440-38-2 0.01 Barium 7440-39-3 7727-43-7 0.5 10, barium sulfate Cadmium 7440-43-9 0.01 0.002, respirable fraction
Calcium 7789-78-8 10, inhalable fraction
3, respirable fraction Carbon 7440-44-0 10 3, respirable fraction Chromium 7440-47-3 7440-47-3 13765-19-0 7789-06-2 7758-97-6 0.5, chromium (III)
0.05, soluble compounds of chromium (VI)
0.01, insoluble compounds of chromium (VI) unless listed below 0.001, calcium chromate
0.0005, strontium chromate 0.012, lead chromate
Cobalt 7440-48-4 0.02
Copper 7440-50-8 1
0.2, fumes (0.1 short-term exposure limit) 0.05, respirable fraction
DPM (soot) 58-32-2 0.02, EC fraction¹, 0.16 TC fraction², 0.35 EC fraction²
Iron 7439-89-6 5 Lead 7439-92-1 0.05 Manganese 7439-96-5 0.2 0.02, respirable fraction Molybdenum 7439-98-7 10, metal/insoluble 3, metal/insoluble/respirable fraction 0.5, metal/soluble/respirable fraction
Nickel 7440-02-0 0.2, insoluble compound
10, metal/elemental Silicon 7440-21-3 5 0.1, respirable fraction Tin 7440-31-5 2 Titanium 7440-32-6 10 Vanadium pentoxide 1314-62-1 0.05 Zinc 7440-66-6 2 Zirconium 10101-52-7 5
1 ACGIH withdrew the TLV of DPM from its lists in 2003.
2 These TLVs were suggested by MSHA in 2005.
These OELs are set for time-weighted averages (TWA), usually for an eight-hour day during a 40-hour week. Short-term exposure limits (STEL) are used in rare cases and refer to 15-minute exposures. OELs are dependent on the chemical composition of the substances in question and a few particle characteristic factors, such as solubility, respirable fraction, and inhalable fraction. Table 5. Summary of selected occupational exposure limits (OELs) proposed by ACGIH.
3.2 ADVERSE HEALTH EFFECTS
Hygienic or occupational problems concerning rail transport are not a new concern. Early studies by Winslow and Kligler (1912), Palmer et al. (1916), and Pincus and Stern (1937) exemplify the long history of such research. However, only in recent years have these issues been considered in detail.
Exposure to diesel exhaust has been classified as likely carcinogenic to humans in EPA, WHO, IARC, and NIOSH cancer guidelines. Lung cancer is reported as the dominant disease by studies of various occupations exposed to diesel exhaust (Bhatia et al., 1998).
Diesel exhaust emissions have also been reported to have non-cancer effects. The EPA reported that “acute exposure to diesel exhaust has been associated with irritation of the eye, nose, and throat, respiratory symptoms (cough and phlegm), and neurophysiological symptoms such as headache, lightheadedness, nausea, vomiting, and numbness or tingling of the extremities” (EPA HAD, 2002). According to this study, neurobehavioral impairment (i.e., of blink relax latency, verbal recall, color vision confusion, and reaction time) was reported for railroad workers and electrical technicians exposed to diesel exhaust. Another study reported a higher incidence of chronic obstructive pulmonary disease (COPD) mortality among locomotive drivers and conductors exposed to diesel exhaust (Hart et al., 2006). Vinzents et al. (2005) also reported that ultrafine particle exposure resulted in DNA damage. No evidence is reported concerning the allergic effects (e.g., asthma and immunologic effects) of diesel exhaust, but there are many reports that diesel exhaust can exacerbate those effects (Zhang et al., 2009; EPA report RIN 2060-AM06, 2008). Another important factor when considering diesel exhaust emissions is soot, which is recognized as a carcinogen by IARC and DFG (IARC, 2010; DFG, 2009).
Currently, no legislation regulates non-exhaust emissions, and most research into such emissions has focused on comparing measured concentration levels with the limit values for outdoor air quality or OEL standards.
Pfeifer et al. (1999) reported that there was more manganese in London commuters’ blood than in taxi drivers’ blood. Crump reported that time spent in Toronto subways was the best predictor of manganese in personal blood samples in his study (Crump, 2000). Chillrud et al. (2004, 2005) studied personal exposures to iron, manganese, and chromium dust among students and workers in New York City (NYC) and found that the NYC subway is the dominant source of these exposures.
The genotoxicity and oxidative stress effects of particles in the Stockholm subway have been compared with similar effects of aboveground particles by Karlsson et al. (2005). They reported that the subway particles were eight times more genotoxic and four times more effective at causing oxidative stress than were aboveground particles. The ability to form intracellular reactive oxygen was suggested as a possible explanation in their further studies (Karlsson et al., 2008). Midander et al. (2009) also reported that nanosized Cu and CuO particles are more genotoxic than micron sized particles. Toxicology test have shown London Underground particles to have a cytotoxic and inflammatory potential at high doses (Hurley, 2003)
Nyström et al. (2010) conducted an experiment by investigating the effects of two-hour exposures in a subway environment on 20 healthy volunteers. According to their results, there was no cellular response in the volunteers’ airways, but marked increases in fibrinogen and in regulatory T-cell expression of CD4/CD25/FOXP3, were observed in the volunteers’ blood. A study of subway workers in NYC investigated several biomarkers, comparing them with the same biomarkers for bus drivers and subway office workers (Grass et al., 2010). DNA–protein cross-linkage and plasma chromium levels were markedly higher in subway workers than in bus drivers. However, no significant differences were observed between the biomarkers of subway workers and subway office workers.
The British Lung Foundation has warned that using the London Underground (LU) might be hazardous because of the particle incidence (Britton, 2003). However, it should be noted that no apparent health problems linked to these kinds of particles have been reported. In fact, some studies contradict the suggested high risk of non-exhaust emissions from rail traffic. In a study by the Institute of Occupational Medicine (Edinburgh) the possible adverse health effects of particles of using the LU were considered (Hurley et al., 2003 and Seaton et al., 2005). A maximum iron oxide exposure of 200 µg m–3 in LU was reported, and compared with the OEL of 5000 µg m–3. The LU level was 25 times lower than the suggested OEL. Considering this and the limited exposure duration of commuters, they concluded that inhalation particles in LU should not be considered a serious problem, although with regard to particle cytotoxic and inflammatory potential at high doses, efforts to reduce their emissions must continue.
Kam et al. (2011a) assessed the PM reactive oxygen species (ROS) activities, from a personal exposure perspective, in an underground station, ground-level station and urban ambient near USC in Los Angles. According to their results, the ROS activity in the underground station was greater than the ROS activity in the ground–level station and urban ambient air by 55% and 65%, respectively.
Recently, some limited cohort studies have been conducted among subway drivers. In Stockholm, the frequency of heart attacks (Bigert, 2007) and lung cancer (Gustavsson, 2008) was investigated among male subway drivers and compared with that of men with other occupations in the Stockholm subway. The frequency of lung cancer or heart attack was not increased among the male subway drivers in these studies.
Mostly adverse health effects of fine particles have been considered. However, in a recent review article, it is reported that short-term adverse effects in the respiratory system from coarse particles are stronger or as strong as of fine particles (Brunekreef and Forsberg, 2005).
3.3 PARTICLE CHARACTERISTICS
Little is actually known about actual absolute particle emission rates from rail vehicles and only few sources addressing actual emission rates was found. Two report data from laboratory
measuremets (Abbasi, 2011 and Abbasi, 2012b) and one discusses emission rates in the Stockholm subway (Johansson, 2005). Other sources address particle concentrations, inherently reflecting emission rates.
In this section, we review several particle characteristics, i.e., mass concentration, elemental composition, size, and morphology. The results for these characteristics are highly dependent on the original sources and test conditions and therefore no unambiguous results should be expected. Exhaust emission particles are dependent on engine load, speed, and technology as well as on the type and elemental composition of the fuel, lubricant, engines, and after-treatment components.
For non-exhaust emissions, rail vehicle operational factors, vehicle technical specifications, rail system infrastructure and power transmission type all influence particle characteristics. Moreover for particle concentrations also ventilation conditions largely determine concentration levels. Furthermore, meteorological conditions, instrument characteristics, and measurement techniques are additional factors that influence the outcome of measurements for both exhaust and non-exhaust emissions (Maricq, 2007; Nieuwenhuijsen et al., 2007; EPA RIN 2060-AM06, 2008; Salma, 2009; Abbasi et al., 2012a).
3.3.1 ELEMENTAL COMPOSITION
According to Lombaert et al. (2004), wear of metal parts in the engine is the main source of Fe and lube oil additives are sources of Ca, Cu, Mg and Zn. Exhaust aftertreatment components are suggested as the sources of particles containing Pt, Pd and Rh (Zereini et al., 2007). In these works, Mo, P, S, and Si are not identified although they exist in the exhaust particles as they can be traced in the lube oil additives, diesel fuels or even aftertreatment components (Maricq, 2007).
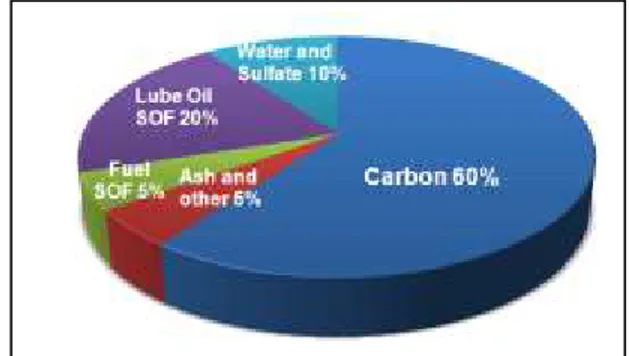
The elemental composition of non-exhaust particles from rail transport was one of the initial issues considered by researchers. One of the oldest surveys, from 1909, considered particle Kittelson investigated the composition of diesel
exhaust particles from a heavy-duty diesel engine and reported a pie chart (Figure 1) of the element composition (Kittelson, 2006; Kittelson, 1998). Carbon composed the main fraction in the diesel exhaust particles. SO2, SO3, and H2O are other
fractions. Ca, Cu, Fe, Mg, Mo, S, Si, P, Pd, Rh, Pt, and Zn are the common detectable elements in the ash of diesel particles.
Figure 1. An example of PM composition of a heavy-duty diesel engine without after-treatment; data from Kittelson (2006).
characteristics in the NYC subway (Anonymous, 1909) and reported that subway dust comprised 60% iron and 20% organic material.
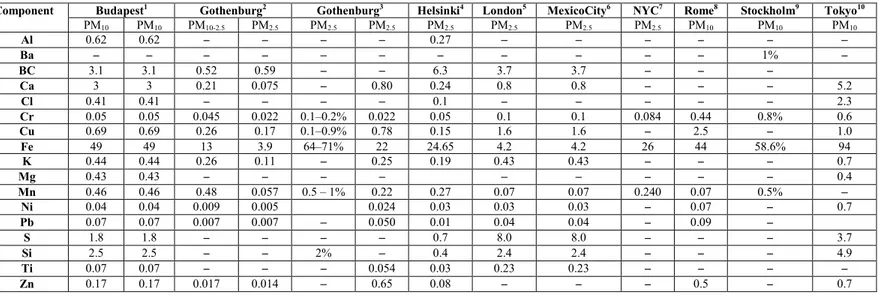
In recent years, a few more detailed investigations have been conducted to determine the elemental compositions of rail traffic particles. These results are summarized in Tables 6 and 7. Table 6 summarizes the findings regarding the composition of particles in underground stations and Table 7 of particles from ground-level rail traffic.
1- Salma et al., 2007 2- Boman et al., 2009 3- Sjöstedt, 2005 4- Aarnio et al., 2005 5- Seaton et al., 2005 6- Nieuwenhuijsen et al., 2007 7- Chillrud et al., 2004 8- Ripanucci et al., 2006 9- Svartengren and Larsson, 2010 10- Furuya et al., 2001
Component Budapest1 Gothenburg2 Gothenburg3 Helsinki4 London5 MexicoCity6 NYC7 Rome8 Stockholm9 Tokyo10
PM10 PM10 PM10-2.5 PM2.5 PM2.5 PM2.5 PM2.5 PM2.5 PM2.5 PM2.5 PM10 PM10 PM10 Al 0.62 0.62 – – – ⎯ 0.27 ⎯ ⎯ – – – ⎯ Ba – – – – ⎯ ⎯ – – – – – 1% – BC 3.1 3.1 0.52 0.59 – ⎯ 6.3 3.7 3.7 – – – Ca 3 3 0.21 0.075 – 0.80 0.24 0.8 0.8 – – – 5.2 Cl 0.41 0.41 – – – ⎯ 0.1 – – – – – 2.3 Cr 0.05 0.05 0.045 0.022 0.1–0.2% 0.022 0.05 0.1 0.1 0.084 0.44 0.8% 0.6 Cu 0.69 0.69 0.26 0.17 0.1–0.9% 0.78 0.15 1.6 1.6 – 2.5 – 1.0 Fe 49 49 13 3.9 64–71% 22 24.65 4.2 4.2 26 44 58.6% 94 K 0.44 0.44 0.26 0.11 – 0.25 0.19 0.43 0.43 – – – 0.7 Mg 0.43 0.43 – – – ⎯ ⎯ ⎯ – – – 0.4 Mn 0.46 0.46 0.48 0.057 0.5 – 1% 0.22 0.27 0.07 0.07 0.240 0.07 0.5% ⎯ Ni 0.04 0.04 0.009 0.005 0.024 0.03 0.03 0.03 – 0.07 – 0.7 Pb 0.07 0.07 0.007 0.007 ⎯ 0.050 0.01 0.04 0.04 – 0.09 – S 1.8 1.8 – – – ⎯ 0.7 8.0 8.0 – – – 3.7 Si 2.5 2.5 – – 2% ⎯ 0.4 2.4 2.4 – – – 4.9 Ti 0.07 0.07 – – – 0.054 0.03 0.23 0.23 – – – – Zn 0.17 0.17 0.017 0.014 ⎯ 0.65 0.08 – – – 0.5 – 0.7
Table 6. Reported elemental compositions of particles in different size fractions in different subways; all values in µg m-3 unless otherwise specified.
* The number concentration of particles containing Si and S is also reported in that paper, but their mass
concentration was not reported.
** All data were reported in (ng m-3) in the original reference .
***The author reported that these elements occurred in greater amounts at the sampling point in the middle of the
axle, while at the other sampling points they were under the detection limit.
Stationary measurement (Lorenzo et al, 2006)
Stationary measurement (Gehrig et al. 2007)
75 % inside trains and 25% on stations (Kam et al, 2011a) **
On-board measurem ent (Fridell et al., 2011) On-board measurement (Abbasi, et al., 2012a)
Sampling 10 m from tracks (PM10,µg m-3 ) Sampling 120 m from tracks (PM10, µg m-3 ) sampling 25 m from tracks (PM10, µg m-3) sampling 25 m from tracks (PM10, µg m-3) (µg m-3 of PM10-2.5) (µg m-3 of PM2.5) µg/filter Sampling point near brake pad
Sampling point in the middle of axle Al 2.443 1.456 0.062 0.075 0.075 0.0617 13 2.6% 6% B – – – – – – 0.32 – – Ba – – – – 0.011 0.184 0.33 0.4% 0.2% Ca 0.648 0.209 0.30 0.40 0.08 0.0742 10 4.9% 6% Cd – – – – 0.00002 0.00013 – – – Co – – – – 0.00005 0.0001 – – – Cr – – 0.006 0.006 0.001 0.0021 1.5 0.7% 0.5% Cu ⎯ – 0.081 0.053 0.0184 0.0375 18 9.9% 8.1% Eu – – – – 0.00001 0.00013 – – – Fe 3.859 0.951 1.76 1.49 0.2671 0.4905 302 64.7% 59% K – – 0.29 0.29 0.036 0.0576 8.4 *** *** Mg – – 0.067 0.077 0.0406 0.0637 8.6 4% 4.9% Mn – – 0.018 0.017 0.026 0.0058 3.2 0.7% 0.7% Mo – – – – 0.0031 0.0063 0.66 <0.5% <0.5% Na – – 0.12 0.12 – – 5.9 1.6% 3.7% Ni – – 0.003 0.003 0.0004 0.0014 1.7 0.7% 0.5% P – – 0.017 0.018 – – – – – Pb – – 0.013 0.012 – – 0.46 <0.5% <0.5% S * * 0.99 1.03 – – – – – Sb – – – – – – 4.6 2.9% 2.6% Si * * – – – – 53 *** *** Sn – – – – – – – <0.5% <0.5% Ti – – – – 0.0065 0.0094 1 <0.5% <0.5% V – – – – – – 0.51 <0.5% <0.5% Zn – – 0.045 0.036 0.0091 0.0239 7.2 3.9% 3%
3.3.2 RECORDED PM10 and PM2.5
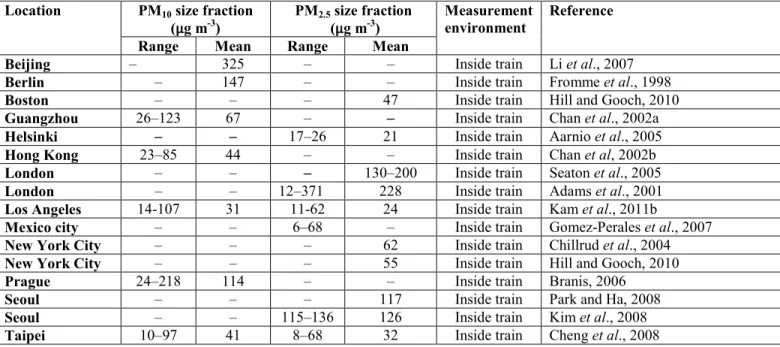
As reported in Tables 2–4, particle mass concentration is one of the main factors considered in current regulations. In this regard, several investigators have recorded the mass concentrations of PM10 and PM2.5 in different railway microenvironments, such as inside trains and on platforms.
Tables 8-10 show summaries of these results.
Comparing the results of Tables 8-10 it is evident that particle concentrations are several times higher at underground platforms than inside underground and ground-level trains.
Location PM10 size fraction
(µg m-3) PM2.5 size fraction (µg m-3) Measurement environment Reference
Range Mean Range Mean
Beijing – 325 – – Inside train Li et al., 2007
Berlin – 147 – – Inside train Fromme et al., 1998
Boston – – – 47 Inside train Hill and Gooch, 2010
Guangzhou 26–123 67 – ⎯ Inside train Chan et al., 2002a
Helsinki ⎯ ⎯ 17–26 21 Inside train Aarnio et al., 2005
Hong Kong 23–85 44 – – Inside train Chan et al, 2002b
London – – ⎯ 130–200 Inside train Seaton et al., 2005
London – – 12–371 228 Inside train Adams et al., 2001
Los Angeles 14-107 31 11-62 24 Inside train Kam et al., 2011b
Mexico city – – 6–68 – Inside train Gomez-Perales et al., 2007
New York City – – – 62 Inside train Chillrud et al., 2004
New York City – – – 55 Inside train Hill and Gooch, 2010
Prague 24–218 114 – – Inside train Branis, 2006
Seoul – – – 117 Inside train Park and Ha, 2008
Seoul – – 115–136 126 Inside train Kim et al., 2008
Taipei 10–97 41 8–68 32 Inside train Cheng et al., 2008
Table 8. Reported ranges and mean values of particle mass concentrations, µg m–3, in different size fractions in various underground systems; measured inside train.
* PM2.0
** Total suspended particulate matter.
Location PM10 size
fraction(µg m–3) PM2.5 size fraction (µg m–3) Measurement environment Reference
Range Mean Range Mean
Budapest 25–232 155 ⎯ 51*
On platform Salma et al., 2007
Buenos Aires ⎯ 152–270** ⎯ ⎯
On platform Murruni et al., 2009
Cairo 974–1094** 938** ⎯ ⎯
In tunnel station Awad, 2002
Gothenburg 30-350 250 30-80 64 Tunnel Sjöstedt, 2005
Helsinki ⎯ ⎯ 23–103 60 On platform Aarnio et al., 2005
London ⎯ 1000–1500 ⎯ 270-480 On platform Seaton et al., 2005
Los Angeles 14-197 78 9-130 57 On platforms Kam et al., 2011 b
Lyon 90-220 55 % of PM10 On platforms Copraly, 2002
Paris ⎯ 230 ⎯ ⎯ Closed station Tokarek, 2006
Paris ⎯ 68 ⎯ ⎯ On platform *** Bachoual et al., 2007
Paris ⎯ 360 ⎯ ⎯ On platform Bachoual et al., 2007
Paris (rush hours) ⎯ 320 ⎯ 93 On platform Raut et al.,2009
Paris (normal hours) ⎯ 200 ⎯ 61 On platform Raut et al., 2009
Prague 10–210 103 ⎯ ⎯ On platform Braniš, 2006
Rennes 47-82 On platforms Air Breizh, 2005
Rome 71–877 407 ⎯ ⎯ On platform Ripanucci et al., 2006
Seoul 359 238-480 82–176 129 On platform Kim et al., 2008
Seoul ⎯ ⎯ ⎯ 105 On platform Park and Ha, 2008
Stockholm 1982 120-460**
On Platforms Johansson, 2001
Stockholm1997 <200-440 On Platforms Johansson, 2001
Stockholm (Subway) 175–542 357 95–303 199 On platform
(Weekdays) Johansson and Johansson, 2003
Stockholm (Subway) 120–414 267 66–230 148 On platform
(Weekends)
Johansson and Johansson, 2003
Stockholm (Subway) 108-256 50-79 under ground
personnel Plato et al., 2006
Stockholm (Arlanda S) 66–110 88 ⎯ ⎯ Tunnel Gustafsson et al., 2006
Stockholm (Arlanda C) 162–312 237 ⎯ ⎯ Tunnel Gustafsson et al., 2006
Taipei 11⎯137 51 7–100 35 On platform Cheng et al., 2008
Taipei 10–104 40 4–60 16 Station concourse Cheng and Lin, 2010
Tokyo 30–120 72 ⎯ ⎯ On platform Furuya et al., 2001
Table 9. Reported ranges and mean values of particle mass concentrations, µg m–3, in different size
* DustTrak PM10, non-smoking section, in train with smoking sections.
3.3.3 PARTICLE SIZE
According to Kittelson (1998, 2006), diesel exhaust particles may occur in a trimodal particle size distribution. The nuclei mode region, which refers to particles 5-50 nm in diameter, includes nearly 90% of the total number of particles. Diluted sulfur compounds, volatile organics, and metal ash are the main sources of such particles. An accumulation mode includes particles 100-300 nm in diameter; the main fraction of the total particle mass belongs to this mode and mainly comprises carbonaceous compounds. Finally, a coarse mode is defined, which includes particles over 1 µm in diameter. These particles are created when accumulation mode particles deposit on the cylinder or exhaust surfaces and then are resuspended. Coarse mode and nuclei mode particles account for 5-20% of the total particle mass (Kittelson, 1998, 2006).
Mohr reported that the primary soot particles from heavy duty diesel engines are 28.5–32.4 nm in diameter. He and his colleagues reported that the diameter of primary soot particles is reduced by increasing the fuel injection pressure, increasing the maximum flame temperature, or advancing the start of injection. Operating exhaust gas recirculation (EGR) increases the diameter of those particles (Mohr et al., 2005).
It should be noted that the use of catalysts in diesel engines can also generate coarse particles containing Pt or Rh. According to Zereini et al. (2001), a combination of vibration and thermal effects causes catalyst wear, and these authors reported catalyst-derived particles > 2 µm in diameter, with the distribution peak at a diameter of approximately 5 µm. Nevertheless, overall,
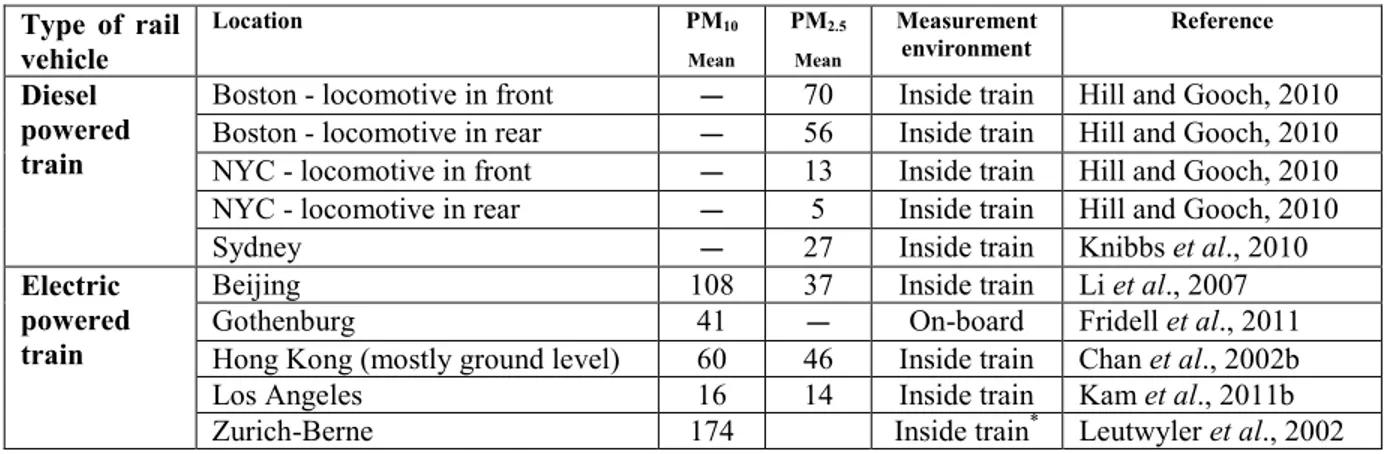
Type of rail vehicle Location PM10 Mean PM2.5 Mean Measurement environment Reference Diesel powered train
Boston - locomotive in front — 70 Inside train Hill and Gooch, 2010
Boston - locomotive in rear — 56 Inside train Hill and Gooch, 2010
NYC - locomotive in front — 13 Inside train Hill and Gooch, 2010
NYC - locomotive in rear — 5 Inside train Hill and Gooch, 2010
Sydney — 27 Inside train Knibbs et al., 2010
Electric powered train
Beijing 108 37 Inside train Li et al., 2007
Gothenburg 41 — On-board Fridell et al., 2011
Hong Kong (mostly ground level) 60 46 Inside train Chan et al., 2002b
Los Angeles 16 14 Inside train Kam et al., 2011b
Zurich-Berne 174 Inside train* Leutwyler et al., 2002
Table 10. Reported ranges and averages of particle mass concentrations, µg m–3, for different size
catalysts significantly reduce particle emissions, and the emission of catalyst particles is negligible (Maricq, 2007).
Recently, a comprehensive field study of exhaust emissions was conducted by the Clean Air Task Force (Hill and Gooch, 2010). They measured the concentrations of UFPs and PM2.5 in the
train car air breathed by commuters riding diesel trains on the Boston–New York route. They investigated the effect of pull-train (diesel locomotive in front), push-train (diesel locomotive in rear), increasing speed, and decreasing speed. The Task Force reported that the average UFP concentration in the train air was 15–20 times higher than in outdoor ambient air for the pull-train configuration, but only 3–5 times higher than in outdoor ambient air for the push-pull-train configuration.
Three particle size regions are also recognized for the non-exhaust emissions from rail vehicles according to field tests in subways or ground-level rail traffic.
The number mode for coarse particles has been reported in the 2–7 µm range (Gustafsson et al., 2006; Lorenzo et al., 2006; Salma, 2009; Abbasi et al., 2012a). The fine region with the highest particle number frequency was in the 250–650 nm diameter range (Seaton et al., 2005; Gustafsson, 2009; Abbasi et al., 2011; Fridell et al., 2011). All these studies agreed that there was a number peak at approximately 350 nm in diameter. Besides this peak, other peaks at 280 nm and 600 nm in diameter were found in laboratory tests by Sundh et al. (2009) and Abbasi et
al. (2012a, b).
Finally, the ultrafine region include particles < 100 nm in diameter. A maximum frequency of fine particles at 60-80 nm in diameter was reported by Norman and Johansson (2005), while laboratory tests generating wear particles recorded a peak particle frequency at approximately 70-100 nm (Sundh et al., 2009; Abbasi et al., 2011). However, other researchers reported finer particle sizes. Salma et al. (2007) reported a dominant fraction of particles 10-50 nm in diameter for PM2, Tokarek et al. (2006) a number peak at 40 nm, while Gustafsson et al. (2006) reported a
dominant fraction of particles 10-20 nm in diameter for Arlanda S and 20–50 nm for Arlanda C. Cheng and Lin (2010) investigated the mass of particles from the Taipei Rapid Transit System according to various size fractions, reporting three peaks for the size fractions of 230-300 nm, 5-7.5 µm, and 10-15 µm.
Ultrafine, a few 100 nm and micrometer sized particles are generated at sheer wear processes and the various size modes ought be attributed to various wear modes (Sundh et al., 2009; Abbasi et
al., 2011). However no study of the detailed generation mechanisms is known to the authors. In
closed environments not only particles directly from wear appear, but also particles from suspension, from people and from supply air.
Ratios PM2.5/PM10 of 30-70 % have, following Table 9, been reported. Lower ratios seem to be
3.3.4 PARTICLE MORPHOLOGY
Particle morphology is another important issue. Particle morphology not only influences the severity of adverse health effects (Madl and Pinkerton, 2009), but also conveys information on factors contributing to particle formation (Lee et al., 2002; Stachowiak et al., 2008).
According to Kittelson (1998) and Maricq (2007), almost all particles from diesel exhaust are spherical before aggregation. Thermal processes such as dilution and condensation explain such spherical shapes (Hinds, 1999). However, these spherical particles can aggregate and form new shapes. Lee et al. (2002) reported that most diesel particles were amorphous in structure under low engine load conditions, whereas they displayed graphite structure under high loads. Lee et
al. (2002) explained these phenomena by the differences in dominant aggregation mechanisms.
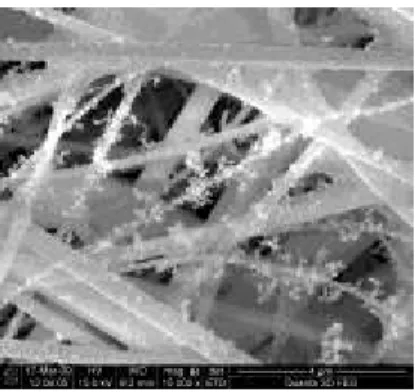
Particles from non-exhaust emissions come in many shapes. Nearly all coarse non-exhaust particles have flake shapes (Salma, 2009; Abbasi et al., 2012a, b; Sundh and Olofsson, 2011), whereas the fine and ultrafine particles are spherical, semi-spherical, or ellipsoidal in shape (Lorenzo et al., 2006; Abbasi et al., 2012a; Sundh and Olofsson, 2011). It is suggested that differences between the dominant wear mechanisms cause the differences in wear particle shape (Stachowiak et al., 2008). This suggestion was confirmed by Abbasi et al. (2012b) in a laboratory study of airborne wear particles.
Figure 2 shows an image of particles from diesel exhaust. Several images of particles collected during on-board measurements from a running train are shown in Figures 3–4. Figures 5–9 show the morphology of particles from wheel-rail contact and braking materials, which were generated in a pin-on-disc machine.
Figure 2. An example of particles morphology from diesel exhaust (Tornehed, 2010).
Figure 3. An example of particles morphology from aboveground rail traffic (Abbasi, 2012a).
Figure 6. An example of particles morphology from organic brake pad and steel brake disc materials in lab testing (Abbasi, 2011).
Figure 7. An example of particles morphology from sintered brake pad and steel brake disc materials in lab testing (Abbasi, 2012b).
Figure 8. An example of particles morphology from organic brake block and railway wheel materials in lab testing (Abbasi, 2012b).
Figure 9. An example of particles morphology from cast iron brake block and railway wheel materials in lab testing (Abbasi, 2012b).
Figure 4. An example of particles morphology from aboveground rail traffic in a field test (Abbasi, 2012a).
Figure 5. An example of particles morphology from a wheel–rail contact in lab testing (Sundh and Olofsson, 2011).
3.4 MITIGATION OF PARTICLE EMISSIONS AND CONCENTRATIONS
The primary approach to reduce particle concentrations and thus exposure is to reduce the emission of particles. This is followed by measures for ventilation of tunnels and enclosures aiming at controlling and limiting concentrations.
As more studies have examined diesel exhaust emissions, more solutions have been suggested. Recently, a number of these were reviewed by Silver (2007). He reviewed the implementation of exhaust after-treatment alternatives to reduce DPM. Options such as diesel oxidation catalysts (DOCs), diesel particle filters (DPFs), continuous regenerative traps (CRTs), selective catalytic reduction systems (SCRs), and combinations of these methods (SCR + CRT, SCR + DPF) were discussed in his work. MECA suggested crank case emission control as another applicable method. According to MECA, this method could reduce DPM emissions to as low as 0.04 g bhp–1 (0.05 g kWh-1) (MECA, 2011). Mohammadi et al. (2003) suggested that high-frequency dielectric barrier discharge plasma may reduce DPM. The effects of fuel-born catalysts (FBCs) in terms of soot reduction were evaluated by Song et al. (2006). Other factors that affect particle emissions from diesel engines, such as the technology used in engine and fuel composition, have been reviewed by Maricq (2007). Recently, electrochemical reduction (ECR) systems were evaluated by Yoshinobu et al. (2010).
A study conducted by UIC, UNIFE, Euromot, and AEA Technology found that SCRs, DPFs, SCR + DPF, and re-engining were the most promising alternatives in terms of benefit-to-cost ratio. (Kollamthodi, 2006). Dreisbach also confirmed that applying SCRs and DPFs are the most applicable solutions to meet PM requirements in Tier 4 for NRMM (2007). Even though these alternatives can decrease particle emissions from diesel engines, they have some intrinsic drawbacks. They increase maintenance cost, capital cost, space requirement, weight, complexity of the system, and they also decrease the reliability and functionality of the diesel engine. In practice, when evaluating these solutions, their effects on emission factors must be weighted in light of technical and economic considerations. These kinds of considerations oblige the manufacturer to use the proper alternatives or even in-house versions of catalysts or filters to meet emission standards, customer’s needs and producibility. For instance, MTU has designed special DPFs which can be used in MTU 4000 series. These DPFs are fitted to be replaced in the space designed for the exhaust silencers in the existing engines. They claim that the new model MTU 4000 R84 can achieve Tier4 or Stage IIIB without using SCR (MTU, 2012). However, the American manufacturers are willing to use other alternatives instead of using DPFs in their railroad engines. Cummins announced that they met Tier 4 in their new QSK series only by using SCR. They also announced that implementing SCR was more efficient than using EGR or variable valve actuation (Dieselnet, 2011). GE is developing non-urea SCR to implement on locomotives (Dieselnet, 2009).
Various methods for reducing wear in the wheel–rail contact have been reviewed by Braghin et
al. (2009). He noted that optimizing the wheel profile and applying friction modifiers on wheels
or rails were successfully implemented and reported by various researchers. Optimizing the bogie design is also another suggested solution. These kinds of optimizations are intended to minimize creep forces and increase running performance. These objectives can be achieved by either reducing primary suspension stiffness (Andersson et al., 2007) or adding new systems, such as active primary suspension (Shen and Goodall, 1997), independent drive wheels (Gretzschel and Bose, 2002), active secondary suspension (Diana et al., 2002), and active wheel steering (Wickens, 1994). However, a series of technical and economic factors must be considered when optimizing or designing a new bogie to address wear problems. For example, using an articulated bogie is an attractive option in freight cars, whereas it is less attractive in passenger cars. On the other hand, the use of mechatronic bogies would be meaningless in freight transport.
Mosleh and Khemet (2006) reported the positive effects of radial grooves on brake discs in terms of reducing wear debris. According to their work, a cast iron disc machined with radial grooves running against a Jurid 539 brake pad produced less wear debris and less recorded friction variation. These interesting results were achieved by testing car braking materials; however, the approach can be considered potentially applicable to railway braking materials as well.
The choice of brake pad materials has implications both for the emission rate of particles (Abbasi
et al., 2012b) and of the substances emitted. Therefore optimal choices of materials may reduce
risks of adverse health effects.
Improvements in the train operating rules are also applicable to reduce particle emission or passenger exposure to particles. As it was investigated by Hill and Gooch, the push-train arrangement for diesel trains will reduce the UFP concentration inside the train. Besides, an increased application of electric brakes diminishes the use of mechanical braking and thus the emission of particles as found by Abbasi (2012a). Particle concentration levels in the Stockholm subway have shown a decreasing trend the last 10-15 years. During this time, the rolling stock has gradually been modernized and the use of friction modifiers has increased. No attempts have been made to identify the factors leading to the decrease.
Ventilation flow-rates and air flow movements resulting from ventilation systems and their control, as well as enclosure and tunnel design and layout profoundly influence particle concentrations. Proper design, control and operation are fundamental and this is not always the case. With proper design, considering the dilution and transport of emitted particles, the particle concentrations may be markedly reduced. A relatively new concept is to use platform screen doors (separating track areas from platforms), originally introduced for personal security reasons, to separate more polluted air from less polluted (Olander, 2009).
Applying a proper filtering system has been suggested and discussed as a method for reducing exposure to particles in enclosed environments. Tokarek and Bernis (2006) investigated the practicality and effect of using an electrostatic precipitator in a Paris subway station. They predicted that the particle concentration could be halved by the application of several electrostatic precipitators.
Particle concentrations inside and outside trains can differ significantly, as shown by results from Helsinki, London, Los Angeles and Taipei (Tables 7 and 8). These differences were explained by the supply air filtration in the ventilation systems installed in the rail vehicles.
Washing to remove deposited particles to inhibit suspension of particles has been suggested as a mitigation measure. However, tests performed have resulted in uninterestingly low or no effects on concentration levels (Johansson, 2003; Gustavsson et al., 2006).
Measures to reduce wear are the most desirable as they both reduce particle emissions as well as wear costs for the operator. Other mitigation measures might involve direct costs and will be less attractive for the operator. Today subway systems may with proper design and control and with modern rolling stock be built for lower particle concentration levels. A number of systems today are old and require high investments and long time periods for reducing concentrations.
4. DISCUSSION AND CONCLUSION
Reported measurements results show a wide spread. This is to be expected since the objects of study are not one well-identified entity, but differing systems. Moreover, various characteristics of different parts of these systems are reported.
For non-exhaust emissions rail vehicle operational factors such as increasing axle load and train speed, as well as an increasing train frequency, increase emissions. Vehicle technical specifications such as axle load, bogie technical specification, wheel and brake materials properties, brake system and braking scheme are all important for emissions. The emissions are also influenced by railway infrastructure conditions such as rail technical specification, rail gauge, track substructure and superstructure, track layout, turnout and power transmission type. Engine type, engine specifications, operating condition, type of lube oil, type of diesel fuel, push-train or pull-train and type of after-treatment system affect the particle emission from exhaust sources. Moreover, for particle concentrations in closed railway environment ventilation flow-rates and flow patterns are critical as well. The actual ventilation arises as a consequence of the interaction of ventilation system design, supply air, enclosure design, tunnel and train design, and climatic conditions. Furthermore, meteorological conditions, instrument specifications and characteristics, and measurement techniques are additional factors that influence the outcome of measurements for both exhaust and non-exhaust emissions (Maricq, 2007; Nieuwenhuijsen et al., 2007; EPA RIN 2060-AM06, 2008; Salma, 2009; Abbasi et al., 2012a). It is very important that
researchers consider all of those effective factors in the future field studies or laboratory tests and report them in their work in order to achieve more repeatable and applicable results.
Various alternatives for reducing particle emissions from rail transport have been discussed. National and international regulations usually prompt manufacturers to pay attention to the particle emissions of their products. This is made clear by comparing the particle emission rates of light passenger cars produced by European, American, and Japanese manufacturers, where a huge reduction in the exhaust emission rates has occurred over the past 20 years.
Nevertheless, existing regulations for rail transport apply only to the exhaust emissions from engines. In all of these regulations, emission amounts are evaluated based on particle mass (i.e., mg) per distance (km) or particle mass (i.e., mg) per engine power (kWh). In rail transport, EU Directive 2004/26/EC (Tier 03 and Tier 04) mandates limiting and reducing the exhaust emissions from locomotives and other diesel rail traction vehicles.
In the field of non-exhaust emissions, few studies have been conducted so only a few relevant regulations can be discussed. However, the phenomenon of non-exhaust emissions is well-known in road transport, where it involves airborne particles from tire, braking materials, and roads. One existing regulation prohibits or limits the use of studded tires, the adverse effects of which on health and PM10 are documented by Dahl et al. (2006), Lindbom et al. (2007) and
Gustafsson et al. (2009). Such results justify banning or limiting the use of studded tires. For example, the use of studded tires is prohibited in Japan, the UK, Germany, Bulgaria, Croatia, the Czech Republic, Hungary, Netherlands, Poland, Slovenia, Slovakia, Romania, Portugal, and 10 states in the USA (Götzfried, 2008). There are also seasonal restrictions in Austria, Switzerland, Sweden, Norway, and most US states. Recently, various findings regarding emissions from tires, braking material, and road surfaces were reviewed in the EMEP/CORINAIR Guidebook (Ntziachristos and Boulter, 2009). The total particle fractions are expressed in mg km–1 according to testing conditions defined for specific vehicles.
There is lack of a similar methodology for non-exhaust emissions from rail transport. Abbasi et
al. (2012b) suggested a method for measuring the airborne wear particle emission rate (AWPER)
from wheel-rail contacts and braking materials. This method can be used by manufacturers to demonstrate the competitive advantage of their products. It was suggested that this method be used by governmental organizations to force manufacturers to consider the wear particle emission rates of their products and to optimize their products in accordance with the proposed regulations so as to minimize related emissions.
It must be noted that particle emission from rail transport has been much less studied than from road transport. The progress of legislation, toxicity studies or even mitigation alternatives in road transport can be used as a basis for future studies of rail transport emission. For instance, WearTox , an ongoing project by the Swedish National Road and Transport Research Institute (VTI), is focusing on the toxicity of car brake pad particles and three pavement particles (Vti,
2011). Similar studies to investigate the toxicity of braking materials particles or wheel-rail particles will shed light in this context.
Another strategy for reducing non-exhaust emissions would be to impose a non-exhaust emission tax. This would encourage train operators or railcars owners to retrofit or replace bogies of poor steering performance, or materials with high AWPER values. Consequently, the particle emission rate from non-exhaust sources would be lowered.
According to Tables 6 and 7, iron is the all-pervading element identified in the reviewed studies. Some of the studies considered the characteristics of iron to be the main source of underground particle adverse health effects (Seaton et al., 2005). However, if we compare the Mn/Fe, Cu/Fe, and Cr/Fe from Tables 7 and 8 with the predetermined OELs for these materials in Table 5, we understand that the risks caused by those non-ferrous materials are markedly higher than that of iron, particularly on subway platforms.
Furthermore, the concentrations of these elements can be increased by supply ventilation flow originating from environments with heavy road traffic or from other pollutant sources. For example, Boudia et al. (2006) reported how the MMT content of road vehicle fuel can affect manganese concentrations in subways. They measured the respirable fraction and total concentration of Mn in three stations in Montreal, Canada, over two weeks. They found that the Mn concentrations in the stations correlated with those in the environments of the stations, but found no correlation between subway traffic and Mn concentrations.
Meanwhile, the amounts of Ca, Si, Al, and Na reported in Tables 6 and 7 are also considerable. So instead of focusing on the concentrations of single elements, the combined adverse health effects of elements such as Fe, Cu, Cr, Mn, Na, Al, Si, and Ca as well as soot should be considered.
Moreover, adverse health effects of particles from rail vehicles on either more sensitive people, such as children and people with pre-existing respiratory problems (Tager, 2005; Knibbs et al., 2011) or diabetes (Golhd, 2008) or people with high occupational exposed to particles such as wheel lathe operators, underground track maintenance staff and drivers, must be studied in depth. The particles shape feature is a multi-faceted issue of interest to many researchers. Physicist and chemists are interested in this issue since almost all of known forces in the nature are formulated based on surface, volume or even shape of the objects. Physicians have discovered that particles toxicity, and their adverse health effect are related to particles size, shape and surface textures (Oberdörster 2005). Investigating particle morphology is also popular among tribologists and condition monitoring experts as it assist them to identify wear mechanisms and recognize the worn objects respectively. Recently, Stachowiak et al. (2008) introduced an approach to evaluate different wear mechanisms based on shape features and surface texture of wear particles.
However, there is lack of an automated system to classify particles based on their surface texture and shape features. Adding this automatic analyzing system to the current high resolution microscopes and applying it in studying non-exhaust emission in rail traffic will lead to a good basis for identifying effective forces involving particle generation and studying particle toxicity and their adverse health effects.
Actually, most studies of the adverse health effects of UFPs focus on diesel exhaust. However, the laboratory results presented by Sundh et al. (2009), Abbasi et al. (2011, 2012b, 2013), and Olofsson (2010) indicate that UFPs are also generated by wear processes involving rail, wheel, and braking materials. They reported that the particle concentration in coarse, fine and ultrafine regions are dependent on the contact conditions of mating surfaces (i.e sliding velocity, contact pressure, temperature lubricant and material properties). Jansson et al. (2010) also commented on the traditional view that associates only particles >1 µm with wear processes, ignoring the role of wear process in generating submicron and ultrafine particles. Even though, airbone particles from wear process are linked to the material loss and there are applicable models to predict material loss due to wear process with good accuracy, no model is known to the authors to predict the particle concentration based on the contact conditions. Studies to develop models are urgently needed and probably necessitate more holistic studies of cause-and-effect of generation of airbone particles from wear processes. Such models could be used as powerful tools to evaluate different alternatives to mitigate non-exhaust emission. Besides, more studies are needed to investigate the adverse health effect of UFPs from different non-exhaust sources res in rail traffic.
Knibbs reported number concentration of UFPs of 9×10⁴ particles cm–3 inside train cars with diesel-powered trains and 3×10⁴ particles cm–3 for electric-powered trains (2011). However, the ambient air UFP concentrations were not reported. As expected, the concentration was lower for electric-powered trains, though still high. Madl and Pinkerton (2009) identified more than 30 different particle characteristics and exposure factors to be used in evaluating the health effects of particles. Particle mass, one of the characteristics, is clearly focused upon in regulations and research as is evident in tables 2-5 and 8-10. In contrast, other particle characteristic factors, such as size, shape, number, and composition, have been poorly investigated and consequently hardly addressed in current regulations.
Two general conclusions are that concentrations at open ground-level stations are to a small extent affected by rail traffic and that concentrations in underground or enclosed station can reach levels several times higher than in ambient air and therefore, is a cause for concern. No specific data on adverse health effects of rail traffic are reported, however, some toxic effects of rail traffic dust have been found.
The possible toxicity of non-exhaust particle emission and high concentration levels in enclosed rail traffic environments are together a cause for concern and from a precautionary principle concentration, levels should be lowered. The development of efficient and proactive countermeasures calls for further studies of particle characteristics, generation mechanisms, and exposure factors, particularly by focusing on non-exhaust emissions from rail transport.
References
Abbasi, S., Olander, S., Olofsson, U., Wahlström, K., Larsson, C., Sellgren, U., 2011. A study of airborne wear particles generated from organic railway brake pads and brake discs. Wear, 273, 93–99
Abbasi, S., Jansson, A., Olander, L., Olofsson, U., Larsson, C., Sellgren, U., 2012a. A field test study of airborne wear particles from a running regional train. Journal of Rail and Rapid Transit, 226 (1), 95–109
Abbasi, S., Jansson, A.,Olander, L., Olofsson, U., Sellgren, U., 2012b. A pin-on-disc study of the rate of airborne wear particle emissions from railway braking materials. Wear, 284–285, 18–29. Abbasi, S., Olofsson, U., Zhu, Y., Sellgren, U., 2013, Pin-on-disc study of the effects of railway friction modifiers on airborne wear particles from wheel–rail contacts. , Tribology International, 60, 136–139 (Online access 2012).
Aarnio, P., Yli-Tuomi, T., Kousa, A., Mäkelä T., Hirsikko, A., Hämeri, K., Päisänen, M., Hillamo, R., Koskentalo, T., Jantunen, M., 2005. The concentrations and composition of and exposure to fine particles (PM2.5) in the Helsinki subway system. Atmospheric Environment 39, 5059–5066.
Adams, H.S., Nieuwenhuijsen, M.J., Colvile, R.N., McMullen, M.A.S., Khandelwal, P., 2001. Fine Particle (PM2.5) Personal exposure levels in transport microenvironments, London, UK. Science of the Total Environment 279, 29–44.
Air Breizh, 2005. Etude de la qualité de l’air dans le metro rennais (A study of the air quality in the Rennes underground, in French). Air Breizh, Rennes, 30 p.
Andersson, E., Berg, M., Stichel, S., 2007. Rail Vehicle Dynamics. Division of Rail Vehicles, Department of Aeronautical and Vehicle Engineering, KTH, Stockholm.
Anonymous, 1909. Hygienische Forderungen für Untergrundbahnen. Internationale Wochenschrift für Wissenschaft, Kunst und Technik 38, 1205–1208 (in German).
Awad, A.H.A., 2002. Environmental study in subway metro stations in Cairo, Egypt. Journal of Occupational Health 44, 112–118.
Bachoual, R., Boczkowski, J., Goven, D., Amara, N., Tabet, L., On, D., Leçon-Malas, V. R., Aubier, M. & Lanone, S. (2007) Biological Effects of Particles from the Paris Subway System. Chemical Research in Toxicology, 20, 1426–1433.
Braghin, F., Bruni, S., and Lewis, R., (2009). Railway wheel wear, in: R. Lewis, U. Olofsson (Eds.), Wheel–Rail Interface Handbook, CRC Press, USA, 2009, pp. 172–210.
Bhatia, R., Lopipero, P., Smith, A., 1998. Diesel exposure and lung cancer. Epidemiology 9(1), 84–91.
Bigert, C., Klerdal, K., Hammar, N., Gustavsson, P., 2007. Myocardial infarction in Swedish subway drivers. Scandinavian Journal of Work, Environment & Health, 33(44), 267–271. Boman, J., Carvalho, M.L., Alizadeh, M.B., Rezaievara, P., Wagnera, A., 2009. Elemental content of aerosol particles in an underground tram station. X–Ray Spectrometry 38, 322–326. Bönnen, N., 2009. NRMM Directive: Introduction of flexibility for rail applications, UNIFE. Available at http://www.unife.org/uploads/090708_UNIFE_on_NRMM_flexibility_–
_final%281%29.pdf (accessed 21 February 2012).
Braniš, M., 2006. The contribution of ambient sources to particulate pollution in spaces and trains of the Prague underground transport system. Atmospheric Environment 40, 348–356. Britton, M., 2003. Lifestyle and Your Lungs. Lung Report III. British Lung Foundation, London. Boudia, N., Halley, R., Kennedy, G., Lambert, J., Gareau, L., Zayed, J., 2006. Manganese
concentrations in the air of the Montreal (Canada) subway in relation to surface automobile traffic density. Science of the Total Environment, 366, 143–147.
Chan, L.Y., Lau, W.L., Lee, S.C., Chan, C.Y., 2002a. Commuter exposure to particulate matter in public transportation modes in Hong Kong. Atmospheric Environment 36, 3363–3373. Boudia, N., Halley, R., Kennedy, G., Lambert, J., Gareau, L., Zayed, J., 2006. Manganese concentrations in the air of the Montreal (Canada) subway in relation to surface automobile traffic density. Science of the Total Environment, 366, 143–147.
Chan, L.Y., Lau, W.L., Zou, S.C., Cao, Z.X., Lai, S.C., 2002b. Exposure level of carbon
monoxide and respirable suspended particulate in public transportation modes while commuting in urban area of Guangzhou, China. Atmospheric Environment 36, 5831–5840.
Cheng, Y.H., Lin, Y.L., Liu, C.C., 2008. Levels of PM10 and PM2.5 in Taipei Rapid Transit
System. Atmospheric Environment 42, 7242–7249.
Cheng, Y.H, Lin, Y.L., 2010. Measurement of particle mass concentrations and size distributions in an underground station. Aerosol and Air Quality Research, 10, 22–29.