ASSESSMENT OF LARGE-SCALE
ENERGY STORAGE FOR
GRID-CONNECTED SOLAR PARKS IN
NAMIBIA
JOAKIM FRISK
ADRIAN ÖHRSTRÖM
The School of Business, Society and Engineerning Course: Examensarbete
Course code: ERA400 Subject: Energy Engineering
Supervisor: Javier Campillo Examiner: Jinyue Yan
External partner: Abraham Hangula, Namibia Energy Institute
ABSTRACT
The aim of this thesis is to investigate the impact and feasibility of implementing large scale energy storage systems for the purpose of energy shifting at grid connected solar parks in Namibia. The country, which receives a large amount of solar irradiance, is ideal for the construction of solar parks. However, as solar parks are an intermittent energy source, energy storage systems are becoming an increasingly attractive option in order to decrease losses and secure the supply of electricity. For this purpose, a model in Matlab was created to simulate different storage types. The input data was simulated with site-specific information for Windhoek in PVsyst and then evaluated in an economic analysis where electricity tariff pricing, battery investment costs and exchange rates were the main variables.
This report is structured through starting with an introduction where the background of the Namibian electricity market and essential terms are presented. This is followed by a detailed description of the Matlab model construction and a literature review of battery types and storage systems. The simulation models and results are then evaluated both from an economical and technical perspective and the main findings are presented.
Through this project, it was concluded that energy storage is not feasible today with current market conditions. Even with favorable electricity tariffs and Namibian exchange rates, storage technologies are currently too expensive today in order for it to be economically defensible. The forecast is however promising, where decreasing investment prices and an increased of R&D in the technology is expected. From the constructed model, it was however concluded that sodium-sulfur is by far the best option today. The reason for this is the low initial cost and relatively high round-trip efficiency of the technology. The model also proved the potential of increased electricity security from using energy shifting. With energy storage, the delivered energy from solar parks now coincide better with the demand since the
intermittency is decreased. However, for future studies a detailed analysis of energy storage effects on the grid is recommended.
ii
PREFACE
This thesis work has been conducted during the spring semester of 2016 at Mälardalen University. The thesis was done in cooperation with the Namibian Energy Institue in
Windhoek, Namibia, where 8 weeks of the semester was spent. We want to thank everyone at the Namibia Energy Institute that were more than willing to help us with all our questions and issues we had while we were in Namibia. Furthermore, we would like to thank everyone that has contributed to the completion of this work. There are some individuals that have been extra involved in our project that we would like to express our gratitude towards:
First of all, we want to thank Patrik Klintenberg, who was the one that suggested that we could do our thesis in Namibia and provided the first contact with the Namibia Energy Institute. He has also helped us with all logistics and administrative issues we had to deal with before leaving for Namibia.
We would like to thank Mr. Abraham Hangula, our supervisor at the Namibian Energy Institute. Without his help and his commitment, this work could never have been completed. He helped us to set up meetings and even drove us across the country so that we could participate in meetings.
Furthermore, we would like to our supervisor at Mälardalen University, Javier Campillo. His technical knowledge of solar power and batteries has been of great value. His guidance, and our meetings with him, has helped us stay on track and kept us to our time schedule.
We would like to thank the Gustav Dahl foundation for the scholarship that we received and finally, we want to thank our family and friends that has supported us throughout this work.
SUMMARY
This thesis; ”Assessment of large scale energy storage for grid connected solar parks in Namibia”, was done at Mälardalen University in collaboration with the Namibian Energy Institute. The purpose this thesis was to investigate the potential of energy storage in connection to the solar parks in Namibia.
Namibia is a country located in southwestern Africa where less than 50 % of the population has accesses to electricity. Furthermore, the country imports more than 60 % of their electricity form their neighboring country South Africa. Namibia, which receives a large amount of solar irradiance, is ideal for solar power. As a way to increase domestic electricity generation, a couple of large-scale grid-connected solar parks have recently been constructed, and several more are planned. However, as solar power is an intermittent energy source, energy storage systems are becoming an increasingly attractive option in order to decrease losses and secure the supply of electricity.
Therefore, this thesis has looked at the possibility to use chemical batteries in order to store the electricity generated by the PV cells at the parks. A literature review was done in order to choose storage strategy and battery types to include in the simulations. It was decided that a model for energy shifting optimization would be developed in order to see if energy could be shifted to times of peak tariff prices, and by doing so, if the potential profit from the energy shifting could help pay for the batteries. Five different battery technologies were chosen and tested in the code in order to find the best technology for the intended application.
The model was developed in the numerical computing environment Matlab and the input data for the power production at the parks were obtained from simulations in the program PVsyst using site-specific data. Flow charts of the modeling steps were created to illustrate the function of the code. An economic analysis was included in the model where several market scenarios (varying battery price, tariff price and exchange rate) were tested for different storage sizes. Simulations for future market scenarios were also done.
Through this project, it was concluded that energy storage is not feasible with current market conditions. Even if the electricity tariffs and Namibian exchange rates became more
favorable, storage technologies would still be too expensive today in order for it be
economically defensible. The forecast is, however, promising where decreasing investment prices and an increased efficiency of batteries are expected. From the developed model it was concluded that sodium-sulfur is by far the best option today. The reason for this is the low initial cost and relatively high round-trip efficiency of the technology. In the future, however, lithium-ion is projected to be the best choice of technology as prices are expected to drop to almost 1/3 of today’s prices by 2020. The model also proved the potential of increased
electricity security from using energy shifting. With energy storage, the delivered energy from solar parks now coincide better with the demand since the intermittency is decreased.
CONTENT
1 INTRODUCTION ...7
1.1 Background ... 7
1.2 Namibia vision 2030 ... 7
1.3 Energy sector of Namibia and solar energy applications ... 8
1.4 Omaruru Solar Photovoltaic Parks ...10
1.5 Otjiwarongo Solar Photovoltaic Park ...11
1.6 Photovoltaic systems ...11
1.6.1 Photovoltaic thin film cells used at Omburu and Otjiwarongo ...11
1.6.2 Axis tracking ...11
1.6.3 Inverters ...12
1.7 Electricity market ...12
1.7.1 Net metering ...12
1.7.2 Feed in Tariff ...13
1.7.3 Power purchase agreement (PPA) ...14
1.7.4 Time-of-use tariffs ...15
1.7.5 Time-of-use tariffs in Namibia ...16
1.8 Scope and limitations ...17
1.9 Problem definition ...18
1.10 Hypothesis ...18
2 LITERATURE REVIEW ... 19
2.1 Electric power systems ...19
2.1.1 Generation ...19 2.1.2 Transmission vs distribution ...19 2.1.3 Grid Stability ...20 2.2 Energy storage ...20 2.3 Battery review ...21 2.3.1 Lead-acid ...21 2.3.2 Lithium-ion ...22 2.3.3 Nickel-cadmium ...22 2.3.4 Sodium-sulfur ...22 2.3.5 Flow batteries ...23
2.3.5.2 Zinc–bromine battery ... 24
2.3.6 Technical specifications ...24
2.4 Energy storage for large scale photovoltaic systems ...25
2.5 Energy storage operation strategies ...26
2.5.1 Capacity firming ...26
2.5.2 Baseload operation ...27
2.5.3 Energy shifting ...28
3 METHOD AND MATERIALS ... 28
3.1 Method ...28
3.1.1 Literature study ...29
3.1.2 Electricity market analysis ...29
3.1.3 Battery review ...29
3.1.4 Field study / data collection ...29
3.1.5 Simulation ...29 3.1.6 Financial feasibility ...30 3.2 Materials ...30 3.2.1 PVsyst ...30 3.2.2 Matlab ...30 4 MATLAB MODEL ... 30 4.1 Model Input ...30
4.2 Battery capacity and lifetime ...31
4.2.1 Cycles and decrease of total energy capacity ...31
4.2.2 Round-trip efficiency ...32
4.3 Model construction ...32
4.3.1 Energy storage function ...33
4.3.2 Tariff prices ...34
4.4 Economic evaluation ...35
5 RESULTS AND DISCUSSION ... 37
5.1 Pvsyst ...37
5.2.5 Future scenarios ...48
5.2.5.1 Ideal scenario ... 48
5.2.5.2 Exchange rate ... 49
5.2.6 Battery cycles ...51
5.2.7 Power Grid in Namibia ...52
6 CONCLUSIONS ... 55
FIGURES AND TABLES
Figure 1- Namibia’s total primary and secondary energy use in GWh (von Oertzen, 2015) ... 8
Figure 2 - Irradiation map of Namibia showing the sum of the average annual irradiance (GeoModel Solar, 2011). ... 9
Figure 3 – Energy demand for a typical day in Namibia (emCON, 2012). ... 10
Figure 4 – Chart describing energy load of a prosumer with solar power production compared to bought and sold electricity (Wikimedia commons, 2013) ... 13
Figure 5 – Chart describing energy load of a prosumer with solar power production compared to bought and sold electricity with net metering installed (Wikimedia commons, 2013). ... 13
Figure 6 – Picture showing the electricity supply structure Namibia (emCON, 2012). ... 15
Figure 7 – Time-of-use tariffs in Namibia for peak, standard and off peak demand. The upper rows show tariffs for the low demand season (May-September), and the lower rows show the tariffs for high demand season (June-August) (Nampower, 2015)...16
Figure 8 – Time-of-use tariffs hours in Namibia for both low (upper rows) and high (lower rows) demand season (Nampower, 2015). ... 17
Figure 9 - Map of transmission network in Namibia including the location of substations and projected lines (NamPower, 2013). ... 20
Figure 10 - Matrix of energy storage appliances in relation to discharge frequency and duration (Carnegie, Gotham, Nderitu, & Preckel, 2013) ... 26
Figure 11– Example of operating the battery for capacity firming (Marinopoulos & Bakas, 2015)... 27
Figure 12 - Baseload operation examples for different time periods using ES (Marinopoulos & Bakas, 2015). ... 27
Figure 13 – Example of using ES for energy shifting including a blue line showing the electricity price during 24h (Marinopoulos & Bakas, 2015). ... 28
Figure 14 - Example of decrease of total battery capacity of a lithium-ion system due to number of cycles. ... 32
Figure 15 - Flowchart of general system model in Matlab. ... 33
Figure 16 - Flowchart of battery storage and sell functions in Matlab. ... 34
Figure 17 – Exchange rate NAD to USD for the past five years (XE, 2016). ... 35
Figure 18 – Predicted exchange rate in the coming year and in 2020 (Trading Ecomomics, 2016). ... 36
Figure 19 – Lowest current and lowest projected battery prices in USD/kWh for utility-scale applications for 2014, 2017 and 2020 (Carnegie, Gotham, Nderitu, & Preckel, 2013) ... 36
Figure 20- Monthly data from the PVsyst simulations including irradiation, ambient temperature and electricity injected into the grid. ... 37
Figure 21 – Hourly production for each month for the solar park in MWh. ... 38
Figure 24 – Graph displaying production for one day (kWh, dark green), sold energy (kWh, blue), tariff price (adjusted to fit the graph, purple), battery charge/discharge (kW, yellow) and stored energy (kWh, light green). ... 40 Figure 25 – Graph showing the value of the shifted energy using different battery
technologies with sizes 0-30MWh and optimal tariffs. ...41 Figure 26 – Potential revenue for the different battery technologies in optimal conditions
with sizes of 1-15 MW. ... 42 Figure 27 – Economic evaluation of Lithium-ion batteries of sizes 1-15 MW with variable
exchange rate and variable prices per kWh. The x-axis represent the number of possible combinations of size, exchange rate, and price. ... 43 Figure 28 - Economic evaluation of Zinc-bromide batteries of sizes 1-15 MW with variable
exchange rate and variable prices per kWh. The x-axis represent the number of possible combinations of size, exchange rate, and price. ... 43 Figure 29 - Economic evaluation of Advance lead-acid batteries of sizes 1-15 MW with
variable exchange rate and variable prices per kWh. The x-axis represent the
number of possible combinations of size, exchange rate, and price. ... 44 Figure 30 - Economic evaluation of Sodium-sulfur batteries of sizes 1-15 MW with variable
exchange rate and variable prices per kWh. The x-axis represent the number of possible combinations of size, exchange rate, and price. ... 44 Figure 31 - Economic evaluation of Vanadium redox batteries of sizes 1-15 MW with variable
exchange rate and variable prices per kWh. The x-axis represent the number of possible combinations of size, exchange rate, and price. ... 45 Figure 32 – Revenue for Lithium-ion batteries depending on tariffs at mid-price and current
exchange rate. ... 46 Figure 33 - Revenue for Zinc-bromide batteries depending on tariffs at mid-price and current exchange rate. ... 46 Figure 34 - Revenue for advanced lead-acid batteries depending on tariffs at mid-price and
current exchange rate. ... 47 Figure 35 - Revenue for sodium-sulfur batteries depending on tariffs at mid-price and
current exchange rate. ... 47 Figure 36 - Revenue for Vanadium redox batteries depending on tariffs at mid-price and
current exchange rate. ... 48 Figure 37 – Potential revenue in 2020 if the dream scenario comes true. ... 49 Figure 38 - Revenue in N$ for predicted lowest battery price at 2020 with current exchange
rate and high demand tariff. ... 50 Figure 39 - Revenue in N$ for predicted lowest battery price at 2020 with current exchange
rate and high demand tariff. ... 50 Figure 40 - Revenue in N$ for predicted lowest battery price at 2020 with current exchange
rate and high demand tariff. ... 51 Figure 41 - Battery cycles for storage sizes from 1 to 15 MW. ... 52 Figure 42 – A typical week of solar power injected to the grid without storage. ... 53 Figure 43 – A typical week of power injected to the grid with storage (15 MW lithium-ion
batteries). ... 53 Figure 44 - A typical week of power injected to the grid with (red line) and without (blue line)
Figure 45 – One year of power injected to the grid without storage. ... 54 Figure 46 - One year of power injected to the grid with storage (15 MW lithium-ion batteries).
... 55
Table 1 – Battery data for the batteries used in the simulation (Carnegie, Gotham, Nderitu, & Preckel, 2013). ... 25 Table 2 - Tariff prices used in the simulations. ... 35 Table 3 - Lowest current and lowest projected battery prices in USD/kWh for utility-scale
applications for 2014, 2017 and 2020 (Carnegie, Gotham, Nderitu, & Preckel, 2013) ... 36 Table 4 – Number of battery cycles for storage sizes from 1 to 15 MW. ... 51
TERMS AND ABBREVIATIONS
AC Alternating Current
A-LA Advanced lead-acid
CENORED Central North Reginal Electricity Distributer
DC Direct Current
FIT Feed-In Tariff
IPP Independent Power Producers
Li-ion Lithium-ion
NAD Namibian Dollars
NAS Sodium-sulfur
O&M Operation and Maintenance
PPA Power Purchase Agreement
PV Photovoltaic
R&D Research and Development
RED Regional Electricity Distributer
REEE Renewable Energy Energy Efficient
REFIT Renewable Energy Feed-In Tariff
SOC State of Charge
TOU Time-of-Use
USD US dollars
VBR Vanadium Redox Battery
1 INTRODUCTION
In this chapter, the theoretical background, the literature study and the scope and limitations are presented.
1.1 Background
The world today is facing several challenges. Over population, climate change and poverty are only a few of the global issues that countries all over the world are struggling with. The Nexus perspective is built on the concept that food, water and energy are interlinked in terms of trade-offs and synergies. In order to mitigate climate change and provide energy security for all, governments must promote the use of renewable energy and reduce their dependency of fossil fuels. Additionally, access to energy facilitates economic growth and reduces poverty (von Oertzen, 2015).
While the earth’s population increase is slowing down, Africa’s population growth is still high. The population is projected to double before 2050 to reach 2.4 billion. This will put even more pressure on governments to deal with the challenges mentioned above. Countries need to find ways to provide their growing populations with food, water and energy and be able to do so in a sustainable way (Bish, 2016).
Namibia is located in southwestern Africa. Like other countries in sub-Saharan Africa, access to energy and energy security are major challenges at the top of the country’s agenda. Namibia has access to abundant resources for the use of renewable energy, such as solar, wind and biomass. It is one of the countries in the world that receives the most hours of sunshine each year. However, despite these resources, Namibia still imports more than 60% of their electricity from their neighboring country South Africa. As energy demand and in particular electricity demand is projected to increase in the future, this foreign dependency becomes a big challenge for Namibia’s energy security (von Oertzen, 2015).
According to The World Bank (2015), an estimated 47.3% of the population in Namibia has access to electricity where urban households account for the largest amount of connections and energy usage. These numbers show that there is a great potential for improvement in both infrastructure development and power generation. One way of increasing the power generation within the country could be to implement large scale solar parks and potentially use energy storage as a way of handling the intermittent nature of the solar cells.
1.2 Namibia vision 2030
In order to fight poverty and promote economic growth within the country, decision makers should find ways to promote local and sustainable energy businesses that will create jobs and reduce the dependency of imports from South Africa.
The Namibia vision 2030 protocol was launched back in 2004 after an analysis and identification process of the problems facing the nation of Namibia (The Villager, 2011). After the analysis, a number of issues were identified ranging from social welfare, macro-economic issues, to problems that involve population, development and health. These issues, together with a compilation of the aspirations expressed by the people of Namibia were used to formulate the following vison:
“A prosperous and industrialized Namibia, developed by her human resources, enjoying peace, harmony and political stability” (Government of Namibia, 2004).
In other words, the goal of the vision was to improve the overall quality of life of all the people in Namibia to a level that matches the one of developed countries. As one of the basic requirements, energy accessibility plays an important role in reaching the set goals (Government of Namibia, 2004).
1.3 Energy sector of Namibia and solar energy applications
Namibia’s primary energy sources come from liquid fossil fuels, biomass and coal. These energy sources are used for cooking and heating whereas electricity is a secondary source of energy which only 47.3% of the population in Namibia has access to (The World bank, 2015). Figure 1 shows the distribution of energy sources in Namibia between 2004 and 2013 where domestic electricity production only accounts for a small part of the Namibian energy sector.
Figure 1- Namibia’s total primary and secondary energy use in GWh (von Oertzen, 2015) NamPower is the main power utility company in Namibia and deals with generation, transmission and energy trading within the southern Africa region. NamPower operates the following four power stations for domestic electricity generation in Namibia:
1. Ruacana 240 MW hydroelectric power station 2. Van eck 120 MW coal fired thermal power plant
An additional power plant known as the Kudu gas project is currently under development. The power plant is expected to supply the southern region of Namibia with 800 MW at the beginning 2019. There are, however, some concerns that the project will not be completed due to high costs. If realized though, it will have a large impact on the region and will be able to export between 100 and 300 MW of electricity to South Africa and up to 300 MW to the Zambia Copperbelt mining corporation (Wendell, 2015).
Traditionally, almost all of the power produced in the country has come from the national electricity utility NamPower. However, in the last couple of years independent power producers (IPP) as well as private actors have been allowed to supply and sell electricity to the grid through arranged power purchase agreements (PPA) (von Oertzen, 2015)
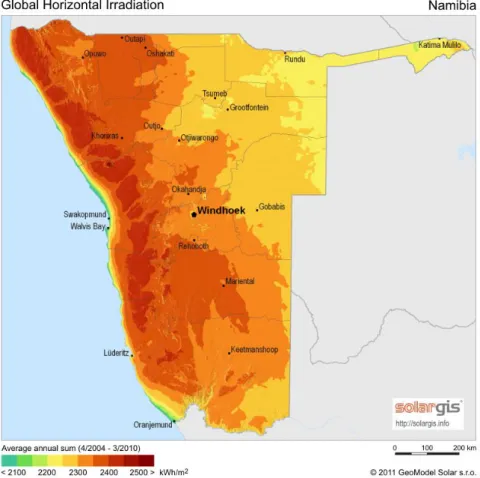
As a country with a high amount of solar hours and irradiation, Namibia is ideal for photovoltaic production (von Oertzen, 2015). The irradiance map seen in Figure 2 show the sum of the average annual irradiance in Namibia. In the last year, one solar park in Otjiwarongo and another one in Omaruru has been built and put into operation. According to the IPP responsible for these two parks, several other solar parks are planned to be built in Namibia in the near future.
Figure 2 - Irradiation map of Namibia showing the sum of the average annual irradiance (GeoModel Solar, 2011).
The purpose of the PV parks are to help ensure the delivery of electricity to surrounding areas. The demand in Namibia varies during the day with peaks in the morning and at night. Figure 3 show the demand for a normal day in Namibia.
Figure 3 – Energy demand for a typical day in Namibia (emCON, 2012).
1.4 Omaruru Solar Photovoltaic Parks
InnoSun is responsible for a couple of solar parks in the Omaruru area. A project under development is the Omaruru Solar Photovoltaic Park. Near this location, a 4.5 MWp solar photovoltaic park named Omburu has already been constructed by the company. The new solar park will have the same peak power capacity as the previously constructed park. Both solar parks will supply 4.5 MWp each to the Omburu transmission substation through 22 kV connections. The Omburu Park uses thin film solar modules and has 100 transformerless inverters installed of the type Delta RPI M50As (Delta, 2015). Through using transformerless inverters, maintenance costs are reduced and the DC is directly converted to standard frequency AC through a computerized multi-step process (Civic Solar, 2011). The off taker of the electricity produced at the park is the national utility Nampower whom buys their power from Innosun in accordance to a PPA (Mutota, 2016).
1.5 Otjiwarongo Solar Photovoltaic Park
The 5 MWp solar park in Otijwarongo was constructed by the company HopSol and
commissioned in November, 2015. The plant uses 35000 thin film modules and uses single axis tracking. The park is expected to produce approximately 13.5 million kWh annually to supply electricity to 2500 residential houses (HopSol, 2016).
The off taker of the park is the Central North Regional Electricity Distributor (CENORED) which is one of several regional electricity distributors in Namibia. CENORED buys the power from HopSol directly. According to Bauer (2016) the PPA signed between HopSol and CENORED states that CENORED will buy all power produced at the park on a fixed tariff (Bauer, 2016).
1.6 Photovoltaic systems
A photovoltaic (PV) cell, also known as a solar cell, is a semiconductor that converts sunlight into electricity. The process works at an atomic level where the sunlight causes certain materials to release electrons that are collected and an electric current is generated as a result (NASA, 2011). A PV system is a type of renewable energy technology that has no carbon emissions and the energy it produces offers multiple of advantages that offset the initial investment costs, which are usually high. A few examples are that Operations and Management (O&M) costs are low, solar energy supply is predictable and there is no water needed in the energy generation process. Due to the high investment costs, the modelling procedure of a PV system needs to be detailed where the components and configuration of the system plays an important role (Solar Town, 2012).
1.6.1 Photovoltaic thin film cells used at Omburu and Otjiwarongo
There are many different types of PV cells but the most conventional type is the crystalline silicon solar cell. An increasingly attractive option to the traditional cell technology is the thin film solar cell used at the Omburu and Otjiwarongo parks, which has improved in efficiency over the last years. It also has a higher absorption rate and it performs better in warmer climates compared to other technologies. The optimal operation temperature for crystalline is around 25 oC and will decrease at a rate of 0.04%/oC with higher temperatures, while a thin film solar cell has an efficiency drop of 0.01%/oC (Pathak, Pearce, & Harrison, 2012). Thin film solar cells are therefore a viable option for countries such as Namibia where high levels of solar irradiation are common and operating temperatures are high. According to HopSol (2016), their thin film modules produce up to 15 % more electricity than traditional mono-and polycrystalline cells from the same installed capacity.
1.6.2 Axis tracking
In order to optimize solar energy production, a PV system can be equipped with an axis tracking system. This system allows the PV system to follow the sun during the day either
through a predetermined time schedule or a sensor. The most common configuration for axis tracking systems in solar parks is the horizontal single axis tracking. The tracking goes from east to west and is especially effective for systems at a low latitude. For countries with a higher latitude, it can be wise to consider a dual tracking system where the southern tilt is also configured and included (Modeling steps: PV Performance, u.d.).
1.6.3 Inverters
An inverter is used to convert a direct current (DC) to alternating current (AC). Some models of inverters use transformers that simultaneously change the voltage when switching current types. As mentioned previously, a transformerless inverter converts the current to standard frequency AC without using transformers. It also offers additional benefits, for instance, increased efficiency, increased affordability and reduced weight and space. However, there are some safety concerns since there is no galvanic insulation between the DC and AC circuits and issues with grounding can occur. This requires extra protocol and planning when modelling a photovoltaic system (Civic Solar, 2011).
1.7 Electricity market
In order to operate a storage system in an optimal way, the present conditions regarding the electricity market with policy and regulations in the area of operation needs to be understood. Therefore, basic information of policy mechanisms used in the electricity market in Namibia today will be explained below.
1.7.1 Net metering
For an IPP or prosumer, it is necessary to determine how much energy is produced and consumed. For this purpose, net metering is used to determine the net difference between consumed and produced electricity. This allows excess energy that is produced to be sold to the grid. For example, in a solar home system the electricity production will decrease towards the evening and electricity can then be bought back from the grid which means that production of electricity that is not directly used, adds value to the grid customer. The customer is only billed for the net difference of electricity. This low cost method promotes private investments in renewable energy such as wind and solar power, and also allows regional energy distributors to better manage peak loads in a region (Commonwealth of Massachusetts, 2015).
Figure 4 – Chart describing energy load of a prosumer with solar power production compared to bought and sold electricity (Wikimedia commons, 2013)
The effect of net metering can be seen in Figure 4 and Figure 5 where otherwise lost energy pays for bought energy. The figures illustrate an ideal scenario where the bought energy is already paid for through net metering.
Figure 5 – Chart describing energy load of a prosumer with solar power production compared to bought and sold electricity with net metering installed (Wikimedia commons, 2013).
There are, however, issues with net metering that needs to be addressed. For instance, there is the issue of energy banking where private actors use the electricity grid as a battery like the previous figures. This can have severe implications if not properly regulated. A country like Namibia which has a large potential for solar power, needs to address these types of risks in order to achieve stable development in the energy sector (von Oertzen, 2015).
1.7.2 Feed in Tariff
Feed-In Tariffs (FIT) are policy mechanisms that are designed to promote clean energy generation. The tariffs are contracts that the producer sign with the government in order to decrease the producers’ payback time and increase the share of renewable energy within the country (Couture, Cory, Kreycik, & Williams, 2010). A FIT usually include the following terms:
Guaranteed grid access Long-term contracts Cost-based purchase prices
Any producer of green electricity can use the tariffs. It can be private actors, business, property owners or private investors (Feed-In Tariffs Ltd, 2015).
The tariffs rates differ depending on technology. Solar power tariffs are usually higher due to the high investment price. The size of the tariff also depends on the location (e.g. ground level or roof based solar PV systems), size and region of the project (Couture, Cory, Kreycik, & Williams, 2010). To encourage technological development, the contracts are usually designed so that the tariffs decline over time. This way, the strive for cheaper and more efficient technologies does not stop when long term tariffs are signed (Couture & Gagnon, 2010).
1.7.3 Power purchase agreement (PPA)
A PPA is a contract between a seller and a purchaser of electricity where the buyer agrees to purchase electricity produced by the seller. The PPA sets all the commercial rules for the electricity sales between the two parties. It also defines the terms for when the commercial operations for the project will begin, when the electricity should be delivered, payment terms, penalties if the producers fails to deliver the agreed upon amount of electricity and finally termination rules (Thumann & Woodroof, 2009).
A PPA is an important tool of project finance. It is the principal agreement that establishes the revenue and credit quality of the electricity generation project. There are many different forms of PPAs and each one is tailored depending on the requirements of the seller, buyer and financing counterparties involved in the project (Thumann & Woodroof, 2009).
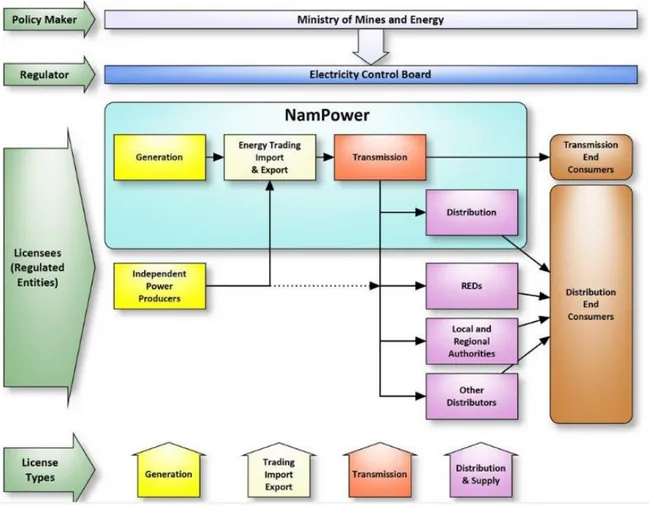
In Namibia, the PPAs can be between an IPP and NamPower or directly between the IPP and a regional electricity distributor (RED) (emCON, 2012). Figure 6 – Picture showing the electricity supply structure Namibia.Electricity generated by IPPs can go either via NamPower or directly to a RED. Figure 6 show a scheme of the electricity supply structure in Namibia.
Figure 6 – Picture showing the electricity supply structure Namibia (emCON, 2012).
1.7.4 Time-of-use tariffs
A time-of-use tariff is a pricing mechanism where a provider of electricity varies the price depending on the time of day. It may also vary with seasons. The energy charges are usually divided into three categories: standard demand, peak demand, and off-peak demand (Schleich & Klobasa, 2013). This time-based pricing can include the following:
1. Time-of-use-pricing: Applies when the electricity prices are set in advanced for a specific
period. Often not more than a couple of times a year. The prices for each category are established in advance and the consumers can manage their usage accordingly. For example, consumers can try shift their load to low cost periods or reduce their overall consumption (Schleich & Klobasa, 2013).
2. Critical peak pricing: Is when time-of use prices are used except for certain peak days. The
peak day prices can reflect the generation and/or purchasing cost of electricity at the wholesale level (Smartgrid.gov, 2016).
3. Real-time pricing: Is when the electricity change hourly or sometime even more often. A price
cost of generation and/or purchasing coast of electricity at the wholesale level (Smartgrid.gov, 2016).
4. Peak load reduction credits: Are pre–established peak load reduction agreements that
customers with large power loads can enter with the utility in order to reduce planned capacity obligations (Smartgrid.gov, 2016).
The time-based pricing is developed differently depending on the environment it operates in. A regulated utility will create the pricing schedule after analyzing its cost on a long run basis, including both investment and operation costs. If the utility, on the other hand, is operating in a market environment, where the electricity is auctioned on a competitive market, the time-based prices will vary according to the market prices (Smartgrid.gov, 2016). In Namibia, the electricity control board (ECB) sets the time-of use tariffs that the REDs pay NamPower for any bought power.
1.7.5 Time-of-use tariffs in Namibia
The following figures describe time-of-use tariffs used by NamPower for different demands. The tariffs are also divided into low demand and high demand season. The prices in Figure 7 will be used as example of tariffs in the simulations and will be of importance for the energy shifting strategy with energy storage.
Figure 7 – Time-of-use tariffs in Namibia for peak, standard and off peak demand. The upper rows show tariffs for the low demand season (May-September), and the lower rows show the tariffs for
high demand season (June-August) (Nampower, 2015).
When the different tariffs apply can be seen in Figure 8. These hours and prices are applied to the Matlab code for optimization.
Figure 8 – Time-of-use tariffs hours in Namibia for both low (upper rows) and high (lower rows) demand season (Nampower, 2015).
1.8 Scope and limitations
The main purpose of this thesis is to investigate the potential of adding electric storage capacity to grid connected domestic solar power generation in Namibia. The focus will be on utility-scale systems of approximately 5 MW. The main study will be on battery storage implementation and a techno-financial analysis of the different potential storage technologies that could be used for the solar parks in Namibia. This analysis will be limited to be from a technical and financial standpoint. Some policy and regulations will be studied but not at a very detailed level. The analysis will include a scenario without storage connected to compare the cost/revenue with the storage scenarios. There are different ways to store electricity, but in order to limit the amount, only chemical batteries were studied.
The Omburu and Otjiwarongo parks were visited and data from PVsyst was used to create a model in Matlab. The simulations are meant to provide the information required to answer the questions described in the problem definition below.
1.9 Problem definition
This thesis work concerns Namibians national grid. Namibia currently imports 60 % of all electricity from South Africa. With access to a large amount of resources, the amount of imported electricity could be decreased through focusing efforts on these resources. With solar parks, there is the issue of intermittency. A solution to the problems that arise with intermittent energy sources is the usage of energy storage technologies. The impact of implementing energy storage in connection to the recent installation of large scale solar power plants was investigated. The main question was to investigate if the usage of storage for energy shifting could shift the generated power towards peak hours and still be economically feasible. A techno-financial analysis of the parks combined with storage was carried out, in order to determine if such an operation of the parks is feasible and advisable for Namibia. If it is, it could pave way for a number of similar projects in the future. Research questions are:
1. What market conditions need to exist in order for energy shifting at the solar parks in Namibia to increase economic feasibility of the parks?
2. What storage technology is the most suitable for energy shifting applications in Namibia today and in the future?
3. How will the time shifting affect the park owners/off takers? 4. What impact will the time shifting have on grid stability?
By answering these questions, the goal was to determine if solar power in combination with storage is the way to go in order for Namibia to decrease their foreign dependency of electricity imports and promote economic growth within the country.
1.10 Hypothesis
The storage cost can be facilitated by selling the stored electricity when prices are higher and the energy shifting can also contribute to better cover the demand during peak hours. However, with todays battery prices it will likely be too expensive for the implementation of large scale energy shifting. This could become a more attractive option in the future if the battery prices drop. The installation of large scale intermittent energy sources such as solar, could lead to power fluctuations at the transmission level, which could reduce the grid’s stability. However, by adding energy storage, it could also be possible to counteract some of these negative impacts through load and discharge optimization.
2 LITERATURE REVIEW
In this section, some previous work in the area and other literature needed for the study will be presented.
2.1 Electric power systems
Basic information of electric power systems will be presented below. This is to provide understanding needed for the remainder of this report.
2.1.1 Generation
The process of converting energy resources into electric power is called generation. The electric power is produced so that energy demand is met at all times. The generation of electricity depend on hundreds of physical components operating together and each generation technique has its own process. The size of the generation plant also influence the specific process needed to produce electricity (Casazza & Delea, 2003).
2.1.2 Transmission vs distribution
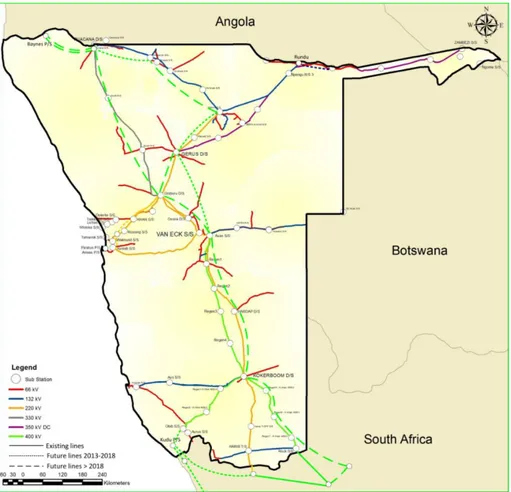
Electric power systems like a national grid usually consist of different layers. The top layers are classified as transmission and the bottom layers are classified as distribution. Transmission can be separated into transmission and sub transmission and distribution can be separated into primary and secondary distribution. There are different voltages levels in the system where transmission operates at the highest voltages and then the voltage declines throughout lower levels in the system. Generally, large consumers of electricity can connect directly to transmission or sub transmission lines (Casazza & Delea, 2003). Figure 9 show a map of the transmission network in Namibia.
Figure 9 - Map of transmission network in Namibia including the location of substations and projected lines (NamPower, 2013).
Commercial consumers usually connect to the primary distribution network while most residential customers connect to the secondary distribution network (Casazza & Delea, 2003).
2.1.3 Grid Stability
Interruptions in the grid can happen at any time and the length of these interruptions can range anywhere form a couple of seconds to several hours. The interruptions may depend on failure in any of the three parts of the system: i.e. generation, transmission or distribution. The disturbances causing the interruptions are either external or internal. Examples of external disturbances are environmental impacts, while internal disturbances include insufficient capacity, equipment failure due to mechanical or electrical stress and operation errors (Casazza & Delea, 2003). Different generation types also have their own additional challenges when it comes to grid stability. For example, the intermittent energy from the sun used in PV modules leads to additional problems with grid stability, which will be explained in the sections below.
production varies over time. For example, a grid connected PV system will have a production peak during the day and no production at night when the sun is down (Pacific Northwest National Laboratory , 2016). The production curve will also vary during the day due to different reasons such as cloud cover, dust etc. (Marcos, Marroyo, Lorenzo, & García, 2012).
Electricity storage could shift the generated power from intermittent sources and help smoothen the curve while allowing electricity to be used when most needed i.e. during peak demand hours. Integrating large scale storage systems to grid connected PV and wind systems could be key in order to fully utilize these renewable sources (Pacific Northwest National Laboratory , 2016).
There are several ways of storing energy. It can be stored in dams, hydrogen, magnetic fields etc. One of the common ways of storing electricity is by using batteries. With the increased installment of wind and solar, along with the development of the electric cars, analysts expect the market for batteries to boom which means that efficiencies will increase and prices will decrease (Moore, 2015). A review of the battery market available for large scale grid connected PV systems will be presented in the literature study below.
2.3 Battery review
A review of some of the most common battery types used for electric storage in utility-scale solar power is presented below. Technical info is provided and advantages and disadvantages of each types are discussed. In section 2.3.6, the technical data for each battery type chosen for the simulations are presented.
2.3.1 Lead-acid
One of the most traditionally used battery storage technologies is the lead-acid battery type. Invented in 1859, it is the oldest type of rechargeable batteries on the market today. The technology behind is simple and mature and the manufacturing costs are low. However, there are a number of disadvantages with the traditional lead-acid technique. The batteries charge slowly, they cannot completely discharge and the number of charge/discharge cycles are limited. The toxic lead and acid are also an environmentally questionable addition to clean solar power (Poullikkas, 2013).
Recently, deep-cycle lead-acid (DCLA) batteries has been developed and been used for stabilizing wind generation. DCLA has been designed for the purpose of peak shifting and backup storage in grid tied PV systems (Poullikkas, 2013). There are also advanced lead-acid (A-LA) batteries, which could be used for time shifting applications at utility scale systems. The batteries have lower maintenance requirements and longer lifetime expectancy. The costs are, however, larger in comparison (Carnegie, Gotham, Nderitu, & Preckel, 2013).
2.3.2 Lithium-ion
Lithium batteries were developed in the early 1900’s but it was not until 1990 that rechargeable lithium batteries became commercially available. Compared to lead-acid batteries, the lithium-ion technology is not as mature, there are however many advantages from using lithium (Carnegie, Gotham, Nderitu, & Preckel, 2013). It is the lightest of all metals, so it can provide the largest energy density for weight and has the best energy electrochemical potential of all battery types. Other advantages with lithium-ion batteries are that they do not need prolonged priming; the self- discharge is relatively low as well as the maintenance level (Battery Univeristy , 2016). Additionally, the round-trip efficiency is high, reaching over 90% for some models (Carnegie, Gotham, Nderitu, & Preckel, 2013).
There are, of course, some disadvantages with the lithium-ion (li-ion) batteries as well. They require a protection circuit in order to keep operations safe. In addition, the batteries age even when not in use and the manufacturing cost are high (Battery Univeristy , 2016). Another problem with lithium is the recycling. It is possible to recycle 100 % of the lithium battery but it is very expensive. The cost of recycled lithium is up to five times more expensive than regular lithium (Kumar, 2011). There needs to be a continued cost reduction and the lifetime needs to continue to improve in order for the batteries to more competitive on a utility scale basis (Poullikkas, 2013).
2.3.3 Nickel-cadmium
In Nickel-cadmium batteries, the positive electrode contains nickel oxyhydroxide as the active material while the negative electrode is made up of metallic cadmium. The nickel-cadmium batteries can be either sealed or vented, but the vented version is safer and more economic (Poullikkas, 2013).
These batteries are ideal for ensuring standby power in harsh conditions and they can protect the power quality against voltage sags. The fact that the batteries can withstand high
temperatures has made them popular for solar power storage. However, they do not work well for peak shaving applications and are therefore usually not considered for energy management systems (Poullikkas, 2013).
Nickel cadmium batteries are considered a mature technology and relatively cheap. As mentioned above, they are best suited for standby power and applications such as grid angularity stability, short duration power quality and grid frequency excursion suppression. They are, however, not ideal for time shifting applications (Carnegie, Gotham, Nderitu, & Preckel, 2013). Therefore, this technology was not tested in the simulation model.
Wh/kg and a lifetime of 10-15 years depending on depth of discharge and frequency of use. Their characteristics make them suitable for both energy and power application at the same time, which is a rare advantage amongst battery technologies (Carnegie, Gotham, Nderitu, & Preckel, 2013).
Sodium-sulfur technology provides batteries with high energy density, high efficiency of discharge/charge rate and long cycle life and the materials used are relatively inexpensive. Their main disadvantage includes their relatively high operating temperature (300-350 oC) and the corrosive sodium polysulfide which makes the batteries suitable only for large scale, grid connected systems (Poullikkas, 2013). The high temperature also creates safety concerns such as the risk of explosion if they come in contact with water. Therefore, the storage system is not advisable to be placed next to residential areas (Carnegie, Gotham, Nderitu, & Preckel, 2013). Still new as utility scale storage, cost estimates for NAS battery at this scale are still high, but prices are expected to drop substantially when more plants are built and the technology becomes more mature (Carnegie, Gotham, Nderitu, & Preckel, 2013).
2.3.5 Flow batteries
Flow batteries are rechargeable batteries where an electrolyte with at least one dissolved electro-active species flows through an electrochemical cell from which electricity is directly converted from chemical energy. The flow batteries can quickly be recharged by changing the electrolyte liquid and the spent liquid can be recovered at the same time. The flow batteries inlcude batteries such as the vanadium redox battery and hybrid flow batteries such as the zinc–bromine battery (Poullikkas, 2013). For flow batteries, the cycles are usually not the limiting lifetime factor, it is instead some of the individual components in the battery that break down. If the broken components are replaced when needed, the lifetime of the battery could in theory be unlimited (Carnegie, Gotham, Nderitu, & Preckel, 2013).
2.3.5.1 Vanadium redox battery
The vanadium redox batteries (VRB) have almost unlimited storage potential, all that is needed is to increase the size of the storage tank. It can also be left uncharged for long periods of time without any negative effects. The technology is therefore useful in large wind and solar applications where generation needs to be averaged out. The disadvantage is low energy-to-volume ratio and the complexity of the auxiliary system required, in comparison to other batteries (Poullikkas, 2013).
The power and energy characteristics of VRB are useful for utility applications where long discharge durations are needed and the rated power is somewhere between 100 kW and 10 MW. This makes the VRB a good choice for energy shifting applications. The expected lifetime of a VBR cycled 1000 times annually is 10-15 years (Carnegie, Gotham, Nderitu, & Preckel, 2013).
2.3.5.2 Zinc–bromine battery
The zinc-bromide (zn-br) is a hybrid flow battery that is stored in two tanks. One tank stores the positive electrolyte while the other stores the negative one. There are several advantages with this technology, for instance, the energy density is high, compared to lead-acid, the depth of discharge capability is 100% on a daily basis and the number of cycles are high compared to other technologies. The batteries can also be used for any type of power source and the storage system can easily be scaled up to over 500 kWh. This technology also has the potential to provide energy storage at a lower price than other systems such as lithium-ion and lead-acid (Poullikkas, 2013).
The high energy density and the low cost make the zn-br technology suitable for utility scale storage. The round-trip efficiency is also relatively high (70-80%). Compared to VBR, the technology less mature and less tested so the reliability of a zn-br system is not yet as certain as for more mature technologies (Carnegie, Gotham, Nderitu, & Preckel, 2013).
2.3.6 Technical specifications
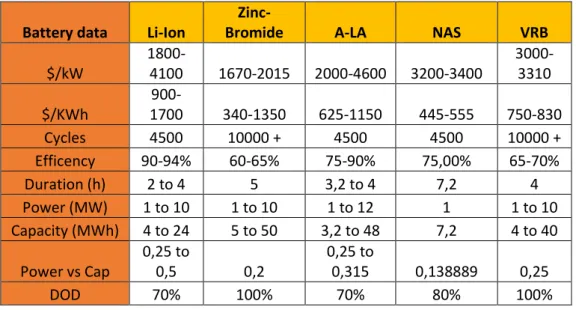
The technical data for the chosen batteries can be seen in Table 1. The rated capacity is calculated as the rated power multiplied by the storage capacity. The storage capacity is the time the battery can be charged at the rated power before it becomes full. The capacity and storage intervals represent examples of sizes of systems for which the cost calculations have been made.
When analyzing data characteristics for batteries, it is important to distinguish between energy and power. Depending on the application, its importance varies. In the case of energy shifting, it is important to have a high energy volume of storage available, thus the price per kWh is very important when choosing the battery technology. The power of a battery can be divided into three types: reactive power, pulse power and real power. The reactive power does no work, but is travels back and forth between components by absorption and release of energy. Although no work is done by it, it does increase the current that leads to higher heat losses and can cause voltage stability problems. Real power is the power that continuously is discharged while pulse power is the maximum power that could be discharged for a very short (seconds) amount of time. For energy shifting appliances, the real power of the battery is the most interesting one to consider (Carnegie, Gotham, Nderitu, & Preckel, 2013). The depth of discharge (DOD) is the percentage of the power discharged in relation to the maximum capacity before it is recharged. The DOD has a large impact on cycle life in most battery types (Carnegie, Gotham, Nderitu, & Preckel, 2013). A battery cycle is defined as the full discharge (100%) of the battery. The battery does not, however, need to be discharged from 100-0 % to count as a cycle, it could, as an example, be discharge from 100% to 50 %, be fully charged, then discharged again to 50 % and count as only one full cycle (Apple Inc., 2016). Cycle life for the first three battery types in Table 1 depend on the DOD for which they
The efficiency of a battery or the round-trip efficiency is the amount of energy stored that can be used when dispatched from the battery. Usually, not all energy stored can be utilized when discharged from the battery, due to losses in the process. The quota between the useful energy and the stored energy is thus known as the round-trip efficiency of the battery. Ambient conditions such as temperature can affect the efficiency of the battery (Carnegie, Gotham, Nderitu, & Preckel, 2013).
Table 1 – Battery data for the batteries used in the simulation (Carnegie, Gotham, Nderitu, & Preckel, 2013).
Battery data Li-Ion
Zinc-Bromide A-LA NAS VRB
$/kW 1800-4100 1670-2015 2000-4600 3200-3400 3000-3310 $/KWh 900-1700 340-1350 625-1150 445-555 750-830 Cycles 4500 10000 + 4500 4500 10000 + Efficency 90-94% 60-65% 75-90% 75,00% 65-70% Duration (h) 2 to 4 5 3,2 to 4 7,2 4 Power (MW) 1 to 10 1 to 10 1 to 12 1 1 to 10 Capacity (MWh) 4 to 24 5 to 50 3,2 to 48 7,2 4 to 40 Power vs Cap 0,25 to 0,5 0,2 0,25 to 0,315 0,138889 0,25 DOD 70% 100% 70% 80% 100%
2.4 Energy storage for large scale photovoltaic systems
Marinopoulos & Bakas (2014) has investigated the potential of large scale grid connected PV systems at various locations around the globe. Several parts of the system were studied, such as the tracking system, the inverters and the PV material. The LCOE for each configuration and each location is then presented in graphs.
The authors finish with two scenarios for energy storage. One is when the storage is used to run the PV system as a baseload production system where the power output is constant for 24 hours. The other scenario focuses on operating a constant output for shorter periods of 6 to 16 hours. For the storage scenarios, fixed and single axis systems were tested. Results showed that the storage systems evaluated were not economically feasible at this point, especially not for the baseload scenario with 24h constant output. However, it was stressed in the
conclusion that the economic analysis does not include the positive effects than a more constant output has on the grid’s stabilty.
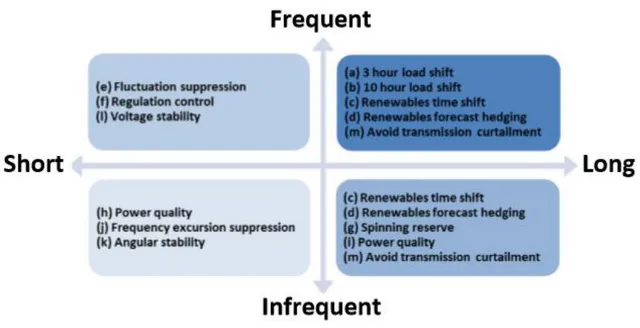
It is important to differentiate between long and short term discharge as well as frequent and infrequent use. For different applications of storage, there are technical aspects of varying importance. Long discharge times often means hours of continuous discharge, while short term discharge range from seconds to minutes. Frequent discharge refer to when a battery is charged and discharged more than 20 times per year, or if the battery is cycled continuously. Infrequent discharge is when the battery is only discharged randomly or less than 20 times
per year. Figure 10 show what different storage applications require in terms of discharge frequency and duration (Carnegie, Gotham, Nderitu, & Preckel, 2013).
Figure 10 - Matrix of energy storage appliances in relation to discharge frequency and duration (Carnegie, Gotham, Nderitu, & Preckel, 2013)
2.5 Energy storage operation strategies
Using energy storage combined with PV offer several advantages. On one hand, the generated power can be stored to be used at a different time (e.g. when electricity supply cost is higher). There are a number of operation strategies that can be applied. Marinopoulos & Bakas (2015) investigates three ways of using storage for managing the intermittent power from the PV cells and shifting the power usage to a different time.
2.5.1 Capacity firming
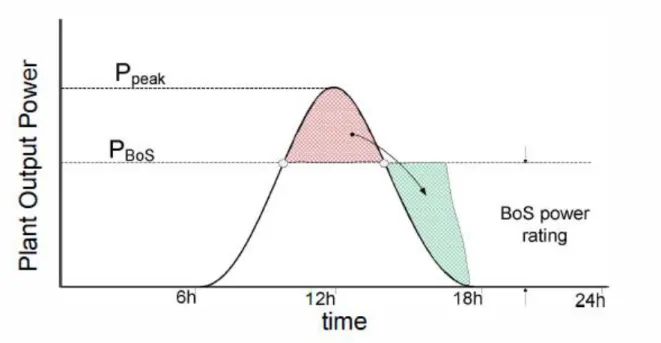
Marinopoulos & Bakas (2015) first present the concept of capacity firming. They then explain that the rated power of the balance of systems (BOS) decides if the battery should be charged or discharged. The BOS is the subsystem that allows the electricity generated by the PV cells to be properly transferred to the load. They are all of the additional components needed that are not directly connected to the PV cells (U.S. Department of Energy, 2016).
Figure 11 describes how the charge and discharge functions are managed. When the PV generation is above the rated power for the BOS, the batteries are charged, when it drops below, the battery is discharged.
Figure 11– Example of operating the battery for capacity firming (Marinopoulos & Bakas, 2015).
2.5.2 Baseload operation
Baseload operation is when the energy storage is used to achieve a baseload like output. The goal is to create a constant output with help from the batteries for a specific time period. The time period can range anywhere from 24 hours down to only a few hours. This way of handling the intermittent power makes the output curve more predictable, and therefore facilitates more careful operational planning of the complete power system. Figure 12 shows how the storage can be used to create baseload-like time periods (Marinopoulos & Bakas, 2015).
Figure 12 - Baseload operation examples for different time periods using ES (Marinopoulos & Bakas, 2015).
2.5.3 Energy shifting
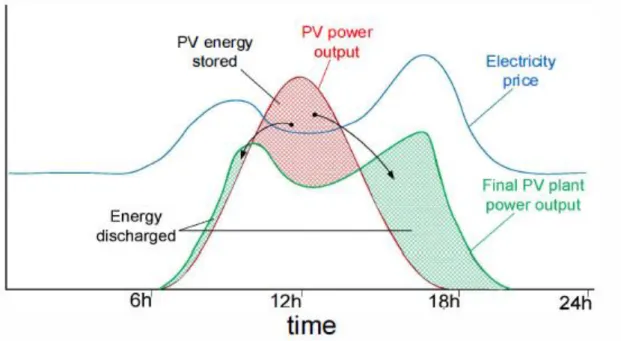
Energy shifting occurs when the energy storage is used to shift the electricity generated by the PV cells to hours when the electricity price is higher. This is only possible if there is a flexible electricity price or if TOU tariffs apply. By shifting the output this way, the revenue for the solar park could increase and the extra income be used to pay for the investment cost of the batteries. The higher prices at peak demand could motivate the storage of energy when the price is lower and then sell it at a more profitable time. Depending on the PPA and what setup the off taker has, the time shift could also be used to avoid buying otherwise needed electricity at peak prices. Figure 13 show how energy shifting could be used in order to increase the revenue of the solar park (Marinopoulos & Bakas, 2015).
Figure 13 – Example of using ES for energy shifting including a blue line showing the electricity price during 24h (Marinopoulos & Bakas, 2015).
3 METHOD AND MATERIALS
The general method and tools used in this thesis work are explained in this chapter.
3.1 General methodology
3.1.1 Literature study
The project started with a literature review based on research papers from scientific data bases and other internet sources. The national grid of Namibia was studied as well as current and future installation of solar parks that will connect to the grid. The basics of how an electric power system works with transmission and distribution was presented in the background. Previous works of relevance and similar studies were investigated and key notes were included in the literature study.
3.1.2 Electricity market analysis
An analysis of the electricity market in Namibia including the existing energy and electricity policies was be carried out. Renewable energy feed-in tariffs (REFIT), net metering and power purchase agreements specific for Namibia were analyzed. Time-of-use tariffs rules and prices were studied and were included in the simulations.
3.1.3 Battery review
A review of the available battery market for large scale grid connected PV systems were conducted. The review was used as a guideline to choose the best-suited battery type for the intended application for the solar parks in Namibia. The battery types were then tested through simulations.
3.1.4 Field study / data collection
The solar parks in Omaruru and Otjiwarongo were visited but real production data from the parks could not be obtained. A possible option was to study a 1 MW PV roof system in Windhoek, from which data could be obtained. Several test simulations were done with this data, however, it was decided not to include the results in the report, since the system is too different from the solar parks.
People with knowledge of the grid, the solar parks, and the electricity price settings were interviewed in order to increase our understanding of the power system in Namibia.
3.1.5 Simulation
Simulations were carried out with focus on energy shifting optimization. The simulations were done in Matlab in order to help answer the main questions of the project. For the simulations, production data from PVsyst was used. This was done using data for yearly irradiation, temperature, wind speed, humidity etc. In the simulation, different battery technologies were tested in order to find the best option. The simulation and the model are described in detail in the chapter “Matlab Model”.
3.1.6 Financial feasibility
A techno-financial investigation of the different scenarios was conducted. The chosen batteries were also tested and the investment cost was compared to the potential earnings from the time shifting. A simulation to find the optimum size of the batteries in order maximize the revenue was also carried out.
3.2 Materials
Materials used in the thesis work will be presented below.
3.2.1 PVsyst
PVsyst is commonly used in the modelling of photovoltaic systems. The software is detailed in the sense that there are many options for the type of system that one wishes to construct. The solar power output from the software was then used in the Matlab model.
3.2.2 Matlab
Matlab is a sequential simulation software with an interactive environment. It was used for data processing, graph construction and mathematical modelling of the delivered energy and the energy storage system.
4 MATLAB MODEL
For this project, a model in Matlab was developed where the main purpose was to evaluate and simulate utility scale energy storage for energy shifting. The energy storage system is modelled in order to optimize the time shifting and shift the produced electricity towards peak demand hours.
4.1 Model Input
There are several types of adjustable inputs for the model: power production data, tariff pricing, battery specifications and number of days. The given production data was supplied from simulations in PVsyst. In the PVsyst simulations, there were several factors that needed
Thin film cells were chosen for the solar technology, the peak production was set to 5 MWp, the system was set to include single axis tracking and the chosen inverters were of the same brand as the ones installed at Otjiwarongo.
The results from PVsyst generate an MS Excel sheet with values for each hour of production from the simulated power plant which are then read into Matlab. The simulation period is valid for exactly one year. This means that in order to extend the simulation period for the batteries it was necessary to duplicate this year for an additional 14 years.
The tariff prices for off-peak, standard peak and high peak demands are adjustable values where data from Nampower was initially taken to represent realistic values in NAD/kWh. The prices were adjusted to fit the schedule in Figure 8 that is directly applied in the script. Several different storage technologies based on the battery review were tested in the code where the battery type is initially chosen through a switch-case and then further simulated.
4.2 Battery capacity and lifetime
The maximum battery size has been determined from commercially available capacities. For the batteries, the storage sizes are tested from 1000 kWh up to 30000 kWh of storage. With a charge duration of 4 hours selected (as in the case of li-ion), the charge and discharge rate of the batteries is 25% of the total battery capacity. For example, if the storage capacity is 10000 kWh the charge and discharge rate will be 2500 kW.
For certain types of batteries, a full discharge of the stored energy can be inefficient and shorten the life span of the batteries. As mentioned before, there are certain batteries that are not affected by this. This is, however, an issue for the li-ion, zn-br and NAS batteries, and in order to avoid this, an upper and lower limit of the total battery capacity is assigned.
4.2.1 Cycles and decrease of total energy capacity
In the code, a discharge counter was used to keep track of total amount of discharged energy from the batteries. For each 100% of discharged total energy capacity, a cycle was added to the counter.
In reality, for each cycle, the total battery capacity will slowly decrease due to natural
deterioration. According to Saft (2016), the maximum capacity for their lithium-ion batteries has a deterioration rate of 20% over 6000 cycles. This rate is not linear and Figure 14 shows how the capacity decreases with the cycles.
Figure 14 - Example of decrease of total battery capacity of a lithium-ion system due to number of cycles (Saft, 2016).
This relationship was implemented into the battery model as a simplified linear equation.
𝐵𝑎𝑡𝑡𝑒𝑟𝑦 𝑐𝑎𝑝𝑎𝑐𝑖𝑡𝑦 𝑒𝑓𝑓𝑖𝑐𝑖𝑒𝑛𝑐𝑦 = −4 ∗ 10−5∗ 𝑖 + 1
Where i is the current cycle. As the program runs, each cycle will therefore decrease the total battery capacity through:
𝐵𝑎𝑡𝑡𝑒𝑟𝑦 𝑐𝑎𝑝𝑎𝑐𝑖𝑡𝑦 𝑛𝑒𝑤 = 𝐵𝑎𝑡𝑡𝑒𝑟𝑦 𝑐𝑎𝑝𝑎𝑐𝑖𝑡𝑦 ∗ 𝐵𝑎𝑡𝑡𝑒𝑟𝑦 𝑐𝑎𝑝𝑎𝑐𝑖𝑡𝑦 𝑒𝑓𝑓𝑖𝑐𝑖𝑒𝑛𝑐𝑦
4.2.2 Round-trip efficiency
The round-trip efficiency of the battery determines how much of the energy stored into the battery is lost during the conversion process. In the model, this is simplified through the discharge process where the sold energy is decreased because of this.
𝑆𝑜𝑙𝑑 𝑒𝑛𝑒𝑟𝑔𝑦 = 𝐷𝑖𝑠𝑐ℎ𝑎𝑟𝑔𝑒 𝑟𝑎𝑡𝑒 ∗ 𝑅𝑜𝑢𝑛𝑑𝑡𝑟𝑖𝑝 𝑒𝑓𝑓𝑖𝑐𝑖𝑒𝑛𝑐𝑦 ∗ 𝑇𝑎𝑟𝑖𝑓𝑓 𝑝𝑟𝑖𝑐𝑒
4.3 Model construction
As previously mentioned, the model is almost entirely constructed in Matlab. The flowcharts in Figure 15 and Figure 16 describe the simulation sequence which is carried out in the
0,7 0,75 0,8 0,85 0,9 0,95 1 1,05 0 1000 2000 3000 4000 5000 6000 7000 Re lat iv e cap acity Cycles
Figure 15 - Flowchart of general system model in Matlab.
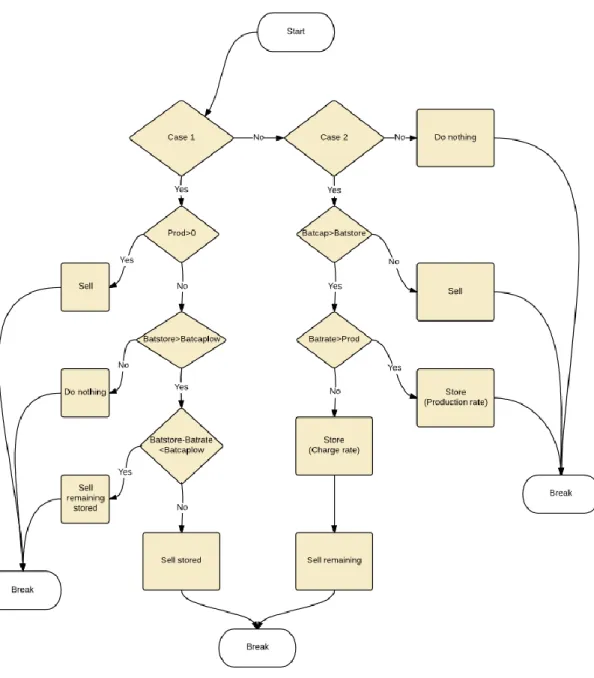
4.3.1 Energy storage function
In the energy storage function (see Figure 16), two cases initiate a series of sequences. Each case represents different actions for the tariff pricings. Case 1 is the high tariff-pricing scenario, which is activated when the variable ‘hour’ is in the correct section. Case 2 is
activated when the tariff for low or medium is instead used and requires that the solar park is delivering energy. This is because the model is designed to store energy into the battery system when the energy has a low sell value. Of course, if neither of these conditions are met, the program will proceed with doing nothing.
Figure 16 - Flowchart of battery storage and sell functions in Matlab.
4.3.2 Tariff prices
For the simulation, three different TOU tariff schemes were tested. The low demand and high demand season tariffs represent the tariffs set by the ECB for customers taking transmission power directly from NamPower above 33 kV. The favorable tariff prices are made up to represent favorable tariff conditions for energy shifting applications. It is important to note that despite the names; the same tariffs are executed for the full year and no separation between high and low demand season has been made in the code.