Spatial organization of retail activities
Doctoral ThesisHelena Nilsson
Jönköping University
Jönköping International Business School JIBS Dissertation Series No. 136 • 2020
Spatial organization of retail activities
Doctoral Thesis
Helena Nilsson
Jönköping University
Jönköping International Business School JIBS Dissertation Series No. 136 • 2020
Trycksak 3041 0234 SVANENMÄRKET Trycksak 3041 0234 SVANENMÄRKET
Doctoral Thesis in Economics Spatial organization of retail activities JIBS Dissertation Series No. 136
© 2020 Helena Nilsson and Jönköping International Business School Published by
Jönköping International Business School, Jönköping University P.O. Box 1026
SE-551 11 Jönköping Tel. +46 36 10 10 00 www.ju.se
Printed by Stema Specialtryck AB 2020 ISSN 1403-0470
Acknowledgements
“For a moment, nothing happened. Then, after a second or so, nothing continued to happen.”
― Douglas Adams, The Hitchhiker's Guide to the Galaxy
The above quote by Douglas Adams aptly describes the first three of the past five years of my PhD. At first, I tried everything and produced nothing. Then I continued with that some more, just adding some more stress into the picture. But with the help of my supervisors - Johan Klaesson, Sven-Olov Daunfeldt and Özge Öner - I eventually got some text down on paper.
I would like to thank Handelsrådet (The Swedish Retail and Wholesale Development Council) and Institute of Retail Economics (HFI) for financially supporting this research.
I wish to express my gratitude to the following people: Johan, my main supervisor, for his patience, wisdom and tireless feedback on my papers. Johan has also been a fantastic coauthor, he is an excellent economist and researcher from whom I have learned very much. He has been a great support and one of those that makes this workplace great. I want to thank my second supervisor Sven-Olov, for all the support, valuable help and feedback on my work. Sven-Olov is also a very skilled economist and a terrific coauthor. I would also like to thank the equally talented economist and my third supervisor and dear friend, Özge, for all the advice and feedback on my work.
I want to thank Sierdjan Koster, my final seminar discussant, whose constructive feedback has greatly improved the quality of my thesis. I would like to thank Mikaela Backman for being the kind and wise coworker, boss, and dear friend that she is. Mikaela has lifted my spirits and has been a great support and she has given me feedback and comments on many of my papers. I would like to thank Pia Nilsson, for the kindness, the support and valuable feedback on my papers and for being a great friend. I would like to express my gratitude to those that, in addition the above mentioned, at different times have read and given me valuable comments on my papers. I also would like to add that, together with all the people I have and will mention, you brighten up this workplace for me: Lina Bjerke, Johannes Hagen, Agostino Manduchi, Charlotta Mellander, Paul Nystedt and Sofia Wixe. I also wish to thank Andrés Rodríguez-Pose for valuable comments on my research. I also want to thank the participants in the Friday seminars, at which, under the competent lead of Almas Heshmati and Scott Hacker, I have both gotten feedback and learned about the interesting research of my colleagues. I want to thank Monica Bartels for always being so friendly and helpful with everything from crosswords to organization. I will always remember how you, me, Paul Nystedt, Johan Klaesson and Tina Wallin spent many happy
hours together huddled over the crosswords in Svenska Dagbladet. Rose-Marie Wickström for all the help with everything, and for always being so cheerful to be around. Susanne Hansson for all the kind advice, support and help. Katarina Blåman, for always being so helpful in all aspects, nothing is ever too small or too big to get help with from Katarina. Sofie Granath for her tireless and always good-humored help and warm presence. Moreover, I would also like to thank Scott Hacker and Agostino Manduchi for being some of the best teachers I ever had. I want to thank Orsa Kekezi and Emma Lappi, my good friends, and comrades in arms, for boosting my morale in the past six months, and for the glorious quiz nights. I want to thank Toni Duras, Jonna Rickardsson and Tina Wallin for all the good advice, the laughs and good friendship. Pingjing Bo, Miquel Correa, Amedeus Malisa, Aleksandar Petreski my fellow PhD students and good friends, whom I have had a lot of fun with. I wish to thank those of the senior faculty who have come to my “tortures” and taken of their time to give me feedback and advice on my thesis: Mikaela Backman, Scott Hacker, Almas Heshmati, Johan Klaesson, Agostino Manduchi, Charlotta Mellander, Kristofer Månsson, Pia Nilsson, Paul Nystedt, Pär Sjölander and Andreas Stephan. I also want to thank the people whom i have been teaching with: Toni Duras, Amedeus Malisa and Kristofer Månsson - thank you for making it both fun and rewarding. I also would like to thank Fredrik Hansen, Anna Nordén, Lars Pettersson and Andrea Schneider for making this a friendly and warm workplace.
I also want to thank my coworkers at HFI, Oana Mihaescu and Niklas Rudholm, whom I have had the pleasure of coauthoring with. I also want to thank Anders Bornhäll, Elina Fergin-Wennberg, Anton Gidehag, Katarina Kilander and Hampus Poppius. Together with Sven-Olov, Oana and Niklas, you always brighten up my visits at HFI and make me feel welcome.
Last I would like to show my gratitude to my family and friends: my mother and father, Inger and Magnus Nilsson, my sister Karin, my brother in law, Johan, and my niece and nephew, Thea and Albert Hagaeus - for always being there for me and putting me in a good mood every time I see you or talk to you. I would also like to thank friends that go way back and whose company in my spare time has given me energy during these past five years: Ulrika Grundström, Elin Gabrielsson, Carin Blom, Johan Claar, Tobias Klingberg, Daniel Anstrin, Märta Mollén, Hanna Sundell, Anna Magnusson, Frida Eklund, Caroline Lind, Kristina Berg, Lisa Nilsson, Anna Lindh, Ann Bolin, Josefine Söderstedt, Therese Einarsson, Karin Persson and Karin sterner.
Thank you all. Helena Nilsson
This research is supported by Handelsrådet
(The Swedish Retail and Wholesale Development Council) and Handelns Forskningsinstitut (Institute of Retail Economics)
Abstract
This thesis is a compilation of four independent papers that examine the spatial process of retail location. The central question I ask is how changes in access to consumer demand affects retail in terms of size and survival. I empirically analyze these aspects on municipality, neighborhood and firm level using Swedish data from Statistics Sweden, HUI Research AB and Datscha Sweden.
The first paper (co-authored with Sven-Olov Daunfeldt, Oana Mihaescu and Niklas Rudholm) examines the effect of durable goods big-box retailer IKEA entry on retail net turnover and employment in the municipalities of entry and their neighbors. In the second paper I assess the effect of IKEA entry on firm level net turnover and employment of retail, restaurants, and accommodation firms at varying distances from the new IKEA. The third paper (co-authored with Johan Klaesson) addresses the relationship between entry of out-of-town located shopping malls and the exit of incumbent stores. We examine how the probability of exit relates to the order of the goods that are sold by the retailers and how local density of demand influences the outcome. In the third paper I examine changes in food store access by proximity on the neighborhood level and how this is related to population density.
Table of Contents
Abstract ... 7
1. Introduction ... 13
2. The road to modern retailing ... 17
2.1 Changes in supply ... 17
2.2 Changes in demand ... 19
2.3 Changes in public policy ... 21
3. Development in Sweden ... 23
4. Economic theory on spatial economics of retail location ... 29
4.1 The Isolated State ... 29
4.2 Bid rent ... 30
4.3 Central Place Theory ... 31
4.4 Hotelling’s principle of minimum differentiation ... 34
4.5 Spatial interaction models ... 35
5. Collection of Articles ... 38
References ... 42
Paper 1. What happens when IKEA comes to town? ... 51
1. Introduction ... 53
2. Previous studies ... 54
3. Data and matching municipalities ... 56
3.1 Data and descriptive statistics ... 56
3.2 Identification strategy ... 57
3.3 Matching procedure ... 58
3.4 Matching results ... 59
4. Effects of IKEA entry within a municipality ... 61
4.1 Difference-in-difference model ... 61
4.2 Results ... 62
5. Effects of IKEA entry on neighbouring municipalities ... 64
5.1 Empirical method ... 64
6. Summary and conclusions ... 68 Acknowledgements ... 70 Disclosure statement ... 70 Funding ... 71 References ... 71 Appendix A ... 74 References ... 81
Paper 2. IKEA entry - Effects on firms in retail and hospitality ... 83
1. Introduction... 85
2. Theoretical framework and previous studies ... 87
3. Data ... 90
4. Method ... 93
4.1 Impact evaluation ... 93
4.2 Modeling nonlinearity ... 97
5. Results ... 101
6. Discussion and conclusion ... 109
Acknowledgments ... 113
References ... 114
Appendix ... 118
Paper 3. Entry of malls and exit of stores - The role of distance and economic geography ... 129
1. Introduction... 131
2. Theory and related literature ... 134
2.1 Fundamental retail location theory ... 134
2.2 A monopolistic competition model of complementarity in retail . 136 2.3 Related literature... 138
3. Data and empirical design... 140
3.1 Description of data... 140
4. Empirical design and model ... 145
5. Empirical results and interpretation ... 146
5.2 Results for subgroups of retail industries ... 149
5.3 Duration of effects ... 153
6. Concluding remarks ... 155
Acknowledgements... 157
References ... 158
Paper 4. Population decline and changes in food store proximity ... 161
1. Introduction ... 163
2. Background and motivation ... 167
3. Theory ... 172
4. Previous studies ... 175
5. Data ... 177
5.1. For whom has the distance changed? ... 180
6. Empirical design ... 185
7. Results ... 189
8. Discussion and conclusion ... 193
Acknowledgements... 196
References ... 197
Appendix A ... 203
A1. Symmetric equilibrium ... 203
A2. Deriving equilibrium prices and profit function ... 203
A3. Endogenizing distance ... 206
Appendix B ... 207
1 Introduction
The retail sector is one of the more labor-intensive sectors in Sweden, and it employed close to six percent of the working population as of 20161. It is also a
large employer of the young and has been shown to offer important entry level jobs into the labor market overall but especially for younger individuals (Daunfeldt & Hortlund, 2014). Access to basic commercial retail services, such as food and drugstores is also an important part of a welfare state (Wiberg, 1983). As such the retail sector is of importance both as an employer and as a provider of basic retail services.
However, the traditional retail sector is an industry that is sensitive to spatial proximity to consumers; and therefore, it is important to study how the industry is affected by changes in consumer flows such as those caused by big-box (large-scale discount retailers) entries, a new mall or a long-term decline in the population size. By understanding the magnitude and direction of the externalities that arise from such changes in consumer flows, it is possible to minimize the negative externalities and optimize the positive externalities. This knowledge is therefore of importance for national as well as local policy makers. In this thesis I examine how changes in consumer demand flows affects retail firms in terms of size and survival on municipality, neighborhood and firm level. As such, this thesis places itself within the literature of regional economics.
“I'm all lost in the supermarket I can no longer shop happily I came in here for that special offer A guaranteed personality”
The Clash (1979) “Lost in the Supermarket”. Lyrics by Joe Strummer and Mick Jones.
The above phrase by The Clash describes rather well how far the retail format has evolved from the small, over-the-counter shops that characterized the retail sector 70 years ago into the maze-like behemoths that we see today. Shopping areas have existed for centuries; for instance, in ancient Greece, the Agora was an important shopping area, and the Bazaars in Jerusalem has been around for over 2000 years (Jackson, 1996). Since this time both consumer behavior and the organization of retail firms have evolved. However, the revolution that gave rise to the retailing landscape that we see today had in Europe its origins in the period after 1945 (Cliquet, 2006).
1 Calculations made by the author based on data from HUI Research 2018, available at: https://www.handelnisverige.se/ and Statistics Sweden, available at:
In the wake of two world wars, the western European market had an accumulated demand for consumer goods and an industry in need of reconstruction. This high demand combined with increasing wages and the technologies of mass production enabled retail as a sector to grow in scale and in volume (Huberman & Minns, 2007; Langer, 2012). Through the organization of retailers on an international level and the emergence of consumers with a demand for quality, the retail sector grew not only in size but also through differentiation. Increased car ownership and investments in motorways made it possible for retail formats to locate in growing suburbs where rents were lower and cars could gain access more readily. This development lead to that in mid-2010, the retail market was characterized by a few firms with a growing share of the market and an increasingly smaller population of small firms (Dawson, 2006). This trend has continued, and with the rise of online trade, the competitive climate for the stationary store has become fiercer.
The retail landscape has changed, as has the population distribution. After 1945, many areas in rural Sweden experienced depopulation (Li et al, 2016). When the market size declines, it becomes increasingly difficult to maintain commercial services as accessible for all parts of the population. This is a problem that is shared among a large part of postmodern economies (Grediaga & Freshwater, 2010).
The dynamics of retail location can best be understood in the context of location theory and are concerned with centripetal and centrifugal forces of colocation. In location theory, the clustering of firms in one location is incentivized by a number of positive externalities that arise from colocation. Based on the seminal contributions of Jacobs (1969) and Marshall (1821), Duranton and Puga (2004) defined the agglomeration economies of colocation into sharing, matching and learning. Firms benefit from colocation due to the sharing of indivisibles such as infrastructure and local suppliers. They also benefit from the improved results of matching that come with a larger local labor pool. Last, firms that are colocated benefit from knowledge spillovers that concern technology and innovations. For firms that are active in consumer services, there are also positive externalities from demand spillovers (Mulligan 2012). These spillovers arise due to decreasing consumer uncertainty and transportation costs through multipurpose shopping (Mulligan 1983; Ghosh, 1986) and comparison shopping (Eaton & Lipsey, 1979). These positive externalities contribute to the motivation for retail firms to colocate in clusters.
This effect that has a centripetal influence on firms’ tendency to colocate is in constant battle with the counterforce, i.e., the centrifugal effect of competition. Seen as an input product, consumer demand becomes a finite resource over which competition arises. The more similar products the retailers sell, the more similar the consumer demand that they compete over is, and the fiercer is the competition. This point of view can be traced back to organizational theory (e.g., Hannan and Freeman, 1972). The effect of competition is therefore a negative externality that stems from colocation of firms that sell similar products. Firms located in other retail clusters are also affected by competition. As shown by Huff (1964), the
probability of a consumer visiting one retail cluster is inversely related to the distance to it and the relative attractivity of competing shopping destinations. Thus, the negative externalities of competition exist also between retail clusters.
In essence it all boils down to the flows of consumer demand. The retail sector is of course highly heterogeneous. A grocery store is not affected by a change in consumer flows in the same way as a store that sells furniture. The reason behind this is that the two stores have a different market reach. If we assume that population is uniformly spread out on a featureless plain, then the size of the required market to break even on sales and costs of production corresponds to a market area of a certain size. The distance from the center to the perimeter of this market area is termed the threshold distance. In central place theory (Christaller, 1933; Loesch, 1964), a consumer’s demand for a specific product is a decreasing function of distance, and hence, the willingness to buy a product drops to zero when the distance to the store that sells a product becomes too large. The distance from the consumer to this point in space is termed the range. If the threshold distance overlaps the range, a firm will make a profit; however, if there is a gap, then the firm will operate at a loss.
In the long run, due to the forces of a competitive market, firms operate at zero profit, and therefore, the range and the threshold distance coincide. The distance between two firms that sell the same product depends on the threshold distance and the range. As grocery firms tend to have low production costs compared to a furniture dealer, the grocery store will have a smaller threshold distance. Since consumers are willing to travel a shorter distance to obtain the cheaper and more frequently bought goods of a grocery store, the grocery store also have a smaller range. The grocery store is therefore of a lower order than the furniture dealer. The spacing between lower-order retailers is thus smaller than that for higher-order goods retailers. Hence, the frequency with which we may observe food stores is higher than it is for furniture dealers. It also means that within the market reach of a furniture dealer, there may be many food stores, but the reverse does not hold.
What happens to incumbent retailers in a market when consumer flows change? Consumer flows can be affected by the entry of a large-scale discount retailer or a new retail cluster that attracts consumers. The effects on the incumbent retailers will consist of a mixture of positive externalities from demands spillovers and negative externalities of competition. How the incumbent retailers are affected depends on the order of the goods that they sell, the order of the goods offered by the new entrant, if they are complements or substitutes and where they are located. In three chapters I examine how incumbent firms are affected by a change in consumer flows. Together with Sven-Olov Daunfeldt, Oana Mihaescu and Niklas Rudholm, we analyze the effects of big-box entry on retail sales and employment at the municipality level. I also examine the same phenomenon at the firm level on incumbent firms in retail and in related sectors: accommodation firms and restaurants at varying distances. Together with Johan Klaesson, I analyze also the effects of out-of-town shopping malls on the exit of incumbent retailers of higher- and lower order goods. In my last paper I explore
how lower order goods retailers, food stores, are affected by changes in consumer flows of the kind that occur gradually, depopulation.
The following section describes the evolution of the retail sector from 1945 to today in Western Europe and the drivers behind it. In section three I present the development of retail in Sweden. In section four, retail location in space is then discussed through the lens of retail location theory, and in section five, the chapters in the dissertation are summarized.
2 The road to modern retailing
The format of retail developed relatively slowly until the 20th century, and it was not until after the Second World War that the modern retail landscape that we see today began to emerge (Cliquet, 2006). From this point in time, the retail sector in Western Europe went through a series of radical structural changes that, as noted by Dawson (2006), can be described by three phases. The first phase began in the postwar era, which was characterized by a demand for volume and the rise of mass consumption and was influenced by the more mature US retail market. The second phase, Dawson argues, came about with a common market. The European Economic Community (EEC), for instance, increased the size and diversity of consumer demand for retailers, which encouraged increased differentiation in production. New groups of consumers emerged who valued variation in functionality and quality, and marketing became an important activity by which retail firms could reach a specific type of consumer.
The third phase came with the application of new technologies in information, production and logistics, which enhanced the efficiency across the supply chain and enabled global sourcing and the growth of global corporations such as Tesco and Carrefour. The evolution of the retail landscape that we see today is a product of the changed behavior of consumers but also that of the firms. While retailers are dependent on the whereabouts of consumers, consumers are also to some extent influenced by the location of the retailers (Forsberg, 1998). This endogenous relationship is evident in migration patterns of the population where not only economic opportunities incentivizes migration, but also access to amenities (e.g. Biagi et al, 2011).
2.1 Changes in supply
In the years after the Second World War, the industry in Europe was in need of reconstruction, and different programs, such as the Technical Assistance Program under the lead of the US, were implemented to aid in the rebuilding. Through these programs, the import of American goods and media, technologies of mass production and retail management systems were introduced in the European retail market (Langer, 2012).
The introduction of self-service in stores lowered the staff costs and enabled the growth of larger stores with a more varied assortment. Mass production technology increased the volumes that could be produced to meet demand, and it also enabled the standardization of packages that were needed in the self-serviced stores. Other influential methods included ways to manage stocking and distribution, where the technology of stock control (such as RFID) enabled lower
costs (Langer, 2012). Other innovations were the in-store freezer (Finstad, 2012) and the use of bar codes (Menneke, 2012).
As the economies of scale grew, so did the format of retail stores. In the 1970s and 1980s, large-scale retail stores became a common sight in the outskirts of towns and cities (Dawson, 2006; Langer, 2012). The many and small independent shops that had long characterized the industry were slowly phased out in favor of the larger and more efficient self-service formats of department stores and supermarkets (Dawson, 2006; Langer, 2012).
The role of marketing and advertisement also grew in importance during this period. As argued in Jessen and Langer (2012), the introduction of the self-service system in grocery stores led to a focus on packaging and within-store advertising. What had been communicated to the consumer by the sales clerk now had to be conveyed by the packaging. Marketing and advertisement now became a powerful tool by which to influence the purchase behavior of consumers.
While a substantial part of the retail know-how came to the Western European economies through media, imports and the entry of retail chains, there was a simultaneous demand for knowledge on behalf of the retailers in Europe (Scott & Friedenson, 2018). This was reflected in the general interest of retailers in Europe, for instance, in Western Germany, to visit and observe the American retail markets (Langer, 2012). There was also an active exchange between retailers in different European countries through organization in retail cooperatives, associations and chambers of commerce.
Through these methods of cooperation, innovations in retail were diffused to members in other countries. On the European level, there also arose networks that consisted of representatives of several countries who focused on increasing the efficiency of distribution. An example of these networks was the European Packaging Federation. In 1957, the European Economic Community was introduced, and this became an arena in which issues facing the retail sector could be discussed in a political setting (Langer, 2012).
Another trend has been toward the expansion of firms’ activities; retailers have over the years extended their product assortment in terms of both goods and services. One example of this is clothing and apparel retailers extending their assortment to include also home decoration (Dawson, 2006). Another example is home delivery or furniture assembly (Burt 2010). Another trend has been the rise of private-label products. For instance, in 2013, one-third of the consumer-packaged baskets in Europe consisted of private-label brands (Nielsen, 2014). By encompassing a wide variety of activities and relying increasingly on own labels, the retailer as a brand has developed into a concept that encompasses not only the item but also the store and the organization behind it (Burt 2010).
The channels within which retail firms operate have also changed. The formerly single-channel retail formats—physical stores, telephone calls, mail order or catalogs—have over time adapted to incorporating multiple channels (Verhoef et al., 2015). Since 2005, when online trade became commonplace, many retailers have incorporated an online platform as an additional channel to be active within (Ellis-Chadwick, 2018). Despite these adaptations, online retail
is viewed as a fast growing threat to the traditional physical stores, and indirectly, the vitality of the places where they are located, such as town centers (Wrigley & Lambrini, 2014). The online retail platform has grown fast - for instance, in Sweden, online retail purchases increased tenfold from 6.8 billion SEK in 2004 to 67 billion SEK in 2017. However, when observed in relation to retail turnover overall, the share of this platform is still relatively marginal—it has increased from 1.6 percent to 10.1 percent of the total retail (HUI Research, 2018).
Figure 5. Online and offline retail trade volume in Sweden between 2004 and 20172.
2.2 Changes in demand
As retail firms have evolved, so has consumer behavior. After the Second World War, the living standards improved for great parts of the population in Western Europe, which influenced retail consumption. Wages grew, and a rising share of women joined the labor force. More women in the labor force also increased the average household income and the purchasing power of households (Bromley & Thomas, 2002). The sizes of households decreased in many European countries, which led to a growth in the demand for durable goods such as television sets and household appliances (Leflang & Van Raaij, 1995).
There was also a change in where people worked and lived and how they transported themselves. Since the 1960s many countries in Europe had prioritized
2 Calculations based on data Statistics Sweden, available at
http://www.statistikdatabasen.scb.se/pxweb/sv/ssd/START__NR__NR0103__NR0103E/NR0103ENS201 0T06A/ 0 100000 200000 300000 400000 500000 600000 700000 2004 2005 2006 2007 2008 2009 2010 2011 2012 2013 2014 2015 2016 2017
Online and offline retail trade volume. MSEK
Online retail net turnover Retail net turnover
is viewed as a fast growing threat to the traditional physical stores, and indirectly, the vitality of the places where they are located, such as town centers (Wrigley & Lambrini, 2014). The online retail platform has grown fast - for instance, in Sweden, online retail purchases increased tenfold from 6.8 billion SEK in 2004 to 67 billion SEK in 2017. However, when observed in relation to retail turnover overall, the share of this platform is still relatively marginal—it has increased from 1.6 percent to 10.1 percent of the total retail (HUI Research, 2018).
Figure 5. Online and offline retail trade volume in Sweden between 2004 and 20172.
2.2 Changes in demand
As retail firms have evolved, so has consumer behavior. After the Second World War, the living standards improved for great parts of the population in Western Europe, which influenced retail consumption. Wages grew, and a rising share of women joined the labor force. More women in the labor force also increased the average household income and the purchasing power of households (Bromley & Thomas, 2002). The sizes of households decreased in many European countries, which led to a growth in the demand for durable goods such as television sets and household appliances (Leflang & Van Raaij, 1995).
There was also a change in where people worked and lived and how they transported themselves. Since the 1960s many countries in Europe had prioritized
2 Calculations based on data Statistics Sweden, available at
http://www.statistikdatabasen.scb.se/pxweb/sv/ssd/START__NR__NR0103__NR0103E/NR0103ENS201 0T06A/ 0 100000 200000 300000 400000 500000 600000 700000 2004 2005 2006 2007 2008 2009 2010 2011 2012 2013 2014 2015 2016 2017
Online and offline retail trade volume. MSEK
the construction of motorways, and with an increasing share of the population owning a car, a trend in suburbanization of residents and firms took place (Hall, 1993).
The suburbanization of both residents and retailers became more common in many Western European economies in the 1970s and 1980s (Guy & Lord, 2002), and urban sprawl characterizes many European cities also in the modern day (Arribas-Bel et al., 2011). The dispersed spatial configuration, which increases the costs of public service provision and infrastructure (Varela-Candamio et al., 2019), also displaced the centrality of the city centers. For the rising share of car owners, the retail in the suburbs was more accessible compared to that in city centers that were more congested and where parking was expensive (Guy & Lord, 2002). Bromley and Thomas (2002) argue that once women joined that labor force they had less time to spend on grocery shopping than they had previously. This entailed that the more easily accessible and fully stocked grocery stores in the suburbs became favored over smaller specialized stores in the city centers.
The role of retail consumption also evolved in this time period. Not only did the wages increase, but there was also an increase in the time that could be spent on leisure activities. During this time, the working hours also decreased, which meant that people had more leisure time to spend. Gershuny (1987) studied the change in time spent on leisure activities between 1961 and 1985 for British adult men and women. In this time period, the time spent on out-of-home leisure activities increased by 35 minutes per day. Newby (1993) claims that some of this time was spent shopping for nonessential retail products, which he argues shows that retail consumption was engaged in for other than utilitarian reasons.
Retail consumption as something more than one’s satisfying material needs came to be an important topic in sociology in general in the 1990s, but the topic attracted attention in the 19th century. The 19th century sociologist and economist Veblen argued in his work “The Theory of the Leisure Class” (1912) that the consumption of luxury goods by the newly rich in North America was a way to express their social status and distinguish themselves from the working classes. He referred to this as “conspicuous consumption”.
Another contemporary sociologist, Simmel (1903), described how consumption by metropolitan residents in Berlin was a way to express their identity and stand out in an anonymous environment. The role of retail as something more than satisfying one’s needs became more apparent with the start of the mass consumption that took place in the early 20th century in the US and the 1950s in Western Europe. With the lower prices of products that came with the methods of mass production, consumption became available for a greater part of the population.
As consumers began to differentiate their tastes and choices of products, retailers began to use advertising to target groups of consumers based on, for instance, income and occupation. This enabled the modern consumption of goods to express social status (Bocock, 1993). By the 1970s and 1980s, new groups of consumers had developed. The sociologist Featherstone (1991) argues that for these groups, consumption aimed to express identity that was detached from
socioeconomic class. This pattern of consumption of different groups in this era could no longer be determined by fixed characteristics such as social class. This is in contrast to the consumption patterns that were noted by Veblen and Simmel, where there was a clear demarcation of social status related to income or other socioeconomic characteristics that drove consumer behavior (Bocock, 1993).
Retail consumption behavior has also been studied within the context of recreational shopping. In this literature, it has been argued that the main reason for shopping is the enjoyment of the activity, and current hedonic shopping, in the form of shopping tourism, has become an important economic factor in many countries (Timothy, 2005). In Sweden, for instance, the expenditures from shopping tourism increased from 34 billion SEK to 100 billion SEK between 2000 and 2018, and in 2018, these expenditures made up 13 percent of the net turnover in retail in Sweden3. The importance of retail is reflected also in its role of an
amenity and studies have found that retail consumption possibilities are positively correlated with housing prices (e.g. Öner, 2017; Daunfeldt et al, 2019).
2.3 Changes in public policy
Out-of-town shopping and retail parks has been argued to present threats to the downtown shopping streets as national chains often moves into such parks (Jones, 2010). In some countries, such as the UK, city center revitalization programs, such as festivals and pedestrianization, have been used. Often, these programs have been implemented in combination with restrictive regulations of retail locations in competing places around the town (Guy & Lord, 1993).
Unlike many other countries, such as the Netherlands and the UK (Guy, 1998; Guy, 2006), there has never been any formal institution in Sweden that makes decisions regarding land use; rather, it has been up to each Swedish municipality to make these decisions (Forsberg, 1998; HUI Research, 2014). Before the 1980s in Sweden, however, there was strong public resistance against the development of outside-of-town retail clusters. As in the UK, this resistance was coupled with a focus on revitalizing the urban milieu (Forsberg, 1998). In the 1970s, the focus was on the renewal of inner cities, and many streets in Swedish cities were pedestrianized, i.e., closed off to cars, to encourage the use of inner cities for leisure. This process had already begun in the 1950s, but the peak of city revitalization occurred between 1970 and 1975 (Nordqvist, 1984). Here, retail was an important factor in the form of department stores. Department stores, which had breadth but not so much depth in their product assortment, were soon replaced by chain stores in city malls and thus retail came to function as anchors in pedestrian areas (Bergman 2003).
After the 1980s, the general attitude changed, and an increasing number of municipalities in Sweden allowed outside-of-town retail shopping, which became increasingly common in Swedish towns and cities (Forsberg, 1998). The
out-of-3 https://www.svenskhandel.se/globalassets/dokument/aktuellt-och-opinion/rapporter-och-foldrar/shoppingturism/shoppingturism-i-sverige-2019.pdf
town development has in general been considered a threat to the survival of smaller-scale retailers that are often found in city centers.
3 Development in Sweden
In Sweden, there has been a similar development as that which has occurred in the rest of Western Europe. Although the industry was largely intact after the wars, the rationing years had caused an accumulated demand for consumer goods. The demand for volume in combination with the new practices of retail management, from which Sweden was no exception, contributed to the growth of larger store formats. In the 1950s, the first self-service stores were introduced, and the previously independent specialized food stores, such as butchers and bakeries, soon became fewer in number, while the number of the larger supermarkets increased.
Discount retailing increased in the later part of the 1970s in the form of smaller stores in town centers, and between 1980 and 1990s, large-scale discount stores and outlets grew in the out-of-town areas (Forsberg, 1998; Kärrholm, 2016). This development was encouraged by the increase in car ownership, which, as in the rest of the Western European economies, had increased since the 1950s and enabled large-scale retail to increase its market reach.
The development was also helped by a trend in suburbanization taking place in the 1960s and the 1970s, in which residential areas were built in the outskirts of many Swedish cities through the Million Homes program, where one million homes were to be built in a time period of ten years (Kärrholm, 2016). In this period, the market became increasingly dominated by a few retailers, while the number of independent retailers declined (Widerstedt et al., 2006). The change that took place between the 1950s and the end of the century is dramatic; between 1950-1997, the number of convenience stores decreased from 39,000 to 6,900, and in the period of 1960 to 1997, the number of hypermarkets increased from 25 to 2,060 (Jacobsson, 1999).
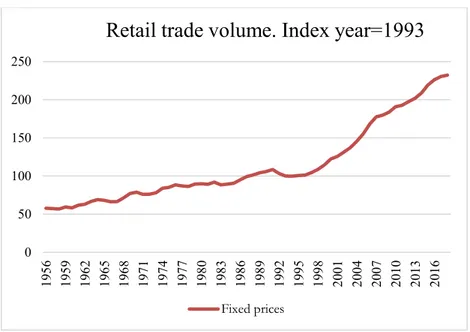
Figure 1. Retail sales, trade volume, 1956-20184.
Since the early 1950s, retail in Sweden has continued to grow at an unabated pace. Between 1956 and 1990, the trade volume increased by 50 percent. Following the recession in the start of the 1990s, however, an even larger growth spurt took place. Between 1994 and 2018, retail trade volume increased by another 125 percent. Figure 2 shows the composition of the growth between 1991 and 2018, and it is durable goods (e.g., furniture, electronics and so forth) that have driven the growth, while groceries, or convenience goods, have grown at a slower pace (HUI Research, 2018).
4 Calculations made by the author, based on data from Statistics Sweden, available at
https://www.scb.se/en/finding-statistics/statistics-by-subject-area/trade-in-goods-and-services/domestic- trade/turnover-in-the-service-sector/pong/tables-and-graphs/retail-trade/retail-trade-sales-volume-annual-rate-year/ 0 50 100 150 200 250 19 56 19 59 19 62 19 65 19 68 19 71 19 74 19 77 19 80 19 83 19 86 19 89 19 92 19 95 19 98 20 01 20 04 20 07 20 10 20 13 20 16
Retail trade volume. Index year=1993
Fixed prices Figure 1. Retail sales, trade volume, 1956-20184.
Since the early 1950s, retail in Sweden has continued to grow at an unabated pace. Between 1956 and 1990, the trade volume increased by 50 percent. Following the recession in the start of the 1990s, however, an even larger growth spurt took place. Between 1994 and 2018, retail trade volume increased by another 125 percent. Figure 2 shows the composition of the growth between 1991 and 2018, and it is durable goods (e.g., furniture, electronics and so forth) that have driven the growth, while groceries, or convenience goods, have grown at a slower pace (HUI Research, 2018).
4 Calculations made by the author, based on data from Statistics Sweden, available at
https://www.scb.se/en/finding-statistics/statistics-by-subject-area/trade-in-goods-and-services/domestic- trade/turnover-in-the-service-sector/pong/tables-and-graphs/retail-trade/retail-trade-sales-volume-annual-rate-year/ 0 50 100 150 200 250 19 56 19 59 19 62 19 65 19 68 19 71 19 74 19 77 19 80 19 83 19 86 19 89 19 92 19 95 19 98 20 01 20 04 20 07 20 10 20 13 20 16
Retail trade volume. Index year=1993
Fixed prices
Figure 2. Retail sales, trade volume, 1991-2018. 5
Figure 3. Retail employment between 1993 and 20166.
5 Source Statistics Sweden Available at:
http://www.statistikdatabasen.scb.se/pxweb/sv/ssd/START__HA__HA0101__HA0101C/DetOmsAr07/#. 6 Source HUI Research 2018, available at https://www.handelnisverige.se/
0,0 50,0 100,0 150,0 200,0 250,0 300,0 350,0 400,0 19911993199519971999200120032005200720092011201320152017
Retail trade volume. Index year=1993
Total retail Convenience goods Durable goods
0 20 40 60 80 100 120 140 160 180 19 93 19 94 19 95 19 96 19 97 19 98 19 99 20 00 20 01 20 02 20 03 20 04 20 05 20 06 20 07 20 08 20 09 20 10 20 11 20 12 20 13 20 14 20 15 20 16
Retail employment. Index year=1993
Employment, retail index Employment, groceries index
Employment, durables index Figure 2. Retail sales, trade volume, 1991-2018. 5
Figure 3. Retail employment between 1993 and 20166.
5 Source Statistics Sweden Available at:
http://www.statistikdatabasen.scb.se/pxweb/sv/ssd/START__HA__HA0101__HA0101C/DetOmsAr07/#. 6 Source HUI Research 2018, available at https://www.handelnisverige.se/
0,0 50,0 100,0 150,0 200,0 250,0 300,0 350,0 400,0 19911993199519971999200120032005200720092011201320152017
Retail trade volume. Index year=1993
Total retail Convenience goods Durable goods
0 20 40 60 80 100 120 140 160 180 19 93 19 94 19 95 19 96 19 97 19 98 19 99 20 00 20 01 20 02 20 03 20 04 20 05 20 06 20 07 20 08 20 09 20 10 20 11 20 12 20 13 20 14 20 15 20 16
Retail employment. Index year=1993
Employment, retail index Employment, groceries index
In the same period, the number of employees in retail increased from 180,000 to 260,000 (HUI Research, 2018). Additionally, in this situation, the growth was driven by the durable goods sector. The relatively larger increase in turnover compared to that of employment also illustrates how productivity in the sector increased. Between 1993 and 2017, the value-added in retail increased by 170 percent7. The growth was not evenly distributed, however. The market
concentration also increased, and between 2000-2015, the share of chain stores increased from approximately 20 percent to 30 percent, while the market concentration of the ten largest retail firms increased by 50 percent. 8
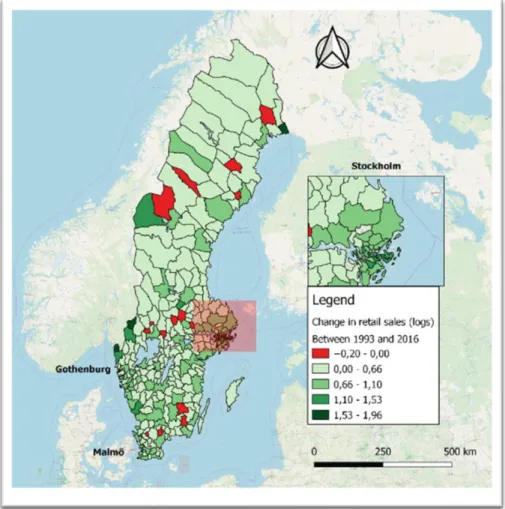
The concentration has also occurred in relation to space. In 1993, 75 percent of the sales in retail were concentrated to 88 of the 290 municipalities in Sweden. Over two decades later, in 2016, the same share of sales was concentrated to 65 of the municipalities, many of which were primarily urban municipalities in the larger-city regions9.
These are also the parts where the largest growth in sales and employment has occurred, as seen in Figure 1.
7 Calculations made by the author, based on data from Statistics Sweden, available at
http://www.statistikdatabasen.scb.se/pxweb/sv/ssd/START__NR__NR0103__NR0103E/NR0103ENS201 0T09A/
8 Calculations made by the author, based on register data from Statistics Sweden. 9 Calculations made by the author, based on data from HUI Research 2018, available at https://www.handelnisverige.se/.
Figure 2. Growth in retail employment between 1993 and 2016.10
10 Calculations made by the author, based on data from HUI Research 2018, available at https://www.handelnisverige.se/.
Figure 2. Growth in retail employment between 1993 and 2016.10
10 Calculations made by the author, based on data from HUI Research 2018, available at
https://www.handelnisverige.se/.
Figure 2. Growth in retail employment between 1993 and 2016.10
10 Calculations made by the author, based on data from HUI Research 2018, available at
Figure 2. Growth in retail employment between 1993 and 2016.11
Retail has grown not only in volume but also in relative importance for the economy. The value added in retail as a part of GDP grew from slightly under 3.3
percent in the early 1990s to 3.5 percent in 201712. Retail as a share of total
employment increased from 5.3 percent to 6 percent of total employment between 1993 and 2016. It is also a sector that is an employer of much of the young population; 57 percent of all employees in retail were between 16-34 years old in 2016 (HUI Research, 2018).
11 Calculations made by the author, based on data from HUI Research 2018, available at
https://www.handelnisverige.se/.
12 Calculations made by the author based on data from Statistics Sweden, available at
http://www.statistikdatabasen.scb.se/pxweb/sv/ssd/START__NR__NR0103__NR0103E/NR0103ENS201 0T09A/
4 Economic theory on spatial
economics of retail location
The location of retail is both an internal and an exogenous process. The progress in technological processes and economies of scale affects costs, which in turn affect prices and sales. One of the main determinants of retail location is inarguably, proximity to demand. As argued by Forsberg (1998), however, the behavior of consumers is also shaped by the retailing industry; thus, it is an endogenous process. The aim of this section is to provide an overview of the origins and evolution of the theories that are traditionally used in modern analysis of retail location. It begins, in section two, with a brief description of a partial equilibrium model of von Thunen (1826), which explained the agricultural land use around the center of a market. His work was an important influence in the formation of the four branches of location theory that traditionally have been used to model the retail in space (Brown 1993). The first of these is the bid rent theory of Alonso (1964), which extended the land-use model of von Thunen to an urban context. This is followed by a theory explaining the hierarchical structure of multiple centers, namely, central place theory (CPT), by Christaller (1933) and Loesch (1964), which provides a general equilibrium framework in which the incentives of clustering of different types of retail are explained. This is followed by the principle of minimum differentiation, which models the clustering of similar retail firms. Last, the relation between retail clusters is developed in spatial interaction theory, where consumer behavior is the focus.
4.1 The Isolated State
The origins of spatial economics are in many aspects regarded to be founded on a work by von Thunen’s (1826), The Isolated State (Fujita 2010), and this section will take this work as a point of departure. Based on his observations of agricultural land use in Germany in the early 1800s, Von Thunen modeled the allocation of different types of agriculture in relation to the center of a market.
The model, which may be described as a partial equilibrium model, i.e., explaining a part of a closed system, consisted of one state, with a center at which all products were exchanged. The location of different farmers was a function of transport costs, nonland costs (labor, etc.) and land rent, where the proportions of the latter two were fixed (McCann, 2013). The further away from the center, the lower the cost of land, but at a trade off with increased costs of transportation to the market. Von Thunen argued that there would be a natural organization of agricultural activities that was determined by the size of the yield minus costs of production and transportation, the profit. By market forces, the farm making the highest profit would also be able to pay the highest rent for the land. Therefore,
the resulting location of a farmer was the result of production costs, transport costs and land rent. This process created a demand curve that would be regularly downward sloping in all directions from the center, with a different slope for each type of agriculture. From a top-down point of view, the changes in the slope of the demand curve would form concentric rings, which came to be termed von Thunen rings (Fischer, 2011).
4.2 Bid rent
Building on the ideas of von Thunen’s rings and Hurd’s (1968) and Haig’s (1926) observations of the tendency of rents to be the highest in the city center led to the formulation of the bid rent theory by Alonso (1960; 1964). In Alonso’s model, the agricultural market center became the central business district (CBD), and agricultural production was shifted out from the core and replaced by businesses, followed by residents and, in the periphery, agricultural land use.
The bid rent theory is based on the assumption of a homogeneous plain, where land prices (transport costs) declined (increased) uniformly as the distance to the center of the market increased. Moreover, the theory is based on the idea of rational utility maximizing and perfectly informed sellers and buyers, as well as a perfectly functioning property market. The theory came to be characterized by a monocentric metropolitan area, where firms and individuals covet the location in the center and pay accordingly (Kivell & Shaw 1980; Dicken & Lloyd, 1990). A bidding process would thus ensure that the agents with the largest surplus after deducting their land rent and transportation pay the highest rent for the optimal location. The agents would thus trade off access to the market and land rent, and the different combinations that generated the maximum surplus (utility for individuals and profits for firms) form the bid rent curve, where the slope represents the marginal cost of distance. The individual equilibrium location for each agent would then be the point at which the lowest bid rent curve is tangent to the market rent (Alonso, 1960).
However, as in the von Thunen model, different sectors have different sensitivities to the costs of transportation and land price, and hence, a variation in the willingness to pay results in a concentric ring pattern where firms are closest to the core, followed by residents and agriculture, where each sector has an increasingly flatter slope of the demand curve (Kivell & Shaw 1980; Dicken & Lloyd, 1990). A similar organization for retail at the intrasectoral level was suggested by Firey (1947) and later by Garner (1966). Garner equated retailers requiring a high demand to break even on costs and sales with a high ability to pay rent. He argued that these firms would, according to the relative importance of distance over rent, have a higher marginal cost of distance and hence a steeper bid rent curve and therefore would be willing to pay the higher rents of a central location. This organizational structure could also be shown to hold at the micro level, as illustrated by Scott (1970). Scott (1970) found that higher-order goods retailers—such as department stores and specialized goods stores—are located in
the areas that are the closest to the consumers and with the highest rents. Moreover, he found that the steepness of the bid rent curve, which reflects the sensitivity to consumer access, is less steep for grocery stores than for less frequently bought and more expensive goods.
The model was not without criticism, however; in Richardson’s (1977) study, the gradient of the rent curve was even found to be positive. Other critiques against the bid rent model have been that it assumes a monocentric model, which means that empirical evidence of increasing decentralization (as noted by Mills 1967) and the possibility of multiple centers is not possible in the framework of the model. This critique was accommodated in the Fujita and Ogawa (1982) model, in which a polycentric urban structure was incorporated.
Further improvements were made to make the model more realistic. For instance, in Alperovich and Katz (1985), the bid rent theory is developed to also take into consideration uncertainties in terms of price, transport rate and output uncertainty; thus, the idea that consumers are fully informed was relaxed. In Abdel-Rahman (1990), it could furthermore be shown that both localization and urbanization economies could be incorporated into the bid rent model.
The model has also been widely used in its extended version, the Alonso-Muth-Mills model (Mills 1967; Muth 1969), to demonstrate the demand for residential housing as a function of amenities and housing costs to explain the within-metropolitan spatial equilibrium and the between-metropolitan spatial equilibrium in the Rosen (1979)-Roback (1982) model. Another area of critique that is common to all the models reviewed herein is that the bid rent theory models the outcome of a dynamic process, for which there is no theory. The argument is that there is no theory that explains the creation of the existing urban system, only its growth; in other words, the bid rent theory is a-historic. Therefore, there have been attempts to incorporate dynamic processes into land-use models using simulation techniques, as was done, for instance, in White and Engelen (1993). Despite its shortcomings, the essence of the bid rent theory remains, and it has been applied in a variety of retail contexts, such as inside shopping centers, for instance, in Charles & Kerry (2005).
4.3 Central Place Theory
While von Thunen and the bid rent theory explained the organization of activities around a single center, Christaller (1933) attempted to model how multiple centers were organized in relation to one another. Inspired by von Thunen, Christaller modeled the observed location of places and their internal hierarchy as part of a system. Hence, rather than modeling a partial equilibrium, as in Thunen’s isolated state model, he attempted to model the determinants of a general equilibrium. The model that he used to explain the organization in relation to space is named central place theory. Christaller assumed a smooth plain over which people and resources are homogenously distributed. On the plain, there are producers of goods or services, termed functions, which operate on a market characterized by perfect
competition. Due to transport costs, it is assumed that individuals always traveled to the closest function to obtain a product. Additionally, it is assumed that only one purchase is conducted per trip. Moreover, the model assumes that to break even on costs and revenues, the firm needs to cover a certain demand, termed the threshold demand. Given that consumers are evenly distributed, the threshold demand corresponds to a certain distance from the center of the market area to its perimeter, which is termed the threshold distance. For goods that have higher costs of production and are bought less frequently by the consumers, i.e., higher-order goods, the threshold distance needs to be larger compared to firms selling goods or services that are less expensive to produce and bought more often, i.e., lower order. As the distance to the provider of a good increases, the higher the transport costs are for a consumer to obtain it. Thus, from the consumer’s point of view, the demand for a good declines with distance, and at a specific point in relation to space, termed the range, the demand drops to zero. Consumers are typically willing to travel a longer distance for higher goods that are bought less frequently, and the opposite holds true for goods that are bought more often; thus, like the threshold distance, the threshold range varies with the order of a good. Consequently, the distance between firms selling lower-order goods is smaller compared to that of firms selling higher-order goods (Dicken & Lloyd, 1990).
Just as retail firms have varying degrees of order, so do places. A place’s order in a hierarchy is an aggregate of the orders of the firms that are located within it. Thus, the differences in the level of the orders in combination with the friction of space, according to Christaller, explain the static organization of places, where some, due to a due to their relative order, are more central than others. Christaller argued that in each high-order place, all orders of functions below it can be found, while in the lower-order places, only lower-order functions are located. This range of function or of a place forms a circle—termed the demand cone—within which the population is the potential market. There is no point for a second location of production to locate within this area; hence, a producer of a similar good will locate outside this circle. Consequently, higher-order goods or places will have larger market areas, and higher-order places will also encompass lower-order functions. In the manner of fractals, these are organized identically and rigidly throughout the isotropic plain (Dicken & Lloyd, 1990).
Using the same principles of range and threshold and the friction of distance, Loesch (1954) reformulated the theory of central places into one less rigid. For instance, this model allows for the existence of single-function centers that are not necessarily of the lowest order. Moreover, centers of the same size and order might produce a different variety of goods; therefore, the existence of specialized production centers is a possibility. Moreover, instead of arranging the movement of people and goods through places, as in Christaller’s model, Loesch’s version of the CPT organizes transportation to travel via discrete routes. This, together with the specialized production centers, enable the model to accommodate an unevenly distributed population. The effects of these modifications gives rise to the possibility for places of equal order to have threshold demands that are of unequal size. The sizes of the market thresholds are thus smaller in more
population-rich areas or closer to more centralized places. Loesch’s contribution allows for a more flexible system of places that largely mirror the tendency of people and firms to follow the road of least friction while preserving the fundamental role of the friction of distance in the original model (Dicken & Lloyd, 1990).
The ideas of Loesch and Christaller have been tested empirically for a range of different sectors. The perspective has included both the supply side and demand side. From the point of view of the supply side, Berry and Garrisson (1958) showed that the threshold levels necessary to maintain the presence of a variety of retailers are positively related to the order of the goods they provided. From a demand point of view, Ray (1967) showed by measuring the so-called desire lines, which are the distances that individuals are willing to travel for different purposes, that a similar relationship existed between the order of a good or service and individuals’ willingness to travel to obtain them.
Although influential, CPT has received critique for a variety of shortcomings. One of these is the assumption that consumers travel to the nearest shop to purchase a product and that they only do single-purpose shopping. Early on, findings by Golledge et al. (1966), as well as Ray (1967), challenged this assumption. In these two studies, it was found that for higher-order goods, people tend to be willing to travel beyond the nearest shop, often to places where there are other stores selling higher-order goods as well. The explanation for this behavior is that consumers tend to purchase many products at once, which is termed multipurpose or one-stop shopping. O’Kelly (1981) showed, for instance, that 50 percent of nonwork trips were multipurpose. The locational choice of retail as an explicit effect of consumer behavior was later incorporated into the central place theories framework by O’Kelly (1983). Ghosh and McLafferty (1984) suggested that consumers engage in multipurpose shopping to reduce transport costs as well as storage costs. This cost-minimizing behavior was incorporated into CPT as a simultaneous problem in Eaton and Lipsey (1982), extended into a two-goods model in Ghosh and McLafferty (1984) and later extended into a model that allowed multiple goods by Ghosh (1986). In the latter model, it could be shown that an agglomeration of stores produces economies of scale for the consumer regarding transport costs. Therefore, it could be shown that firms have an incentive to locate in proximity with firms that sell dissimilar goods to benefit from the consumer’s cost-reducing behavior.
Another aspect for which CPT has been criticized is that it is static. Thus, the model simply models the observed allocation of places and is not derived from economic theory (Fujita et al, 2001). Several attempts have been made to make a dynamic CPT model. One of the earliest attempts was that of Rushton (1971), in which he managed to explain the formation of a central place equilibrium. Another example is White’s (1974, 1977) model of a dynamic central place, which explains the emergence of different hierarchies within a central place system (Mulligan, 1984). Other extensions of the CPT involve self-organizing systems, such as that of Allen and Sanglier (1979) and chaos theory (e.g., Arlinghaus, 1985; Chen & Zhou, 2006). Other ambitious models of increasing
complexity have been that of Morill (1962), Bura et al. (1996), Allaway et al. (1994), Tobler (1979) and Couclelis (1985; 1997).
4.4 Hotelling’s principle of minimum differentiation
While the attempts to explain the agglomeration of similar retail firms have been successful within the CPT framework, the explanations for the much-observed agglomeration of homogenous retailers in a CPT framework have been less successful. The models that were successful in this framework instead stemmed from Hotelling’s (1929) principle of minimum differentiation (Brown, 1989). The principle of minimum differentiation is a two-stage game of how two firms of varying degrees of differentiation should locate on a market. In its initial form, it is a straight-line model that shows that two firms operating in the same market and with the same goods should cluster to optimize profits (Brown, 1993).
Not initially applied to the retail sector, the model later became associated with the agglomeration of retailers, and the most recurrent application involves two ice-cream dealers choosing the optimal location along a stretch of beach (for instance, Puu, 2002). Hotelling’s model assumes that there exist two firms that are perfectly informed and operating on a straight-line market with zero relocation costs and no competition in price. The likewise perfectly informed and utility maximizing consumers are evenly distributed on the market, with zero transport costs and homogenous demand. The model shows that (even with the assumption of transport and relocation costs) the firms will locate close to one another in equilibrium (Capello, 2007).
The model has been criticized for a variety of reasons based on its assumptions. One of the criticisms is that the equilibrium is stable only for two firms; Lerner and Singer (1937) showed that once a third firm is introduced, the equilibrium ceases to exist. Another critique is that of d’Aspremont et al. (1979), who showed that the center location no longer is sustainable once the assumption of no price competition is relaxed and that instead, the equilibrium exists when the two firms are located at opposite ends. However, once some additional assumptions were relaxed, such as the assumption of perfectly informed firms, the model improved drastically (Brown, 1993). Webber (1972), for instance, argued that firms were likely to collocate in such a way as to reduce uncertainty regarding industry knowledge. In his 1972 extension of the Hotelling model, Weber therefore introduced risk reduction of the firm as a positive externality of agglomeration. The model could thus explain the clustering of similar firms.
Further improvements came when additional agglomeration externalities were incorporated in the model. Eaton and Lipsey (1979) showed that one such externality from colocation came from the reduction in consumers’ transportation costs. By introducing a degree of uncertainty for the consumer through the addition of comparison shopping, Wolinsky (1983) showed that the benefits of colocation (in the form of reduced uncertainty) more than compensated for the negative effects of competition. Other improvements worthy of mention are that