r 82 - 1992
ollision Avoidance Systems - Effects of different levels of task allocation on driver behaviour
Lena Nilsson and Håkan Alm, Swedish Road and Traffic Research Institute, Sweden
iel Janssen, TNO Institute for Perception, The Netherlands
VTI särtryck
Nr 182 - 1992
Collision Avoidance Systems - Effects of different levels of task allocation on driver behaviour
Lena Nilsson and Håkan Alm, Swedish Road and Traffic Research Institute, Sweden
Wiel Janssen, TNO Institute for Perception, The Netherlands
Reprint from DRIVE Project V1041 (GIDS), Sept. 1991
div
Väg-och Trafik-/
[nå/"mm
Drive Project V1041
Generic Intelligent Driver Support Systems
Collision Avoidance Systems - Effects of different levels of task allocation on driver behaviour
Lena Nilsson
Swedish Road and Traffic Research Institute (VTT),Linköping, Sweden Håkan Alm
Swedish Road and Traffic Research Institute (VTT),Linköping, Sweden Wiel Janssen
TNO Institute for Perception, Soesterberg, The Netherlands
Deliverable report GIDS/MAN3 Workpackage Manoeuvring
Workpackage Leader: Wiel Janssen, TNO Institute for perception, Soesterberg
Traffic Research Centre, University of Groningen P.O. Box 69, 9750 AB Haren, the Netherlands Fax: +31 50 636784
The work in this publication is part of the project "Generic Intelligent Driver Sup-port Systems! (GIDS) carried out under the contract DRIVE V1041] of the Euro-pean Community; in which the Traffic Research Centre, University of Groningen acts as a prime contractor and Delft University of Technology, INRETS-LEN, Philips Research Laboratories, Saab Scania, TNO Institute for perception, YARD Ltd., MRC-Applied Psychology Unit, Tregie Groupe Renault, VTT, University of the Armed Forces Munich, University College Dublin, BMW AG are presented as partners. The opinions, findings and conclusions expressed in this report are those of the authors alone and not necessarily reflect those of the EC or any other organ -ization involved in the project.
© 1991, Traffic Research Centre, University of Groningen, the Netherlands All rights reserved. No part of this publication may be reproduced, stored in a re-trieval system or transmitted in any form or by any means, electronic, mechanical, photocopying, recording or otherwise, without the priorpermission in writing of the copyright owner.
CIP-gegevens Koninklijke Bibliotheek, Den Haag
Collision avoidance systems - effects of different levels of task allocation on driver behaviour / Lena Nilsson, Håkan Alm and Wiel Janssen - Haren: Traffic Research Centre, University of Groningen.
Drive Project V1041: Generic Intelligent Driver Support Systems. - Deliverable GIDS/MAN3: Workpackage Manoeuvring. With references.
ISBN 9(0-6807-227-7
Main Objective
Impact
Technical Approach
Preface
Än overview of DRIVE project V1041
The overall objective of the GIDS project (DRIVE V1041) is to determine re-quirements and design standards for a class of generic intelligent driver support (GIDS) systems which will conform with the information requirements and per-formance capabilities of the individual human driver. The project will provide recommendations for such systems and an operational prototype will be develo-ped in order to demonstrate some of the essential features of the GIDS con-cept.
The GIDS project is an important, innovative step towards the development and implementation of an in-vehicle '*knowledge refinery.' It is designed to ac-cept information from sensors and dedicated driver support applications, and to filter, integrate, and present this information in ways which are consistent with the intentions and capabilities of individual drivers. The GIDS approach will provide recommendations to a broad spectrum of users, including man-ufacturers of dedicated driver support systems and road traffic authorities. In GIDS, the question as to how intelligent driver support should be structured is stated in terms that are consistent with the present state of the art of road transport informatics (RTT) and behavioural science methodology. The follo-wing aspects are taken into consideration:
- Environmental conditions. These are integrated into a coherent *'small world," a set of conditions that allow a driver to perform in a relevant sub-set of frequently occurring situations, including a roundabout, T-junctions, an intersection, and curved roads. The 'small world' guides much of the empirical research in GIDS, since it can be implemented in the real world, as well as in driving simulator studies and computer simulations;
- Subtasks of the driving task. These will be geared to the constraints impo-sed by the 'small world' and include entering and exiting a roundabout, turning, merging, negotiating an intersection, curve tracking, car following, and overtaking. Together they form a small but non-trivial set of (sub)tasks for which a computational description can be developed;
- Support functions. These derive from the GIDS aim to provide driver sup-port at each of the principal levels at which road users must cope with their task: planning (navigation), manoeuvring (obstacle avoidance), and handling (steering and accelerator control). In addition the role of instruc-tional feedback to novice drivers and the effect of some in-vehicle tasks, such as carrying on a telephone conversation while driving, are studied;
System architecture. Functionally the system architecture consists of an analyst/planner, accepting inputs from a series of special purpose applica-tions (sensors), a repertoire of 'situaapplica-tions,' a data base containing informa-tion about the driver, and a dialogue controller. The hardware compo-nents of the system are integrated in a bus architecture.
Presentation systems (Human-Machine Interfacing). The bus architecture will allow drivers to interact with the GIDS system by means of a variety of displays and controls, including voice in- and output, touch screen, swit-ches, and intelligent controls (steering wheel and accelerator).
Driver characteristics. Finally the GIDS system will have to adapt to vari-ous states and traits of drivers. Initially a limited number of driver charac-teristics will be incorporated, in particular age and experience.
The GIDS Consortium Project Coordinator:
Traffic Research Centre, University of Groningen (NL) P.O. Box 69, 9750 AB HAÄAREN, The Netherlands Phone: +31-50-636780; Fax: +31-50-636784; E-mail: gidsQrug.n]; Eurokom:su_punt Partners:
Delft University of Technology (NL) INRETS-LEN (F)
MRC Applied Psychology Unit (UK) Philips Research Laboratories (NL) Saab/Scania (S)
Swedish Road and Traffic Research Institute VTT (S) TNO Institute for Perception (NL)
TRC University of Groningen (NL) Trégie Groupe RENAULT (F)
University of the Armed Forces Munich (D) University College Dublin (IRL)
YARD Ltd. (UK) BMW-AG (D)
More information about the GIDS project can be obtained from the Project Coordinator.
Table of contents
SUH Y ts ao £20 05 00 £9 hi i a 0 10 00 0 at at an 3 1 Background Fi se w's b hie we we we we na ne ne ne ne no ne a 5
1.1 SYSEEM ener rer er eres 5
1.2 Problem eves see s 6
1.3 HYDOtRESIS eres roses errr eee. 6
2 Method. e 7
2.1 SubjeCtS nerna nerna ana nerna nanna nea nerna ne nee ne nen ne nen nn e 7 2.2 APDPQTLUS ... ebn one been nee n nn nen anne e nn nee ne 7
2.3 Driving task... e 8
2.4 Collision avoidance systems (CASs) venne venne nn e 9
2.5 D T . 10
2.6 Measures... e 11
2.7 Procedure e 12
3 Results... . e 13
3.1 System activation... e 13
3.2 Safety related behaviour ... e 13
3.3 SUDJECHIVE sss vse ese ees esc sec esse cers 15 WOTKIOAG eserves eevee reese sees seers cee sess scree seers cer ees 15 Acceptance . sresree reas bee ae bee be be ae ae ae ne ae ne ae ae ae be ne ne e ne ne nena be 15
4 |D)EoirSto e 17
5 REfETEMCES rec rec 21
AppendIX... e 23
Summary
The effects on driver behaviour, workload, and acceptance, of different levels of task allocation between a collision avoidance system (CAS) and the driver, were studied in an advanced driving simulator. Driving performance was de-scribed in terms of time headway, speed level, lateral position, and left lane driving (including overtaking behaviour). Workload was measured with the NASA-TLX questionnaire, acceptance with attitude questions. Forty subjects, between 23 and 58 years and experienced as drivers, were randomly assigned to four experimental conditions. It was found that a CAS system capable of taking over the control of the car produced the most favourable effects on drivers headway, and also reduced the number of overtakings. But, seen from the dri-vers point of view, that system was regarded as the most intrusive, and also most disturbing system. It was recommended that a GIDS, CAS system, should either give a warning, or suggest an appropriate action. It was also found that the use of the intelligent gas pedal, as a link between driver and CAS, did not lead to an increase of the drivers' workload. Finally, some consequences of the time to collision criteria were discussed.
1 Background
Interaction with other road users plays an essential role in driving. A basic form of interaction is to avoid collisions with other road users. To avoid collisions with other road users a driver must be able to perform a number of subtasks. The driver must, a) detect other road users, b) make judgements of current speed and direction of other road users, c) predict their future behaviour (speed and direction), d) adapt the own behaviour to the predicted behaviour of other road users, d) test the predictions, and in case of a mismatch between predictions and actual behaviour, e) adjust the own behaviour. Some of these subtasks are hard to perform correctly for any driver. The estimation of other car drivers speed seems to pose a problem. For instance, Hills and Johnson (1980), found that subjects tended to underestimate high speeds, and overesti-mate low speeds. Rumar and Berggrund (1973) studied drivers' overtaking be-haviour and found that subjects had difficulties to make correct judgements of the distance and speed of an oncoming car. Evans and Wasielewski (1982) stu-died drivers distances (headways) to a vehicle in front of the own car, and found that accident involved drivers accepted a smaller distance to the vehicle in front, compared to accident-free drivers.
Given these shortcomings of the human driver it might be worthwhile to de-velop a system to help the driver avoid collisions. For such a collision avoidance system (CAS) two basic questions must be answered (Janssen, 1989). The first question has to do with when the system should take some kind of action. A sys-tem taking action too early will produce a high number of false alarms, and will probably not be used or trusted by the driver. A system taking action too late is, of course, of no value. A proposed answer to the question when the system should take action was given by Janssen and Nilsson (1990).
After performing a simulator study they recommended a time to collision crite-ria (TTC) equal to 4 seconds. They also recommended the use of the "intelli-gent gaspedal" in combination with this TTC criteria. In contrast to other sys-tems, the intelligent gas pedal did not produce negative side effects like an increased speed level, or an increased amount of left lane driving. Thus, when the time before impact between two cars is four seconds, then the system (the intelligent gas pedal) should take some kind of action. This brings us to the next basic question, namely what kind of action the system should take.
1.1 System action
Among the number of possible actions for a CAS, the following may be noticed: 1. The system can give a warning.
2. The system can start an action, which the driver can choose to continue or overrule.
3. -The system can start and perform an action, which the driver cannot over-rule.
One crucial difference between these possible system actions is the allocation of control (and responsibility) to the system and to the driver. A warning can only give the driver information that something is, according to some criteria, getting dangerous, and then it is up to the driver to either ignore the warning, or take notice of it. If the driver takes notice of the warning, then it is up to the driver to decide upon some suitable action, and to carry it out. In the case of system take over, the driver is deprived of all control over the situation, and cannot refuse to obey the warning, cannot choose action, nor decide how to carry it out. Given the importance of having control over important aspects in ones life (see for in-stance Abramson, Seligman, and Teasdale, 1978) it is necessary to investigate at what level drivers accept an intervention from an intelligent help system. In some critical situations there is simply no time available for a warning, and an intervention might be the only way to help the driver. It is therefore of vital im-portance to investigate if drivers really would accept an intervention from a sys-tem. If not, there is always the possibility that drivers will refuse to buy, and use, such systems.
1.2 Problem
The purpose with this study was to find what is the optimal allocation of control between the driver and the collision avoidance system (CAS). Of special inter-est was to invinter-estigate if drivers accept interventions from an intelligent help sys-tem.
1.3 Hypothesis
Based on general psychological knowledge, and upon the finding that most dri-vers seem to overestimate their driving skill, it was predicted that dridri-vers would prefer a system only giving a warning.
2 Method
2.1 Subjects
Forty subjects, 20 men and 20 women, between 23 and 58 years of age (mean age 33.8, SD 8.8 years) participated in the study. They all had a driving licence and were experienced drivers, which means that they drive at least 10 000 km a year and that they have had their driving licence for at least 5 years. The sub-jects were mainly recruited from a subject pool at VTI. Many of them were ex-perienced "simulator drivers", because they had participated in simulator studies before. The subjects were randomly assigned to four experimental con-ditions. After the experiment they were paid 250 SEK for their participation. 2.2 Apparatus
The VTT driving simulator (Nordmark et al., 1986; 1988; Nilsson 1989; Nord-mark 1990) has used in the study. It is an advanced simulator which consists of a moving base system, a wide angle visual system, a vibration-generating system, a sound system and a temperature-regulating system. The five subsystems can be controlled to co-operate in a way that gives the driver an impression which is very much alike that of real driving. As the cycling time in the computer is 20 ms and another 20 ms delay is generated by the parallelly working moving base and visual systems, the total time delay introduced by the simulator is approximately 40 ms. The short time delay means that the VTI driving simulator fulfils the cru-cial requirement, i. e. that simulator time lags must be short compared to the lags appearing in "real" vehicles (100-250 ms). This is important because the dy-namic responses to different manoeuvres have to be fast enough, so the driver experiences that the perceived movements (forces) and changes in the visual scene are in phase.
Moving base systern. The moving base system can simulate accelerations in dif-ferent directions through rotations (roll, pitch) and linear motion (lateral) of the cabin. Lateral intertia forces are simulated by combinations of linear mo-tions and roll according to a control strategy, while longitudinal acceleramo-tions are simulated simply by tilting the cabin a certain pitch angle. Pitch and roll mo-tions are generated using hydraulic motors. The linear motion of a wagon, on which the cabin is mounted, is chain-driven from another hydraulic motor and takes place along lateral rails. According to chosen motion and velocity ranges the simulated accelerations are limited to 0.4g. Because of this limitation, all accelerations are scaled with a factor 0.5 during normal driving, to avoid trigger -ing the safety systems too often.
Visual systern. The visual system generates an image in real time. The image is transformed to a standard video signal, which is updated every 20 ms. The video pictures are (via three TV-projectors) presented to the driver as a continuously varying scenario on a screen. The screen is mounted 2.5 m in front of the driver, a distance corresponding to a 120* field of vision.In the visual system a realistic
road surface can be generated, simulating a variety of road conditions. The horizontal and vertical curvature can be varied continuously, with a maximum road sight distance of 3 000 m. Different kinds of road details (lines, wheel tracks, macrotexture), road types (asphalt highway, narrow gravel road) as well as other traffic (cars) can be simulated. Sight conditions can be varied from clear day via different degrees of fog, rain and snow to darkness. The amount of data necessary to describe a specified road and its environment can be very large. To facilitate this the road is usually defined by algorithms and random numbers (control parameters define the type of road) instead of specific road data.
Vibration systern. To generate road vibrations the simulator cabin is mounted on three hydraulic actuators. The vibrations are introduced by moving only the cabin, not the visual screen. But, because the screen is situated quite near the driver (2.5 m) and it is important that the driver not gets the impression that the horizon moves during vibration, it is necessary to let the cabin pivot around a point situated in the screen. Any vibration spectrum can be generated as long as it is within the capability of the actuators.
Sound system. The sound system provides the driver with information that is im-portant for, for instance, speed control. The system consists of six sound-chan-nels. For noise generation two treble speakers are placed on the dashboard in front of the driver and two bass-midrange speakers are placed on the wheel housings. Besides, two pairs of large loud-speakers are placed behind the driver in the cabin and allow generation of high-level (112 dB(G1)) low-frequency sounds (infrasounds). The presented noise pattern usually consists of sound spectra recorded during real driving, which have been sampled and stored in digital form. It is possible to create any desired sound spectrum within small tolerances, for example engine and wind noise and also a puncture sound. Temperature system. The air-temperature in the cabin is regulated by a closed system, where temperature controlled-water is circulated. In a feedback loop the air-temperature is recorded and fed back to a control unit, which sets the water temperature to an appropriate value. The cabin temperature can be set to any value from 18*C to 32*C with an accuracy of 0.5*C.
2.3 Driving task
Road. The road type that was presented to the subjects in the simulator was a two-lane, seven meter wide asphalt road with shoulders. The road contained mainly horizontal curves and very few vertical curves. The road surface can be characterized as a typical Swedish highway with high friction corresponding to dry summer roads. The visibility condition was similar to a cloudy summer day with a little haze appearing at long distances.
A practice route and a test route were used in the experiment. Both routes had the general characteristics described above. The practice route was 20 km long, rather straight and easy to drive. It was used to make the subjects familiar with simulator driving, in order to avoid learning effects during the real experiment. The test route was not limited in distance, but the subjects had to cope with a specified number of car following situations. The test route was also rather straight, and was not expected to cause the subjects any trouble with the choice of speed and steering strategy. The workload imposed on the driver, from road following, was thus supposed to be very low.
"Car". The car body used in the experiment was an ordinary Saab 9000 with a manual gearbox. The simulated physical environment in the "car" corresponded to that in modern passenger cars. Thus, the noise level, the infrasound level and the vibration level were all within the respective intervals obtained for modern passenger cars during driving in real traffic.
Traffic ahead. A sequence of vans appeared in front of the subject's "car" during the experiment. Each van entered the road 200 meters ahead of the "car", and drove with a speed which was 30 km/h lower then the speed of the "car". When the subject's "car", during its approach, was 100 meters behind the leading van, the speed of the van was set to a value prescribed for that particular trial (= leadingvan) (Table 1). This speed was either 10, 20, 30 or 40 km/h lower then the speed of the "car". The leading van continued at the set speed for 40 onds after the "car" had reached a time headway corresponding to TTC 7 sec-onds, unless it had been overtaken by the "car" at an earlier instant. Alternative-ly, if the "car" had not reached the time headway corresponding to TTC 7 seconds within 30 seconds after passing 100 meters behind the leading van, the 40 seconds "countdown" was started. When the 40 seconds (at maximum) had elapsed, the van drove out on the shoulder and the "car" could pass. A total of 48 vans appeared in front of the subject's "car" during the experiment. The order of vans driving with different speed differences was randomized.
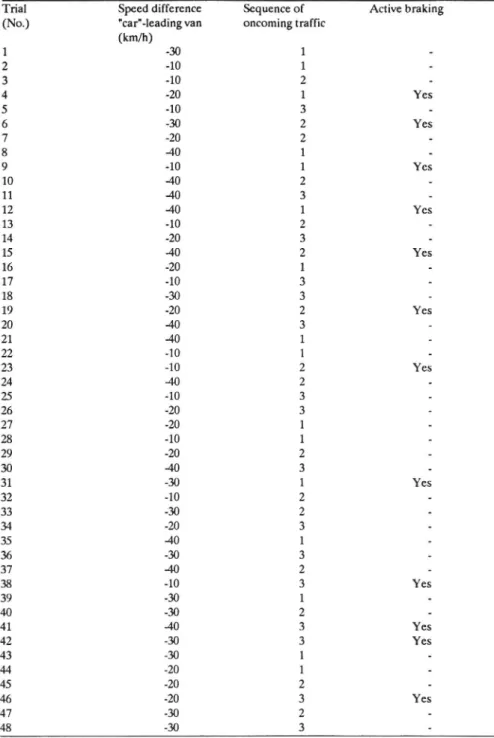
Actively braking vans. One of the leading vans driving with each of the four speed differences and subjected to each of the three oncoming traffic sequen-cies (12 vans) braked activly when the "car" was 40 meter behind them (see Ap-pendix, Table A). The applied deceleration was 3 m/s2 and remained for 2 sec-onds. The resulting speed was approximately 20 km/h lower then the previously set speed and remained for the rest of the car following situation. Speeds lower then 10 km/h were not allowed.
Oncoming traffic. For each trial (leading van) oncoming traffic appeared ac-cording to one of three different sequencies. Sequence 1 was a continuous stream of vehicles, all driving approximately 200 meters behind each other. The intention with this sequence was to prevent the subjects from overtaking the leading van. In sequence 2 the consecutive distances between oncoming vehicles were approximately 400, 200, 200, 200, 400, 200, 200, 200, 200, 400 meters. The sequence was repeated if necessary. The intention with this sequence was to give the subjects at least some opportunities to overtake. Sequence 3 was similar to sequence 2, but contained a larger proportion of long distances between secutive oncoming vehicles. The intention was to facilitate overtaking. The con-secutive inter-vehicle distances were approximately 400, 400, 200, 200, 400, 400, 200, 200, 400, 200. Also this sequence was repeated if necessary. Each sequence of oncoming traffic appeared for 16 of the 48 trials, i. e. four times for each speed difference between "car" and leading van (see Appendix, Table A). The different sequencies of oncoming traffic were randomly assigned to the differ-ent trials.
2.4 Collision avoidance systems (CASs)
Three collision avoidance systems (CASs) for the car-following situation, i.e. longitudinal CASs, were studied. All three systems were activated according to the same criterion, which was a time-to-collision criterion.
For two vehicles driving in the same direction, at velocities vi(t) (leading ve-hicle) and V2(t) (following veve-hicle) and with a distance d(t) between them, time-to-collision (TTC) is defined as
TTC = d(t)/[v2(t)-vi(t)]
The studied CASs were activated when TTC was equal to 4 seconds (Janssen and Nilsson, 1990). When the temporal (TTC) criterion was met and the CASs activated, all three systems communicated with the driver via the accelerator pedal, but the systern action differed between systems.
Warning. This CAS gave a warning when the "car" approached the leading van too fast (TTC equal to 4 seconds). The warning consisted of a short vibration in the accelerator (amplitude 20 N, frequency 10 Hz and duration 0.5 seconds). The vibrating pulse was applied when TTC was 4 seconds. It was not repeated if the subject continued to approach and drove closer. But if s/he slowed down and followed the van at a longer distance, CAS was activated also next time TTC passed 4 seconds. The vibrating pulse was not applied when the "car" was in the left lane.
Suggestion. When the driver was approaching the leading van too fast (TTC passed 4 seconds), the CAS suggested an appropriate action by starting it. The CAS suggested a speed reduction and started it by applying an additional and constant force (30 N, risetime 0.5 seconds) to the accelerator. The additional force remained as long as the distance to the leading van was shorter than TTC 4 seconds. The CAS action could be overruled by the driver, but s/he had to press the accelerator harder to keep a certain speed and thus continue to ap-proach. The additional force was not applied when the "car" was in the left lane. Intervention. The CAS warned the driver that s/he was approaching the leading van too fast and then took over the control of the "car". Thus, after the vibrating pulse had been presented in the accelerator when TTC was 4 seconds, as de-scribed above, the CAS started to brake and positioned the "car" at a pres-cribed distance (TTC = 4 seconds) behind the leading van. The intervention remained as long as the distance to the leading van was shorter than for TTC 4 seconds. The control was given back to the driver if s/he slowed down and fol-lowed the leading van at a longer distance than the prescribed one. The system action could not be overruled by the driver. The intervention was not set in when the "car" was in the left lane.
2.5 Design
A between-subject design was used. The factor varied was task allocation. Four conditions were studied: 1) a control condition with no CAS available (control), 2) an experimental condition with a CAS available, that warned the subject when s/he was approching the leading van too fast (warning), 3) an experimen-tal condition with a CAS available, that suggested and also started to reduce speed when the subject was approching the leading van too fast (the system ac-tion could be overruled by the subject), (suggesac-tion), and 4) an experimental condition with a CAS available, that took over the control when the subject was approching the leading van too fast (the system action could not be overruled), (intervention). Forty subjects were randomly assigned, with the restriction of an equal number of men and women in each condition, to the four different condi-tions.
2.6 Measures
Speed and lateral position were used as basic measures of driving performance. Speed (in km/h) was sampled with 2 Hz.
Lateral position on the road (in cm) was measured in relation to a zero-position, defined as the position for which the central line of the road coincides with the central line through the driver's body. Also the lateral position was sampled with 2 Hz.
Time headway, CAS activation and left lane driving (overtaking behaviour) were used as specific driving performance measures to describe how the sub-jects interacted with other road users. Time headway (in seconds) was sampled with 2 Hz.
CAS activation. The number of CAS activations were counted and their individ-ual as well as total durations measured. Also, CAS activation time as propor-tion of total driving time was calculated. In the same way, the number of over-takings were counted, the time spent in the left lane measured and time in left lane as proportion of total driving time was calculated.
All these measurements were controlled and stored by the main computer con-trolling the simulator. They were all recorded under a 40 second period for all leading vans, for all subjects. Unless, of course, the subject had overtaken the leading van. The recording started when the subjects had passed a distance of 100 metres behind the leading van, and TTC was equal to 7 seconds. In the cases when the driver had passed a distance of 100 metres behind the leading van, but not reached TTC equal to 7 seconds within 30 seconds, the recording started anyway.
Subjective measures. To measure the subjects! workload the NASA-TLX rating scale (Hart and Staveland, 1988) was used. The subjects had to rate six wor-kload factors, namely mental demand, physical demand, time pressure, perfor-mance, effort and frustration, on a continuous scale ranging from very low to very high. They also had to rate the relative weights of the different factors. To measure general attitudes towards the system, and opinions about the way the system worked, the following questions were posed:
1. What is your attitude towards the fact that the system used the gas pedal to tell you when you were approaching a vehicle too fast? Ratings were made on a scale ranging from one (very negative) through seven (very po-sitive).
2. Would you like to have the system in your own car (disregarding the costs)? Ratings were made on a scale from one (not at all) through seven (very much).
These two question aimed at measure a general attitude towards the gas pedal as a communication unit, and since a general attitude not necessarily reflect a more specific behaviour, a more specific attitude towards having the system. To cover opinions about the way the systems worked, and how it was perceived as influencing the driver, the following questions were posed:
3. What is your opinion about when the system was activated? Was it too ear-ly or too late? Ratings were made on a scale from one (far to late) through seven (far to early).
4. -What is your opinion concerning the way the gas pedal communicated when the system was activated? Ratings on a scale from one (very negati-ve) through seven (very positinegati-ve).
5. Is it your opinion that the presence of the system had an impact upon the way you drove the car? Ratings were made on a scale from one (not at all) through seven (to a high degree).
6. Did you experience the system as disturbing? Ratings were made on a sca-le from one (not at all) through seven (very much).
2.7 Procedure
First the subjects had to answer a questionnaire about background variables (age, sex, driving license, distance driven each year, driving experience and opi-nions about different aspects of CASs). After that each subject was randomly assigned to one of the four experimental conditions, and given a written instruc-tion that described the experimental task. The subjects in the experimental groups were told that they should drive a route, unspecified in distance, in the simulator and that other vehicles should appear on the road. They were asked to "drive" in the way they normally are driving on a similar real highway with corresponding traffic conditions. The subjects were told that it was allowed to overtake but not to drive on the shoulder. They were also told that they had to shift gear manually and that they should brake with their right foot. The func-tion of the CAS to be used was explained, and it was pointed out that the sub-jects were supposed to drive as they would in real traffic with the CAS avail-able. After reading the instructions the subjects had the opportunity to ask questions about how to accomplish the experiment. The subjects in the control group were exposed to an identical instruction, but without the part containing
the CAS description.
After the verbal instructions all the subjects were introduced to the driving simulator, for the training phase. The handling of the "car" was repeated and the subjects could practice to shift gear. For the experimental groups also the function of the CAS was repeated. Thereafter all subjects drove the 20 km long practice route, to get familiarized with simulator driving and the traffic condi-tions. Ten leading vans appeared. For each of them the oncoming traffic ap-peared according to sequence 1, i.e. it was more or less impossible to overtake in order to make the subjects practise car-following. During the training phase the experiment leader made sure that the subjects in the experimental groups felt the CAS activation at several occasions and that they got familiarized with the overall functioning of the system. When the 20 km were completed a short brake followed. The subjects were offered coffee, tea or juice and biscuits. The test phase began when the subjects had had their refreshments. They per-formed the driving task, including the specific interaction task, for the 48 lead-ing vans. Measured drivlead-ing and CAS performance data were recorded via the main computer. When the test route was completed the subjects made the NASA-TLX ratings, and the ratings concerning general acceptance of the sys-tem, and the way the system worked. Finally, they were thanked for their partci-pation in the study and paid 250 SEK. The running of each subject took 2-2.5 hours in total.
3 Results
The following results will be presented. First, measures on the activations of the CAS system. Thereafter measures on safety related driving behaviour (time headway, distance to collision, speed level, lateral position, left lane driving, overtaking). This will be followed by subjective measures of workload, accept-ance, and opinions about the CAS system.
3.1 System activation
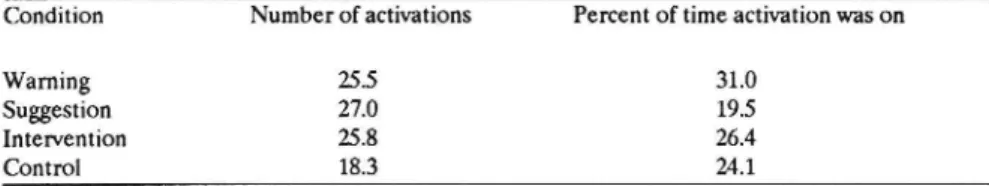
Table 1 shows the mean number of CAS activations per condition, and the mean percent (of total driving time) of CAS activation.
Table 1.: Mean number of CAS activations and mean percent of CAS activation time as a function of experimental condition.
Condition Number of activations Percent of time activation was on
Warning 25.8 31.0
Suggestion 27.0 19.5
Intervention 25.8 26.4
Control 18.3 24.1
For the control condition there was, of course, no CAS activations at all. The data presented for the control group is hypothetical data, that is, the number of CAS activations, and time for activations they should have had, if they had been in the possession of the CAS system the other groups had. From Table 1 we can see that the number of CAS activations are very much the same for the ex-perimental conditions, and that there is some differences between the control group and the experimental groups. The difference was tested with a one-way ANOVA but did not reach statistical significance (F (3,36)= 1.27, p= .2979). Neither was there any significant difference concerning the percent of the total driving time the CAS was, or should have been (control group) activated (F (3,36)= 1.61, p= .2051). We can conclude that the experimental conditions had the same exposure to the different CAS systems, and that comparisions be-tween the systems can be made on safe grounds. No bias is introduced due to different degrees of exposure to the different CAS systems.
3.2 Safety related behaviour
Table 2 shows the mean values for time headway and mean distance to collision for the different experimental conditions.
Table 2.: Time headway and distance to collision as a function of experimental condition. Condition Time headway(s) Percent 1 s Distance(m)
Warning 1.045 60.0 15.2
Suggestion 1.191 30.0 19.7
Intervention 1.661 10.0 21.8
Control 1.246 30.0 19.0
As can be seen from Table 2 the largest difference in temporal headway is be-tween the intervention and the other conditions. The difference was tested with a one way ANOVA, and found to be significant (F (3,36) = 3.71, p= .02). A posteriori test, Tukey HSD, showed a significant difference between the warn-ing- and the intervention condition. As can be seen from the percentage of headways less than one second, the warning condition had the highest propor-tion of them.
Looking at the distance to collision we can see that we have the largest dif-ference between the warning and the intervention condition. A one way ANOVA showed a significant effect of experimental condition (F (3,36) = 3.61, p= .0222). The Tukey HSD again showed a significant difference between the warning and the intervention condition. Thus, the safety goal to reduce close headways was reached significantly better in the intervention, compared to the warning condition.
Table 3 shows the mean speed level and standard deviation for the different conditions.
Table 3.: Mean speed level and standard deviation as a function of condition. Condition Speed level (km/h) SD
Warning 60.27 20.42
Suggestion 68.34 18.87
Intervention 58.13 18.83
Control 58.02 17.42
As can be seen from Table 3, the greatest difference in mean speed level is be-tween the suggestion- and control conditions. The differences bebe-tween condi-tions was tested with a one way ANOVA, but did not reach statistical signific-ance. (F(3,36)= 1.64, p= .1973). Neither was there any significant difference between the variations in speed between the different conditions, F(3,36) = 1.77, p= 1711.
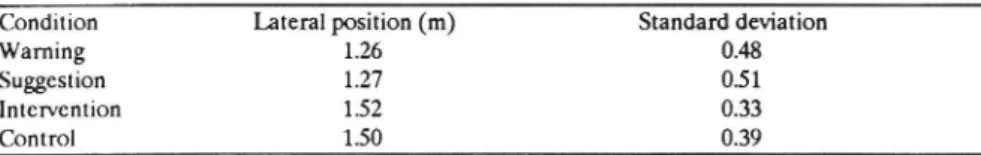
Table 4 shows the mean lateral position and standard deviation for the different conditions.
Table 4.: Mean lateral position and standard deviation as a function of experimental condition. Condition Lateral position (m) Standard deviation
Warning 1.26 0.48
Suggestion 1.237 0.51
Intervention 1.52 0.33
Control 1.50 0.39
As can be seen from Table 4 the largest difference is between the warning- and the intervention condition. We can also note the similarity between the inter-vention- and control conditions. A one way ANOVA showed a significant dif-ference, F(3,36)= 3.54, p= .0242, between the conditions. The Tukey HSD showed that there exists a significant difference between the warning- and the intervention conditions. That is, in the warning condition the subjects were driv-ing closer to the centre line of the road, compared to the subjects in the inter-vention condition. A one way ANOVA performed on the variation in lateral position did not show any significant difference between the experimental con-ditions (F(3,36) = 1.77, p= .17). Of interest is, of course, to see if the subjects in the experimental conditions were driving more often in the left lane, or overtak-ing more often. As pointed out by Janssen and Nilsson (1990) this behaviour means trading one risk for another. Table 5,6,7 shows the results relevant for these questions.
Workload
Acceptance
Table 5 shows the mean time, and the percent of total driving time, the subjects were driving with some part of the car (but not all of it) in the left lane.
Table 5.: Mean time a part of the car was in the left lane for the different conditions. Condition Mean time (s) Percent of total time
Warning 74.55 4.50
Suggestion 85.55 5.30
Intervention 39.55 2.10
Control 37.00 2.60
From Table 5 we can see that the greatest difference is between the suggestion-and the control condition, suggestion-and that the intervention- suggestion-and control conditions are very similar. A one way ANOVA failed to show any significant difference be-tween the conditions (F(3,36) = 1.76, p= .1725). The same analysis performed on the percentage of total driving time also failed to produce any significant re-sults (F(3,36) = 1.32, p= .2832).
Table 6 shows the mean time the subjects were driving in the left lane with the entire part of the car.
Table 6.: Mean time the entire car was in the left lane for the different conditions. Condition Mean time (s) Percent of total time
Warning 23.30 1.10
Suggestion 23.70 1.10
Intervention 11.45 0.50
Control 14.80 0.90
One way ANOVAS performed on the mean time and percentage of total driv-ing time failed to show any differences between the conditions.
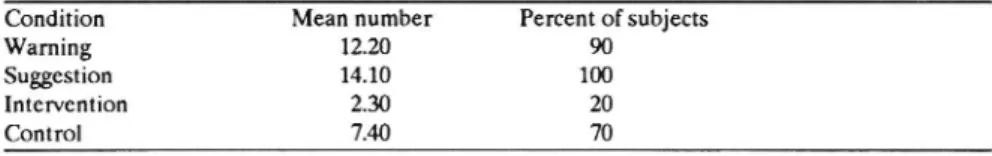
Table 7.: The mean number of overtakings for each condition, and the percent of subjects in each condition who made an overtaking.
Condition Mean number Percent of subjects
Warning 12.20 90
Suggestion 14.10 100
Intervention 2.30 20
Control 7.40 70
A one way ANOVA showed a significant difference between the conditions (F(3,36) = 3.46, p= .0261). The Tukey HSD showed a significant difference be-tween the suggestion- and the intervention condition. We can also see that all subjects in the suggestion condition made at least one overtaking, while only 20% (2 subjects) made that in the intervention condition.
3.3 Subjective measures
As a measure of the workload imposed upon the subjects from each system, the NASA-TLX was used. The use of the NASA-TLX gives scale values and weights for six different factors, mental demand, physical demand, time pressu-re, operator performance, operator effort, and frustration level. The scale value multiplied with the weight for the respective factor was used for one way ANO-VAS performed for each factor. No significant differences at all were found for the different systems. Thus it seems safe to assume that none of the tested sys-tems led to an increase in subjective workload.
To further analyze the subjects reactions to the different systems, one way ANOVAS were performed on the following questions.
1. What is your attitude towards the fact that the system used the gas pedal to tell you when you were approaching a vehicle too fast?
Ratings were made on a scale ranging from one (very negative) to seven (very positive). The mean rating was 3.73, (SD = 1.60). Thus, the subjects seemed to be neither negative nor positive to the gas pedal as a communication source. There was no significant difference between the three experimental conditions. 2. What is your opinion about when the system was activated? Was it too
ear-ly, or too late?
Ratings were made on a scale from 1 (far to late) to 7 (far to early). The mean rating was 3.40, (SD = 1.22). It seems that the TTC equal to 4 seconds was fairly acceptable for the subjects, and maybe a little too short. No significant dif-ference in ratings between the different conditions.
3. What is your opinion concerning the way the gas pedal communicated when the system was activated?
Ratings were made on a scale from 1 (very negative) to 7 (very positive). The mean rating was 3.43, (SD = 1.27). Again the subjects seemed to be rather neu-tral in their opinions about the way the gas pedal worked. No significant dif-ference in ratings between the different conditions.
4. Is it your opinion that the precence of the system had an impact upon the way you drove the car?
Ratings were made on a scale from 1 (not at all) to 7 (to a high degree). The mean rating was 4.07 (SD =2.11). Obviously the clear majority of subjects con-sidered themselve to be influenced by the system in their driving behaviour. There was a significant difference in ratings between the conditions (F(2,27) = 4.85, p= .0158). A Tukey HSD test showed a significant difference between the warning condition and the intervention condition. This clearly makes sense, given the characteristics of the different systems.
5. Would you like to have the system in your own car (disregarding the cost)? Ratings were made on a scale from 1 (not at all) to 7 (very much). The mean rating was 2.57 (SD = 2.06). Thus there does not seem to be any greater interest in the possession of this type of systems. There was no difference in ratings be-tween the different conditions.
6. Did you experience the system as disturbing?
Ratings were made on a scale from 1 (not at all) to 7 (to a high degree). The mean rating was 4.40 (SD =2.08). This indicates that the different systems to some degree were seen as disturbing. There was a significant difference in ratings between the conditions, F (2,27)= 3.58, p= 0.0418. A Tukey HSD showed a significant difference between the intervention and the warning sys-tem.
4 Discussion
The purpose of this study was to answer the question: What is the optimal allo-cation of control between the driver and the CAS? This question will be dis-cussed from two points of view. Firstly, from what can be considered as safety related behaviour. Secondly, from the subjects preferences for the different sys-tems.
Safety related behaviour of the different control allocations. The results concern-ing the safety related effects on driver behaviour showed that time headway and distance to collision was improved strongest with the intervention system. Fur-thermore, there was a significant difference between the intervention and warn-ing system. Lookwarn-ing at the subjects lateral position we found that the subjects in the warning condition drove closer to the centre line of the road, compared to the subjects in the intervention condition. Since the subjects still remained within their lane, and did not spend more time in the wrong lane, this can hard-ly be seen as an unsafe behaviour. Turning to the number of overtakings, we found that the subjects in the intervention condition made significantly fewer overtakings, compared to the subjects in the suggestion condition. This can be classified as a positive safety effect, since an overtaking introduces some degree of risk. These effects suggest that the intervention system has the best safety re-lated effects of all systems.
Stated preferences for different control allocations. The intervention system was rated as the system that had the greatest impact on the drivers control over the car, and it was also rated as the system that was most disturbing. So, the system with the best safety effects was the system that was the least preferred one. The answer to the question of optimal allocation of control between driver and sys-tem depends upon the perspective chosen. From a traffic safety point of view the intervention system was the optimal one. This may represent the view taken by traffic authorities. From the drivers point of view, the warning or suggestion systems are preferred. Since the GIDS project takes the drivers perspective, it is recommended that a GIDS CAS system either gives a warning, or starts an appropriate action.
Side effects of the intelligent gas pedal. As in the study by Janssen and Nilsson (1990) we found that the use of an intelligent gas pedal was relatively free from negative side effects. We could not detect any increase in speed level, or left lane driving, associated with the gas pedal. The reason(s) for this is not known, but comments from some subjects may throw some light on that question. If dri-vers in general are trying to avoid signals or actions from a CAS system, then some strategies can be used. If we compare an auditory signal, a visual signal, and the intelligent gas pedal, then some differences are obvious. An auditory signal is hardest to avoid, and the intelligent gas pedal the easiest. The driver has only to lift his or her foot from the gas pedal to avoid its signal. Other strategies should be equal for all systems, for instance, the driver can avoid sys-tem activation by moving to the left lane of the road, or by overtaking the
hicle in front. So, a possible explanation for the lack of negative side effects for the intelligent gas pedal may be that there exists a simple strategy to avoid it. By using that strategy (lifting the foot from the gas pedal) the driver will also de-crease the speed of his or her vehicle, and produce a positive side effect. Workload associated with the intelligent gas pedal. In this study we found no in-crease of workload caused by the use of the intelligent gas pedal. This is, of course, a positive sign, and shows that the gas pedal can be used as a communi-cation source without increasing the drivers workload.
Attitudes towards the intelligent gas pedal. The subjects attitude towards using the gas pedal as a communication unit seemed to be rather neutral. It did not seem to matter if the gas pedal communicated by vibrating, or by a constant in-crease in force.
Behavioural effects of the gas pedal. A clear majority of the subjects (73 %) stated that they believed the presence of the gas pedal had an impact on their way of driving the car. Of the subjects free comments it was obvious that some subjects experimented with the CAS system. For instance, they approached leading vehicles with different speedlevels to see if and when the system would take some action. A few subjects also remarked that they were surprised that the system was activated at different distances from the leading vehicle. The subjects in the intervention condition rated the impact upon their driving as sig-nificantly higher than the subjects in the warning condition.
Time for activation of the gas pedal. A TTC criterion of four seconds was used in this study. Looking at the subjects ratings concerning time for system activation, it seems that four seconds may be somewhat to short. In this context it would be interesting to know if there is possible to use a fixed value for TTC, or if the ideal TTC value depends upon the state and preferences of the driver, the traf-fic task at hand, and the traftraf-fic volume. This question can only be solved by em-pirical research.
A property of the TTC criterion is that it is possible to come very close to a leading vehicle, if the driver approaches it very slowly. Suppose the leading ve-hicle drives with a constant speed of 90 km/h. A driver approaching from hind with a constant speed of 95 km/h can come to a distance of 5.56 metres be-hind the leading vehicle (TTC equal to four seconds) before the CAS system is activated. If the leading vehicle should brake hard (7 m/s2) in that situation, a collision seems unavoidable, even if the driver has a reaction time less than one second. It is also possible to imagine the situation when the leading vehicle ac-celerates because the driver is not pleased with a situation when another vehicle is 5.56 metres behind his or her car. As long as the following car accelerates in the same way, it is possible to keep the same difference between the cars in much higher speed levels. So, a worst case situation could be two cars travelling with a speed of 140 km/h (or more) with a distance of 5.56 metres between them. If some driver(s) start to use the CAS system as a criterion for the head-way, then situations of that kind, although less drastic, may develop. This illus-trates the need for more research in this area. Would it, for instance, be possible to combine a TTC criteria with a minimum distance to the car in front? It also illustrates a decision problem. If drivers' prefer a CAS with a TTC crite-ria, and traffic safety experts would prefer another critecrite-ria, who's opinion should be given priority? Stated more generally, is it wise to assume that
vers" always are rational, and know what is safe and unsafe behaviour? If the answer to this question is negative, then some devation from the driver centred approach put forward in GIDS is needed.
5 References
Abramson, L.Y., Seligman, M.E.P., & Teasdale, J. (1978). Learned helpless-ness in humans: Critique and reformulation. Journal of Abnormal Psycho-logy, 87, 49-74.
Evans, L., and Wasielewski, P. (1982). Do accident-involved drivers exhibit ris-kier everyday driving behavior? Accident Analysis and Prevention, vol 18, No. 1, pp. 57-64.
Hart, S.G., and Staveland, L.E. (1988): Development of NASA-TLX (Task Load Index): Results of Empirical and Theoretical Research. In: P.A. Han-cock and N. Meshkati (Eds.), Human mental workload, Elsevier Publishers B.V. (North-Holland).
Hills, B.L., & Johnson, L. (1980). Speed and minimum gap acceptance judge-ments at two rural junctions. Ref in: B.L. Hills, Vision, visibility, and percep-tion in driving. Perceppercep-tion, 9, 183-216.
Janssen, W.H. (1989). The impact of collision avoidance systems on driver be-haviour and traffic safety: preliminaries to studies within the GIDS projects. GIDS Deliverable MAN 1.
Janssen, W.H., and Nilsson, L. (1990). 4n Experimental Evaluation of In-vehicle Collision Avoidance Systems. DRIVE Project V1041 (GIDS), Report No. GIDS/MAN2. Haren, the Netherlands: Traffic Research Centre, University of Groningen.
Nilsson, L.(1989). The VTT Driving Simulator - Description of a research tool. DRIVE Project V1017 (BERTIE), Report No. 24. Loughborough, U.K.: HUSAT Research Institute.
Nordmark, S., Jansson, H., Lidström, M. and Palmkvist, G.(1986). 4 Moving Base Driving Simulator with Wide Angle Visual System. VTIsärtryck 106A. Linköping, Sweden: Swedish Road and Traffic Research Institute.
Nordmark, S., Jansson, H., Lidström, M., and Palmkvist, G. (1988). The VTT Driving Simulator - Recent Developments. Linköping, Sweden: Swedish Road and Traffic Research Institute.
Nordmark, S.(1990): The VTI Driving Simulator - Trends and experiences. Rumar, K., and Berggrund, U. (1973). Övertaking performance under controlled
conditions. Paper presented at First International Conference on Driver Be-haviour (IDBRA), Zörich.
Appendix
Table A: Description of the behaviour of other traffic for the different car following situations (tri-als).
Trial Speed difference Sequence of Active braking (No.) "car"-leading van oncoming traffic
(km/h) 1 -30 1 -2 -10 1 -3 -10 2 -4 -20 1 Yes 5 -10 3 -6 -30 2 Yes 7 -20 2 -8 -40 1 -9 -10 1 Yes 10 -40 2 -11 -40 3 -12 -40 1 Yes 13 -10 2 -14 -20 3 -15 -40 2 Yes 16 -20 1 -17 -10 3 -18 -30 3 -19 -20 2 Yes 20 -40 3 -21 -40 1 -22 -10 1 -23 -10 2 Yes 24 -40 2 -25 -10 3 -26 -20 3 -27 -20 1 -28 -10 1 -29 -20 2 -30 -40 3 -31 -30 1 Yes 32 -10 2 -33 -30 2 -34 -20 3 -35 -40 1 -36 -30 3 -37 -40 2 -38 -10 3 Yes 39 -30 1 -40 -30 2 -41 -40 3 Yes 42 -30 3 Yes 43 -30 1 -44 -20 1 -45 -20 2 -46 -20 3 Yes 47 -30 2 -48 -30 3