Improving software evolvability
by exploiting change history and software metrics
Antonio Cappiello
July 27, 2012
Amsterdam, The Netherlands
External advisors:
Joost Huizinga and Stephen Lorié,
WoodWing Software,
Zaandam, The Netherlands
A thesis in partial fulfillment of the requirements for the degrees:
Master of Science in Computer Science
Thesis supervisor: J. C. Hans van Vliet
VU University Amsterdam
Faculty of Sciences
Master of Science in Software Engineering
Examiner: Ivica Crnkovic
Mälardalen University,
School of Innovation, Design and
Abstract
A software system is well structured if its constituting components have a high cohesion and
a low coupling [Yourdon and Constantibe, 1975]. Inevitably those parameters tend to vary
during the software lifespan: environment changes lead to software changes, and if software
does not evolve over time, then its quality decreases [Leheman, 1980]. The ability of software
to evolve in a cost effective way is known as evolvability [Cook et al., 2000].
Nowadays the evolvability has been recognized as a critical success factor in system design,
thus there is an overall increasing interest in this topic, and numerous studies proposing
solutions to deal with it. These solutions can be categorized in two main categories: the
approaches based on change history information, and the approaches based on software
metrics. This thesis describes a third approach to deal with the software evolvability: it is an
hybrid of the first two approaches and It has been named EVO, from the first three letters of
“Evolvability”. The aims of EVO is to facilitate the analysis of change history information by
reducing the scope of investigation. This reduction is achieved by using software metrics that
point to “bad smells”.
During this project, EVO has been validated on one industrial case study. The product under
examination has a lifespan of a decade, and during that time it has been exposed to several
changes and patches that have negatively affected its architecture. As consequence, today
the product presents clear difficulties to evolve, and the engineers need an efficient support in
refactoring the system in order to deal with its evolvability problems.
The results of this validation cannot be generalized because they are obtained from a single
case study and not from a number of cases statistically significant. However, these results are
interesting, at least within this research, since they shows that EVO could be a good tradeoff
between the two kind of approaches considered. It is faster then the approaches based on
history information, because it reduces the couplings to inspect, and it is more accurate then
the approaches based on software metrics, because it searches for “anti-patterns” only
among the candidate unwanted couplings. This implies that the “anti-patterns” identified via
metrics point not only to “bad development practices”, but also to problems that really hinder
software evolvability.
Concerning the design of a refactory strategy, it was possible to propose only improvements
at method level due to the lack of “in-house knowledge” of the system. However, these kinds
of local improvements represent a necessary initial step to make the code more readable and
understandable before to operate at architectural level to concretely remove the evolutionary
threats.
Table of Contents
Acknowledgments!
IX
1. Introduction!
1
1.1.Institutional Context 1 1.2.Software Evolvability 1 1.3.Problem Statement 4 1.4.Research Questions 51.5.Research Methods and EVO 6
1.6.Outline of the Thesis 7
2. Improving Software Evolvability!
9
2.1.Methods Based on Software Metrics 9 2.2.Methods Based on Software History 10
2.3.EVO 11
2.3.1. EVO - Stage 1 12
2.3.2. EVO - Stage 2 17
3. Method Validation at WoodWing!
21
3.1.The Case Study: SmartConnection 21 3.2.Looking for Evolutionary Threats 22
3.2.1. EVO: Stage 1 - Cycle 1 22
3.2.2. EVO: Stage 1 - Cycle 2 25
3.2.3. EVO: Stage 1 - Cycle 3 28
3.2.4. EVO: Stage 1 - Cycle 4 32
3.3.Designing a Refactory Strategy 36
3.3.1. EVO: Stage 2 - Part 1 36
3.3.2. EVO: Stage 2 - Part 2 41
4. Conclusion!
43
4.1.Summary and Contributions 43
4.2.Lessons Learned and Critical Success Factors 44
4.3.Future Work 46
Appendix 2: Populating the Database!
53
Appendix 3: Examples of Refactoring on SmartConnection!
55
List of Figures
Figure 1 - Staged model of a system lifecycle.
Figure 2 - EVO, Stage 1.
Figure 3 - SmartConnection.
Figure 4 - Deployment diagram.
Figure 5 - Component diagram.
Figure 6 - Plugins complexity.
Figure 7 - Duplicated code in the Enterprise plugin.
Figure 8 - GetPathToOpenDoc() call graph.
Figure 9 - ExportStory() call graph.
Figure 10 - Example of a cycle in the ExportStory() call graph.
Figure 11 - Project plan.
Figure 12 - Populating the database.
List of Tables
Table 1 - Glossary of the metrics.
Table 2 - Metrics.
Table 3 - Metrics in percentage.
Table 4 - Potential god classes and long methods.
Table 5 - Some of the files involved in the unwanted couplings.
Table 6 - Methods comparison.
Acknowledgments
First and foremost I would like to thank the thesis supervisor, professor J.C. van Vliet, who
supported my work with his considerable experience during the entire period of this project.
Since my first days at VU University, he represented to me an inspiring source of knowledge
and wisdom, and I am very honored to have received his guidance.
I am thankful to all the people inside WoodWing for their warm support, patience and
advice during my stay at the company. In particular, I wish to express my gratitude to my two
external supervisors, Joost Huizinga and Stephen Lorié, who have surely helped me growing
professionally and in succeeding in this project. My thanks also extend to everyone in the
SmartConnection team. They have been so kind to answer to all my questions during the
interviews and they represented a fundamental source of information for my work.
Being an international Master student has been one of the most challenging
experience of my life, therefore I also have to express my gratitude to Patricia Lago, from VU
University, and Ivica Crnkovic, from MDH University, for being the promotors and coordinators
of the GSEEM program.
Last but not least, I immensely thank my family because they gave me the possibility
to realize this, my friends, and specially my partner who supported me in many ways. I could
not have managed to sustain the burden of my Master’s degree without the help of all these
persons.
Thank you all!
Amsterdam, July 2012
Antonio Cappiello
1.Introduction
"If it ain’t broke, fix it anyway. You must invest at least 20% of your maintenance budget in refreshing your architecture to prevent good software from becoming spaghetti-code."
-- Larry Bernstein
1.1. Institutional Context
The three logos on the front page symbolize the three institutions that surround this thesis project: 1. the Mälardalens University located in Västerås (Sweden),
2. the Vrije University located in Amsterdam (The Netherlands), 3. and WoodWing Software located in Zaandam (The Netherlands).
The two mentioned universities are promoters of the Global Software Engineering European Master (GSEEM). The aim of this study program is to combine technical engineering expertise with socio-cultural competencies (http://www.gseem.eu/). This thesis document represents for the author the final work to achieve the cited double degree master.
WoodWing (WW) takes part in this context hosting the research side of the thesis. This company was founded in 2000 and has regional sales offices in Europe, the USA, Latin America and Asia Pacific. Its customers are spread out in more than 75 countries and Adobe is the main technology partner. WoodWing is a worldwide renowned business in the editorial industry thanks to its software solutions in the publishing process (http://woodwing.com/).
1.2. Software Evolvability
There is not a unique definition of software evolvability, it can be interpreted as a multifaceted
quality attribute that includes analyzability, integrity, changeability, portability, extensibility and testability [Rowe and Leaney, 1998].
“the ability of a system to accommodate changes [...] throughout the system’s lifespan with
the least possible cost while maintaining architectural integrity” [Breivold, Crnkovic and
Eriksson, 2008].
During the last decades, the IT industry has developed a growing worry concerning the effort required to keep the existing software systems operational. Indeed, the continuous work of maintenance -- either corrective, adaptive, perfective or preventive [Lientz 1980] -- is becoming more expensive and barely manageable as the system complexity increases due to day-to-day maintenance.
In the 1970s, Belady and Lehman studied about 20 releases of the OS/360 operating system. They observed that software systems undergo continuous changes, that their complexity and size tend to increase, and that their quality declines unless they are maintained and adapted to the changing environment. During the years, conducting other research in this field, they have formalized those principles in the eight laws of the software evolution, that are:
1.
Continuing Change (1974),2.
Increasing Complexity (1974),3.
Self Regulation (1974),4.
Conservation of Organizational Stability (1978),5.
Conservation of Familiarity (1978),6.
Continuing Growth (1991),7.
Declining Quality (1996),8.
Feedback System (1996).These laws have been largely verified in many software systems and the evolution of a software product has been recognized as a vital phase through which a system passes during its life.
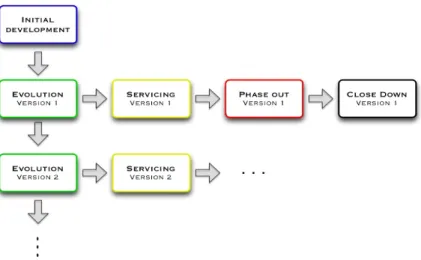
Bennett and Vaclav [2000] have defined a staged model of software lifecycle where after the initial
development follows the evolution stage (Figure 1)
According to this model, the evolution is characterized by a full range of maintenance tasks to keep up with changes. When it is no longer possible to perform substantial modifications due to the advanced level of degradation of the software, then the system enters the servicing stage, where only small patching is viable. At a certain point, the software is no longer maintained although it is still operational; this is the phase out stage. Finally, the last phase is the close down of the project with the retirement of the product itself.
As is intuitively understandable from this model, the maintenance represents the longest and the most expensive activity of the system lifecycle [Nguyen, 2011], and its affordability determines the success of a software product. Due to those considerations, system architects and managers need to plan the
long-term evolution of a software system rather than simply manage the day-to-day maintenance.
The traditional engineering processes have tried to control the changes in the requirements because of the high cost of making modifications in the advanced steps of the system lifecycle. But, taking into account large information systems and the fact that their missions and technologies are likely to vary, those systems must be evolvable in order to embrace the changes in a cost effective way. To achieve the mentioned evolvability, it is required to have a certain control on the architecture of a software product, as Isaac et al. [1994] declare.
Several other researchers from the field of architectural pattern mining emphasize the important role of a system architecture and of its design patterns.
For example, Paakki et al. [2000] propose a method to predict and analyze the quality of a software based on its architectural patterns. They define the software architecture “as one of the cornerstones
of software quality, documentation and reuse”, and therefore an important base to enable and support
the evolvability process. As for the definition of software evolvability, there is not a unique definition of
software architecture, but, although this is a somewhat immature area, it is generally agreed upon
that
“the software architecture is an abstract structural description of its main components and the
relationships among them” [Bass, 1998].
Ratzinger et al. [2005] also state that architectural patterns offer a practical way of analyzing the quality of a system’s architecture from the point of view of its evolution: while instances of “good patterns” indicate robustness and discipline in design, “bad patterns” indicate architecture poorly designed and sources of quality problems in the long run. Therefore these “bad patterns”, also named “anti-patterns”, represent the starting point of many approaches that aim to improve software
evolvability and that are discussed later in this thesis.
From the reflections done so far, follows the importance of having an architecture that grants the possibility to manage the changes efficiently and effectively. This kind of architecture has been named as “enduring architecture” by Steiner [1998] as opposed to “single-use architecture”. While an
“enduring architecture”, with its set of design constraints, ensures the consistency of some key characteristics during the software’s evolution, a “single-use architecture” instead supports only the development phase of the product. When changes in the requirements occur, the “single-use architecture” is not able to accommodate them and therefore it becomes useless and outdated.
1.3. Problem Statement
It is difficult to make a software evolve when any kind of change is risky and expensive.
A change can become risky when the consequences of the modification are not correctly predicted. The more the parts involved in the change, the more difficult it is to find out the ripple effects that the change has on the whole system. For example, what could happen is that a change on a functionality may corrupt another functionality that was otherwise correctly working.
A change can be also expensive when for example it involves different code units that are “logically distant” from each other. Logically distant means that those code units may be located in different modules of the system. This situation implies that the developers responsible for those modules need to collaborate to perform the changes, even if they are geographically far apart from each other. Obviously, this makes the changes time-consuming and consequently more expensive.
The cause of those problem is generally identifiable in a high level of coupling among the system
constituent modules and in a low cohesion of each of these modules. Indeed, while a high level of
coupling points to the interdependencies between the modules, a low cohesion index indicates that the responsibilities of a single module do not form a meaningful and complete unit. This means that those responsibilities can be extracted from that module to form a different module or to be integrated into an existing one. So a low cohesion index is also a sign of a weak system decomposition.
When it is complicated to make any change on the system, not only its maintainability is hardly affordable in the servicing stage (Figure 1, page 2), but consequently also its evolution towards newer versions will get slower or even impossible. This means that the life of a product is destined to end shortly unless any refactory action is taken to remove the evolutionary problems.
This phenomenon is also known among the experts as “technical debt”, referring to the metaphor
devised by Ward Cunningham. Similar to a financial debt, the technical debt shows up as extra development effort (interests) in future as consequence of quick patches and dirty designs made today. This happens quite often to take advantage of market opportunities or to meet deadlines. Only via code refactoring it is possible to solve or reduce the debt, but if this refactoring is never performed properly, then the debt just continues to increase until the failure of the product (bankrupt).
Although the research in software maintenance has produced a huge collection of patterns aimed to redesign existing code [Demeyer, 2002], there isn’t yet any approach that always helps in judging the code that represents a true evolutionary threat from the code that is just bad development practice. It is like if there is a solution for the problem but not a way to find where the problem is located.
1.4. Research Questions
This thesis wants to contribute to the research by proposing an approach to improve software evolvability that consists in an improvement of the analysis of the change history information. This is obtained reducing the list of couplings to investigate to the ones that also “smell bad” according to software metrics.
So this thesis deals with the problems of spotting the most severe evolutionary threats and choosing an appropriate refactory strategy that solves those specific threats. To do this, I operate under the premise that the software product under research clearly shows the symptoms of the evolutionary problem described in section §1.3: low cohesion, high coupling, deteriorated architecture, high
maintenance costs and risks.
From those intentions, the main research question (MRQ) of the thesis is:
MRQ: What is an approach to redesign a “spaghetti-like product” in order to increase its evolvability and control the risk of it further deteriorating?
As defined in section §1.2, the term evolvability refers to the ability of a software product to be maintained and enhanced in a cost-effective way. The level of evolvability is determined by the level of independence among the development units that compose a software product: the more the composite elements evolve independently from each other, the higher the evolvability capacity of the product. It is obvious that the software architects would like to have a software decomposition that facilitates the evolvability because this also implies an easier and cheaper way to achieve the development tasks among different teams of developers.
To answer to the main research question it is first necessary to have a vision of the internal structure of the system, so a minor research question (RQ) follows:
RQ-1: How to determine the current decomposition of the system under examination?
Next, It is needed to understand the issues that inhibit the evolvability of the system.
An unwanted relationship of dependence between two decomposition units of the software is generally defined as an unwanted coupling. “Unwanted” because this kind of coupling has not been
planned in the design phase, but it has been created during maintenance as quick patch. The unwanted couplings are the main reason why the decomposition units cannot evolve independently from each other. So a second minor research question follows:
RQ-2: How to identify the unwanted couplings among the units of decomposition that inhibit the evolvability of the system?
After having spotted those unwanted couplings, the architects can choose which issues solve before others developing an appropriate refactory strategy. This strategy, other than addressing the problem, should also be risk-limiting, which means that the changes operated by this strategy should be such
that the risk to break working functionalities of the system is limited to the minimum or at least is known. So a third minor question is:
RQ-3: How to define and assess the feasibility of a refactoring strategy that addresses specific unwanted couplings?
Finally, by answering those three minor research questions (RQ-1, RQ-2, RQ-3) with the description of the approach experienced in WW, it will be possible to answer also to the main research question (MRQ). Of course the experience conducted in WW is just one example of the capabilities of the approach proposed, and although its results lead to the belief that it could work in other environments, it still requires to experiment EVO on a significant number of case studies to understand to which extent those results could be generalized.
1.5. Research Methods and EVO
In literature many methods have been proposed with the aim to solve evolutionary problems. Those methods can be categorized in traditional approaches and novel approaches.
The traditional approaches are the ones that are based on the measurement of some specific properties of the system, like size, complexity, level of cohesion or coupling.
The idea behind those approaches is that thanks to metrics measurement it is possible to spot the code that “smells bad”: god classes, long methods, complex execution paths and so on.
The limit of those approaches is that it is difficult to define and measure software qualities due to the complexity of the development processes and to the variance of software products. In addition, it is difficult to determine which metrics could be more effective than others in spotting evolutionary threats. Indeed those metrics may points to code that is just bad-written and that doesn’t necessarily represent an evolutionary threat (further details in §2.1).
On the other side, the novel approaches are based on the analysis of the software’s history, more precisely they focus on the code entities that have been involved in changes more often in the recent past.
The idea is that those co-changing entities represent logical couplings, and that among the couplings that cross the modules boundaries it is possible to spot unwanted couplings.
Instead, the limits of those approaches are in the difficulty of understanding the decomposition of the system, in finding an approximation of the couplings and then in filtering out the unwanted couplings (more details in §2.2).
It is not clear if one of those approaches is more suitable for a specific context than the others. It is also not proved yet if one approach produces better results than the others. Indeed, not any
significant research that studies the differences between the traditional and novel approaches has been found during this project. Therefore, I have dedicated quite some effort to develop an approach that benefits from the ideas behind both the traditional and novel approaches, and that in the same time reduces their limits. This suggested approach has been named EVO, from the first three letters of
Evolvability, and it has been tested on a WW product that has evident difficulties to evolve, as showed
later in section 3.1.
1.6. Outline of the Thesis
The thesis has been organized in the following way:
‣ The first chapter, “Introduction”, presents the concept of software evolvability and its
related problems, the research questions of this project, and an introduction of the approaches commonly used to tackle the evolvability problem.
‣ The second chapter, “Improving Software Evolvability”, discusses more deeply all three
mentioned approaches -- traditional (based on software metrics), novel (based on change history) and EVO (developed in this project) -- describing in what they consist and what their strengths and weakness are.
‣ The third chapter, “Method Validation at WoodWing”, shows an application of EVO on the
industrial case study of WoodWing. The purpose of this application is to test the validity of the approach proposed. The validation process is split up in two parts: the first one focuses on the identification of evolutionary threats, the second one focuses on studying a refactory strategy to address those threats.
‣ The fourth chapter, “Conclusion”, is the final chapter and it summarizes the results
accomplished by this research, the contributions given and the lesson learned.
‣ Three appendixes, “Project Plan”, “Populating the Database” and “Example of Refactoring
on SmartConnection”, end the thesis with an in-depth examination on how the work at
WoodWing has been carried out, in term of plans, data collected, and examples of concrete refactoring on the code.
2. Improving Software Evolvability
2.1. Methods Based on Software Metrics
The value of the software complexity metrics has been largely discussed in the research field of software maintainability [Kafura, 1987; Coleman 1994, Lehman, 1997; Paakki, 2000, Simon, 2011]. Coleman et al. [1994] describe how automated software analysis can be used to guide the maintainability decisions with a comparison of five methods based on complexity metrics. Simon et al. [2011] show that it is possible to use static structure analysis and metrics to identify “special anomalies for certain re-factoring strategies”.
The objective of the methods based on software metrics is to provide numerical evidence of some
software properties that may point to evolutionary threats. The followings are some examples.
A big module that embodies many functionalities compared to other modules of the system, is very likely difficult to understand, to test, and therefore to maintain. In a sense, it hinders the evolvability of the system. The software metrics that could highlight this threat are the lines of code, the number of declared functions in a module or the cohesion index.
A long function characterized by many execution paths is difficult to understand and to maintain as well. In this case the cyclomatic complexity index could help in find out those kinds of methods.
Pieces of code duplicated over the system could cause ripple effects on changes because it could be complicated to locate all of them to globally propagate the modification. Therefore, duplicated code anti-pattern also hinders the evolvability of a system and several tools are available to detect them.
These are all examples that fall under the so-called category of “bad smell” or “anti-pattern”, and it is possible to find many others like this, but it is difficult to say which of them refers to a true evolutionary threat or to a potential evolutionary threats. The difference among these types lays on the fact that a true evolutionary threat causes problems in the daily maintenance, instead a potential evolutionary threat does not causes any “harm” because it is almost never touched in the daily maintenance. To make this more clear, let’s think to the “duplicated code anti-pattern”. If this duplicated code is related to parts of the system very stable and is not object of the maintenance process, then it does
not represent a true evolutionary threat, although it is a manifestation of code badly written. On the other way around, if this duplicated code is often under maintenance, then it makes the whole process of maintenance more difficult and risky: it is necessary to locate all the duplicated code and then propagate the changes everywhere.
These are just some of the limits of the methods based on software metrics. Indeed, measuring
software metrics is not an easy task: it requires to define precisely what quality of the system is being measured, how to measure it and what the measurement means. Moreover, it is also difficult to asses which metrics really matter for the specific case study because other factors as development processes and objectives should be considered.
Furthermore it seems that many software practitioners think that those measurements are not only often imprecise, but also unproductive. The developers could be negatively influenced by those metrics because of the stress of being judged according to some number not always understood [Kaner and Bond, 2004]. In spite of that, the approaches based on software metrics are largely used by government agency, IT consultants company and in development estimation techniques.
2.2. Methods Based on Software History
Numerous researchers have proved that versioning information not only can be used to anticipate future evolutionary courses of a system [Mens, 2001; Rysselberghe, 2004], but also to provide starting points for refactoring activities [Gırba, 2004; Vanya 2012]. Moreover, Zimmermann et al. [2004] have experimented that some logical relationships among software entities are found out only by analyzing the historical data, and not by software metrics analysis.
The methods based on the analysis of the software history are also named in the literature “change
couplings driven refactoring”. The idea behind those methods is that, if two software entities are
affected by modification several times together, then they represent a logical coupling and may expose the system to complex modifications. This is what happen for the so called “external
couplings” [Ratzinger et al. 2005], that are the ones affecting software entities across the
decomposition units of a system.
The objective of the methods based on software history is to identify, among all logical couplings, the
ones not defined at design time and whose frequency of changes tended to increase during the time (unwanted couplings). The increasing frequency is relevant because of the Yesterday’s Weather assumption of Gibra et al [2004]: the entities that changed together in the recent past, probably will change together also in the near future.
The limits of those methods mainly depend on two factors that are strictly related to each other, the
‣ If the repositories do not support the notion of “change transaction” as a timely coherent sequence of check-ins, then the developers do not have the possibility to submit changelists, sets of source files changed together due to a unique development task. The importance of having change transactions is to be able to directly identify those changelists. Indeed, in the worst situations it is necessary to infer the co-changing information using the relative timestamps and reconstruct the development tasks from the bug-tracking system [Fischer and Gall, 2006].
‣ Instead, If the repositories support the submission of change lists, but the developer are used to commit changes frequently, than more than one changelist is associated to each development task. As consequence, also in this case it is necessary to do extra work to approximate the change sets, using for example different time windows [D’Ambros, 2009].
Filtering out the unwanted coupling from all the couplings could be a complex operation when there is considerable noise in the results or when the change sets are roughly approximated. To facilitate the examination of the couplings, several prototypes tools have been proposed to visualize their history of evolution in “storyboards”, like Evolution Radar [D’Ambros, 2009], EvoLens [Ratzinger et al., 2005] or iVIS [Vanya, 2012]. Those tools could be very handy, but their limitation lay on the fact that they are all experimental, and therefore a company should first build its own visualization tool if it wants to benefit of these techniques.
2.1. EVO
EVO is the name given to the approach developed during this project and validated on the WW case study (described later in §3.1). Its goal is to provide to the software architects a refactoring approach
to improve the evolvability of a classical spaghetti-like product.
The key of EVO is the combination of the ideas used in the change history and software metrics
based approaches. It removes from them all the expensive and experimental steps that require time and expertise, such as building prototype tools or evaluating complex formulas. Indeed, those are also the same steps that discourage the software architects of a company to adopt a “formal” approach to deal with the maintainability issues of their products.
The goal of EVO is to makes faster and easier the analysis of the change history: it analyzes the logical couplings by way of simple software metrics. This means that, from one side the logical couplings are filtered according to software qualities and not only by their relevance in the software history, as it is done with the history-based approaches; and from the other side, the software metrics
are used to spot “anti-patterns” only among the code entities involved in those couplings and not on the entire system.
The main hypotheses on which EVO is based are:
‣ the most changing parts of a software are very likely the ones containing the most defects: 80% of the software defects are in 5% of the code [Demeyer et al. 2002];
‣ the software entities who changed in the recent past will probably change again in the near future [Yesterday’s Weather, Gibra et al. 2004];
‣ the changes that involve entities across different modules of the system may point to structural weakness [Ratzinger et al. 2005];
‣ the changes that involve numerous entities are also the most expensive one to perform [Sommerville 2011];
‣ improving the design of the system reduces maintenance costs and risks [Isaac et al. 1994].
EVO consists in two fundamental stages, the first one focuses on the identification of the most
severe evolutionary threats, and the second one on designing a refactory strategy to address those threats. The following sections will describe more in details each stage.
2.1.1. EVO - Stage 1
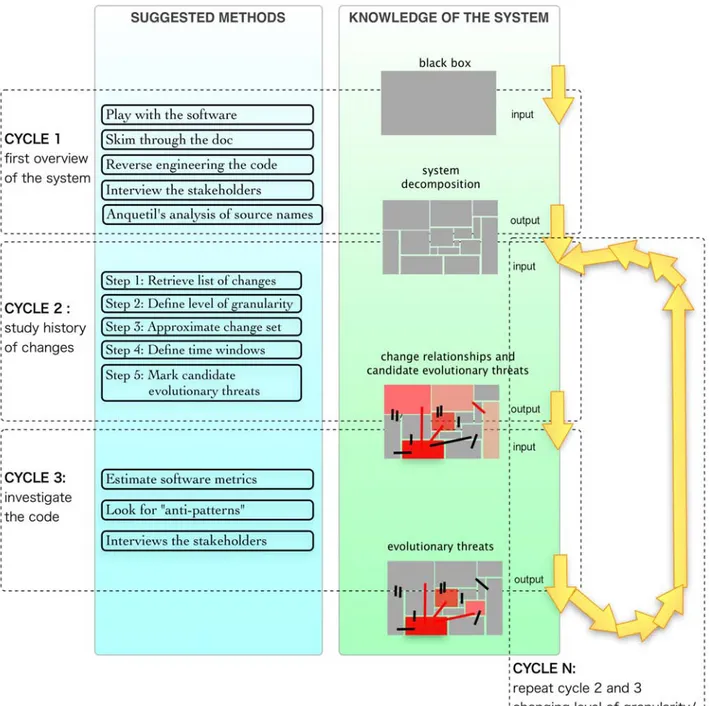
The first stage is constituted by a feedback loop that at every cycle increases the understanding of the system and reduces the area where to locate candidate threats. At each cycle it is associated:
‣ a grade of understanding of the system,
‣ the area where evolutionary threats could be located,
‣ and a set of methods to further increase the knowledge of the system and the localization of the threats.
Figure 2 - EVO, Stage 1
Stage 1 - Cycle 1
At the beginning of the research, the system is a black box and the area of possible threats is spread all over the system. The first cycle consists in finding all the possible information on the system architecture, and the methods used in this research are:
‣ play with the software and try some use cases to understand at least the basic functionalities;
‣ skim through the documentation available on the system, focus on the design specification, and on the user guide;
‣ reverse engineer the code with automatic tools to generate UML diagrams about the system structure;
‣ interview the system architects to have a confirmation of the information collected to clarify doubts or to get further information on parts not documented;
‣ define a decomposition of the system starting from the paths of the source files [Anquetil, 1999].
This cycle ends when the basic functionalities of the system are understood and the decomposition of the system is defined and confirmed by the software architects. It is not otherwise possible to proceed with the analysis of the cross-boundaries couplings.
The duration and the difficulty of this cycle depends mainly upon the design documentation available: in case the architecture of the system is already well documented, then it is not necessary to reverse engineer the code to retrieve it, or use the Anquetil’s method based on source names.
Stage 1 - Cycle 2
At the start of the second cycle the knowledge about the system includes at least its basic functionalities and its decomposition into logical units, which could be modules, components or subsystem.
The area where evolutionary threats could be found is still the whole system.
The methods to apply in this cycle aim to gather the change history information and are the same as the ones used in the history based approaches cited in §1.2. I extracted the commonalities from those approaches and consolidated them in the following steps.
➡ Step 1: retrieve from the versioning system the list of changes.
The methods to perform this step depend from the versioning system in usage. Some of them may provide GUI functionalities to directly output a file containing the list of changes, while others can be queried via terminal by specific commands. Those commands can be organized in a scripts to collect the change information and then format them in a customized way in files.
➡ Step 2: define a level of granularity to analyzes the relationships among the software entities (subsystems, modules, components, folders, files, classes, functions).
The choice of the granularity level depends on the system under consideration. Interviews with the development team and with the system architects can provide good suggestions to choose the option that fits the best the specific system.
The objective is to target the level of abstraction where the unwanted relationships could be more evident. For example, in the case of a system that is clearly decomposable into modules with different responsibilities, the relationships that cross the module boundaries are the ones that could inhibit its evolvability. In the case of a system where the modules are too big, it may not be possible to find interesting relationships outside the boundary of the modules because all the relationships are inside the modules. So in this case the relationships are visible only with a level of granularity finer than the module, and these relationships may also give indication on how to group the files into sub-modules to improve the internal structure of the module itself.
➡ Step 3: group the code entities involved in the changes according to the same development task. Those groups are also named change sets.
Depending on the company, the developers can be used to commit into the versioning system with different frequencies: someone commits at each small change of the code, others only at the end of the development task. The first category of commits could increase the complexity of the current step. Indeed, it is necessary to analyze the bug tracking system to group all the entities that have been affected for the same development task. Moreover, different approximations of the change sets can be made [Vanya, 2012]. Instead the second category of commits provides the change sets in a more direct way, because they match with the set of files committed together (as it happened for this project).
➡ Step 4: define the size of the time windows and the starting date of the first time window according to which analyze the tendency of the relationships.
Also this step depends on the system under consideration and it is possible that the right choice could be taken only after trying different options. This means that it is possible to look at the frequency of the relationships in different time windows and with different starting points of the same time window. If for example in four months the frequency of the relationships is very low or quite uniform along the system, then it is better to choose a bigger interval of time, such as semester or year. In these other intervals the differences of frequency among the relationships should be more evident because cumulate the occurrences over a longer time. The possible methods to apply here depend on the quantity of information gathered in the previous steps. A convenient way for large amount of data is to insert all the relationships
among the entities of the system in a database. Then, with few simple queries, count their occurrence according to different options of time and level of abstraction.
➡ Step 5: mark the relationships that could point to evolutionary threats.
There are many methods to select candidate threats. One consists of showing the most frequent relationships to the experts of the system and see their reactions. If they do not seem to be surprised, then it could mean that you may have found well-known problems or “wanted” relationships. Otherwise, if they seem surprised, then you could have found relationships that need further investigation: they could be either good candidates of unwanted relationships, or false positives generated by wrong approximation of the change sets.
It could be difficult to go through all the relationships due to the huge quantity of the data. In those cases it is possible to filter the results with other queries or just represent them in a different way. For example, the “database tables” could be exported in some kind of spreadsheet format in order to generate automatically charts where the frequency of changes on the y axis varies according to the time on the x axis. However, the number of couplings visualized could be still to big, so what EVO proposes is to reduce the couplings. This reduction could be done both by removing the files with a change history not relevant, and by focusing only on the couplings that present “anti-pattern”. The research of “anti-pattern” is performed via estimation of software metrics.
Stage 1 - Cycle 3
Thanks to the results of the previous cycle, this cycle starts with a good knowledge of the system organization and of its past evolution. Moreover the area where to spot evolutionary threats is identified in the candidate lists outcome of the cycle 2.
Those lists could be very long in case of big system with an significant maintenance history, so it is required to filter out from the candidate list all the relationships that do not really hamper software evolvability, or in the other way around, to filter out the most interesting relationships for the software evolvability problem. This is the goal of the current cycle.
The way to proceed consists in investigating the source code of the entities involved in the relationships to find signs of “bad smell”. To conduct this investigation it is possible to use one or more of the traditional methods based on software metrics. However, before choosing any of those methods it is better to have some feedback from the experts of the system in order to have a first validation of the data. This validation could indeed save plenty of time because the expert could steer the focus in the right direction; they have an embedded knowledge of the history background of the system and they usually already know some of the code relationships. These feedback could be gathered either by interviews or by questionnaires.
Unlike traditional methods, in EVO have been avoided heavy computations and only the most intuitive metrics that can pinpoint “anti-patterns” have been considered. Line of codes per classes and methods can help in identifying god classes and long methods. Duplicated code can point to entities that can cause ripple effects. Complexity metrics can indicate code fragments hardly manageable.
Many other examples of anti-patterns are discussed in the literature [Gamma, 1995; Alpert, 1998; Fowler, 1999; Demeyer, 2002].
At the end of this cycle some of the candidate evolutionary threats identified in the cycle 2 are confirmed to be real threats.
Stage 1 - Cycle “n”
If the results of the previous cycle are not satisfactory, for example because it is still not possible to establish which potential issues are real issues, then it is possible to execute again cycle 2 and 3 until the results become more clear. In these repetitions, to increase the chance of having better results, it is possible to vary some parameters like the level of granularity and the time windows. To vary those parameter it is just required to change the respective values in the query to perform on the database of the couplings. For example it is possible to pass from the subsystem abstraction to the folder abstraction or from time windows long one year to time windows long one semester. It does not exist an indication in the literature on how to vary those parameters because each system it’s a different story, and what could work with one system could not work with an other one. So a good approach is to experiment different approximations, compare the results and choose the best one.
2.1.2. EVO - Stage 2
The second stage of EVO consists in finding a refactory proposal to address the spotted evolutionary threats. This means using one of the solutions proposed to solve the classical “anti-patterns” [Gamma, 1995; Alpert, 1998; Fowler, 1999; Demeyer, 2002] or defining a new one that could fit better the specific context. Choosing among the alternatives, it is important to study the tradeoff for each of them, and in particular focus on the one that not only solves the current problem but that could also accommodate possible future changes.
EVO suggests to address the issues from attribute level until system level, passing via function, class, file, module and subsystem level (depending by the system decomposition). This operation is divided into the following two parts.
Stage 2 - Part 1
The first part focuses on the lowest levels, which has an impact on attributes and functions. It consists mainly in code cleanup from unused code fragments and simplification of functions. The goal here is to improve the readability and the logic behind the code because its understandability directly influences the correctness and quality of the refactoring at a higher level ( performed in Stage 2 - Part
2).
At this point, typical refactoring for attributes are:
‣
rename variable,‣
push variable down,‣
pull variable up,‣
create accessories,‣
abstract variable.Typical refactoring for functions are:
‣
add function to class,‣
rename function,‣
push function down,‣
push function up,‣
add parameter to function,‣
move function to another class/component,‣
extract code in new function.Stage 2 - Part 2
In this second part the work of refactory has a wider scope because it moves from class level until system level. This means that the refactory extends its impact beyond the module boundaries with the aim to concretely remove the unwanted couplings identified in the first stage as true evolutionary threats. The final output of this stage is a system situation where to manipulate code is safer, to understand the existing code is easier, and to make the software evolve is more affordable.
The most common change at this point is “movement of classes/components” from one module to another. The modules affected are the ones involved in the unwanted couplings, and the “parts” moved are the ones whose changes have an impact on each other. The idea is that if those “parts” are placed in the same module, then each module will be able to evolve more easily and independently from each other and its cohesion has been increased.
Defining a refactory strategy at this level of abstraction could be the most complicated operation to perform because it highly depends on the “in-house/embedded knowledge” of the system.
Moving “code” means to know exactly which part is moveable, where and how. This imply an analysis of feasibility and of the risks involved, which could be done for example studying the call-graph of the code under examination.
Moreover, it is also suggested to go through the most common design patterns to check if a solution for the same problem already exists and if it is also suitable for the system under study. Design patterns indeed are meant to speed up the development process by providing domain-specific solution to common problems. Nevertheless, some researchers believe that in situations like this, of refactoring and not of initial development, it is more suitable to use specific “refactoring patterns” as the ones suggested by M. Fowlers et al. [1999], instead of general “design patterns”. For example, just to cite some of the most interesting one at the class level:
‣
moving features between objects:-
extract classes,-
inline classes,-
hide delegate,-
remove middle man-
...;‣
organizing data:-
self-encapsulate field,-
replace data value with object,-
replace array with object-
...;‣
dealing with generalization:-
collapse hierarchy,-
extract subclass,-
extract superclass,-
extract interface-
...;‣
big refactoring:-
convert procedural design to object,-
separate domain from presentation,3.Method Validation at WoodWing
3.1. The Case Study: SmartConnection
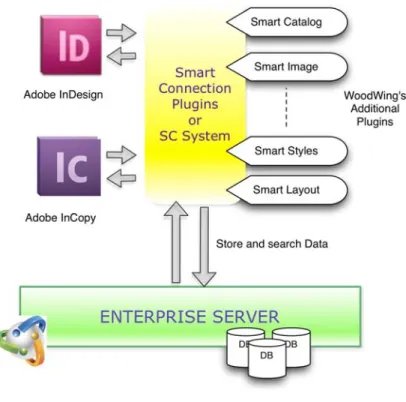
This project thesis focuses only on one branch of the WoodWing products: the “Productivity Plugins”. These plugins enhance the Adobe InDesign and InCopy capabilities for the production of prints and online multichannel publications. In particular, the SmartConnection plugin represents the bridge between InDesign, InCopy and the Enterprise Database Server, the latter also a WoodWing product (Figure 3). To be more specific, SmartConnection allows the designers and the editors to work simultaneously on the layout and on the content of the same publication.
Figure 3 - SmartConnection
During the years, the WoodWing architects and engineers have noticed an increasing gap between the initial software architecture and the actual software product. This gap is due mainly to the fact that less and less time has been dedicated to the design phase along the releases. Furthermore, also the
verification of compliance of the current design with the original one has been disregarded. The result is a messed up architecture typical of “spaghetti-like systems”, that is neither useful in supporting the maintenance of the current product, nor convenient in facilitating future additions.
The original development methodology of WoodWing has been a sort of the classical waterfall model for 10 years, with iterations approximately every year for new releases. In the last two years, they have switched to a more agile approach which is a result of Scrum and eXtreme programming practices very customized to their needs (on the line of “Scrum and XP from the Trenches” by Henrik Kniberg). By now, this switch has improved the development process making the “development cycles” shorter and reducing the scope of the work, but they still have not faced the improvement of the software architecture.
What is clear is that the original design is seriously deteriorated and that the current product needs to be refactored to make any future development task more affordable either from a practical perspective or from the financial point of view. Conversely, what is not clear is the current internal situation of the software and the strategy of refactoring it in a risk-limiting way.
3.2.
Looking for Evolutionary Threats
3.2.1. EVO: Stage 1 - Cycle 1
With the purpose to answer to RQ-1 ( “How to determine the current decomposition of the system
under examination?”), the first action is to get a view about the system decomposition. Assuming the
most typical scenario in which there is not any useful documentation available for this purpose, as in WoodWing, the main methods proposed by EVO are:
‣ interview all the stakeholders involved in the production of the software, ‣ automatically reverse engineering the code,
‣ analyze the source names [Anquetil, 1999].
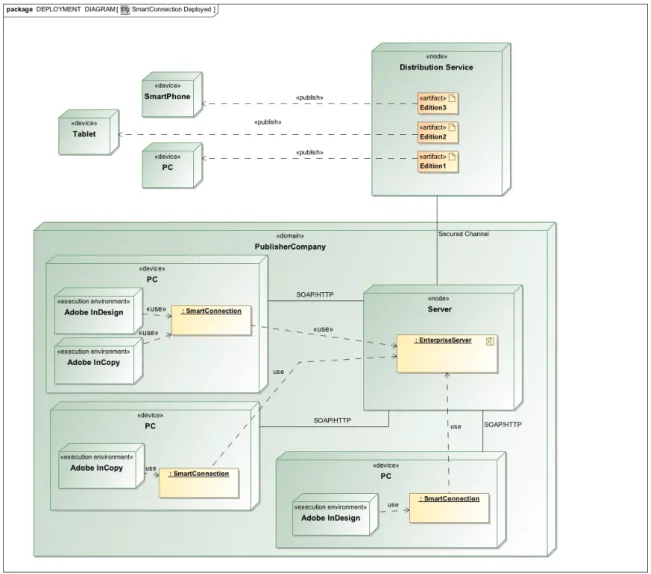
With the interview methodology it has been possible to produce a first view of the system, which is
a UML deployment diagram (Figure 4). It does not differ that much conceptually from the preliminary diagram drawn on the system overview (Figure 3), but it is useful to understand where the SmartConnection system is placed and how it interacts with the surrounding environment.
Within this environment, SmartConnection is logically located in the domain of the PublisherCompany and physically installed on a PC together with Adobe InDesign and/or Adobe InCopy. Those devices have to be connected to the node on which the Enterprise Server is deployed as required by SmartConnection. So, SmartConnection and Enterprise interact according to the client-server model, where the client could be also an other WW product as ContentStation.
Figure 4 - Deployment diagram
After this step, MagicDraw UML has been used to reverse engineer the code, but this
methodology did not work well in this context. Indeed, too many difficulties came out during the process of reverse engineering, such as:
1. the huge number of classes to represent in a readable way in a diagram, even splitting the system into components;
2. the huge number of classes not parsed correctly by the magic draw tool and therefore placed in a default folder;
3. the large number of (base) classes located in the Adobe SDK, which is not really in the scope of SmartConnection.
As consequence, even trying to deal with the size problem, the resulting diagrams were not useful at all for any kind of analysis. Moreover, to configure properly the magic draw parser for this context could have taken too much time, without any clue if good results would have been obtained.
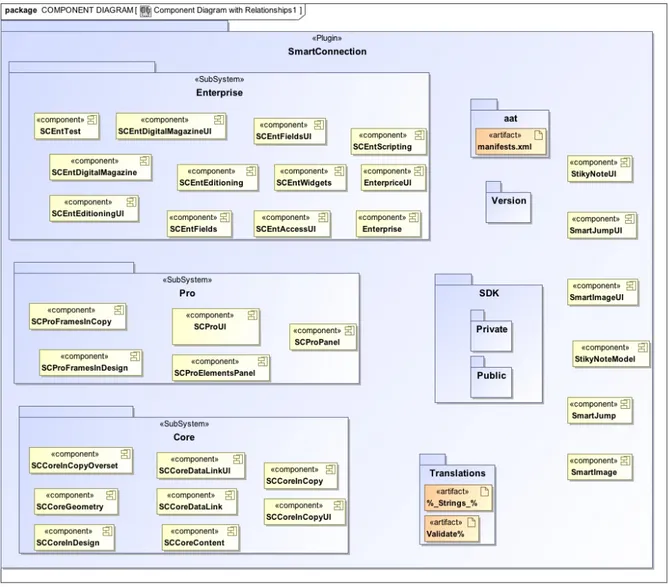
So it has been decided to use also, the analysis of the source names [Anquetil, 1999]. According
to Anquetil, from the analysis of the path of the file names it is possible to outline the decomposition of a system. In the case of SmartConnection, the component diagram in Figure 5 is the result of the application of this method, and it seems to be quite satisfactory to the WW system architect.
The most interesting thing to note about the three subsystems that mainly compose SmartConnection (Enterprise, Core and Pro), is that they currently do not represent any kind of layered or hierarchical structure. Instead, they just encompass a set of functionalities grouped together according to the marketing strategy operated by the company in the past years.
Indeed, originally the Pro and the Enterprise Subsystems were sold separately because they offered different services: the first one was interacting with the FileSystem for the management of the data, the second one, introduced later in time, was interacting with the Enterprise Server (an other WoodWing product). When the FileSystem approach for the data management was considered not really effective, only the second approach, based on the Enterprise server, survived. Despite that, most of the functionalities of the Pro version of the system were reused and this is why in the current system it is still possible to define a logical decomposition in Enterprise, Pro and Core, although this architecture is not in practice anymore. That is the most interesting part of the past evolution of SmartConnection because, to operate those changes, a huge activity of modifications negatively affected the overall architecture.
To summarize the validation of the first cycle of EVO, the interviews with all the people involved in the production of SmartConnection resulted to be the most powerful method: in a situation lacking of design documentation it produced an overview of the system structure in a very short time and without a significant effort. Also the analysis of the source names resulted to be quite effective in catching the main structural features and in preparing a good starting point for the interview with the developers. Instead, the reverse engineering method was time consuming and not even completely applicable for the product under consideration.
3.2.2. EVO: Stage 1 - Cycle 2
The cycles 2 and 3 are meant to answer to the RQ2: “How to identify the unwanted couplings
among the units of decomposition that inhibit the evolvability of the system?”.
In particular, the second cycle of EVO is dedicated to the analysis of the history of the changes
and is articulated in five steps, as described in §2.1.1. What follows is a summary of the work done on SmartConnection for each of those steps.
➡ Step 1: retrieve the list of changes from the versioning system.
The versioning system used in WoodWing is Perforce, that is one of the most modern because it allows the submission of changelists, that are lists of files changed together. This feature resulted to be quite powerful in step 3 of EVO. For now, what is important to cite is that Perforce provides client terminal commands to retrieve those changelists information. To
automate the process of gathering the history logs of the source files, I have enclosed the Perforce commands in bash scripts that as output produced files importable in a relational database. From this point, to analyze the data and compute the coupling information, it was required to write some MySQL queries. Detailed information about this operation are presented in “Appendix 2: Populating the Database”.
This strategy of managing the data resulted to be quite effective during the whole project: once the historical information were imported in the database, instead of writing and testing a script every time that it was required to parse and present the data in a different way, it just required to write few SQL lines to have a new query and a new result.
➡ Step 2: define a level of granularity to analyze the relationships among the software entities (subsystems, modules, components, folders, files, classes or functions).
In the description of EVO (§2.3), it has been discussed the importance of choosing appropriate values for two parameters that will directly affect the “quality” of the couplings: the level of granularity of the code entities involved in the couplings, and the time windows. Here is explained the choice concerning the level of granularity, the time windows are covered in step 4. Files and plugins are the two levels of granularity chosen, because at the time of the “script strategy” experimented in the step 1, the folder granularity already resulted in being a wrong abstraction. The reason was that just few folders (generally called Source and Header) for each plugin contained most of the files. As consequence, also most of the couplings were among those few folders. Clearly this situation does not provide any interesting information to help in the identification of unwanted couplings.
Instead the plugin level of abstraction resulted to be more appropriate than the folder one: from the research conducted in the first cycle of EVO, it came out that the plugins are the fundamental “components” on which is based SmartConnection. Besides this, also the file level has been taken into account because to analyze in a successive step the entities involved in the cross-plugin couplings, it is required to move to a lower level of abstraction, and after the folder level, the most significant one is the file level.
➡ Step 3: group the code entities involved in the changes according to the same development task.
Those groups are also named change sets.
In the case study under consideration, it was not required to perform any approximation work to define the change sets. Indeed, the version management system used within WW supports the notion of change set, allowing the developers to commit together the files affected by the same logical modification. Along with this, the development process adopted by the team, includes specific rules for the check-ins that basically make them timely consistent with the development tasks performed. As it is easily understandable, those conditions made the analysis of the
change history much easier compared to the other research works previously analyzed [§2.2, Fischer and Gall, 2006; D’Ambros, 2009; Vanya, 2012].
➡ Step 4: define the size of the time windows and the starting date of the first time window according to which analyze the tendency of the relationships.
Once collected the data in the database, it was also easy to try different options for the time windows. In particular, in this project I have tried time windows lasting one year, one semester, four months, and one version (the time between two successive versions of the system).
At the end, a duration of one year was selected because in all the other time frames the occurrence of changes was almost uniform and close to zero for most of the couplings. Only in the yearly intervals was indeed possible to spot couplings that were occurring more often in the recent past.
About the starting date of the first time windows, the first choice corresponding to the first “commit” in Perforce became also the final choice. After having analyzed the results for different intervals of the time windows, I have not found any important reason or significant improvement in trying to change it.
➡ Step 5: mark the relationships that could point to evolutionary threats.
Generally the parts of the software which contain most of the defects are also the most changing one, and because 80% of those defects are usually located in about 5% of the code [Demeyer et al. 2002], it means that a lot of source files (the ones that represent about 95% of the code) are not relevant in the analysis of the couplings. Therefore, it is convenient to take into account those considerations in case where a lot of couplings have to be investigated: indeed it is also statistically easier to find files belonging to the 95% sector then the ones belonging to the 5%. Of course it will not be possible to identify all the files to exclude, but very likely in many system there are files quite stable that could easily be found.
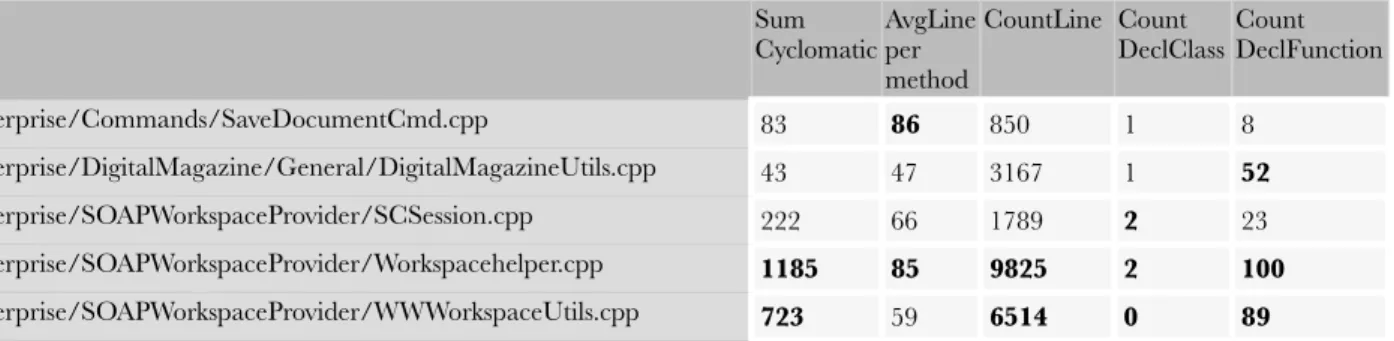
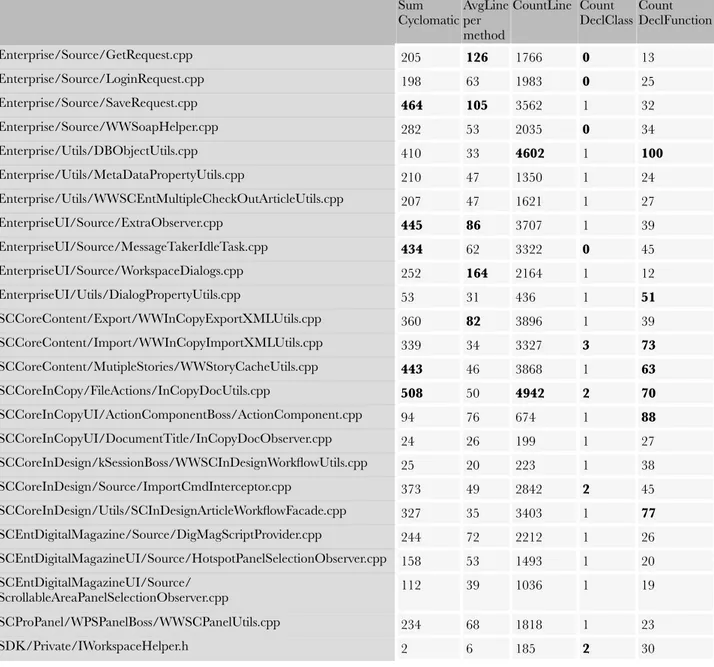
I have applied those assumptions in the analysis of the couplings of SmartConnection. Thanks to the analysis of the frequency of changes and to four crosschecking sessions with the experts of the system, it was possible to spot 864 files (out of about 2000) not relevant in the maintenance process. At the end, the exclusion of those files resulted in a reduction of the total amount of couplings from 5 million to 2.3 million. It is still a big number, but at least the computation time of the successive analysis on SmartConnection (queries on the database, metrics calculation, ...) are reduced to more then 50%, which is an interesting result.
To summarize the validation of this second cycle, the results obtained show that, at least for this specific system, removing first the files not relevant will simplify of a big factor the successive analysis
of the couplings. It will be interesting to verify in future works what are the result of this step for other systems.
So “Stage 1 - Cycle 2” concludes with a database of 2.3 million of logical couplings for more than 10 years of the SmartConnection lifetime. Those couplings are collected into the database in both the level of granularity chosen, file and plugin, and these are all potential evolutionary threats. The next cycles are necessary to select a subset of real threats among those potential couplings. How this further step is accomplished will clarify how EVO differs from the other approaches.
3.2.3. EVO: Stage 1 - Cycle 3
This stage consists mainly in reducing the potential couplings previously identified, to a subset that contains real unwanted couplings. In EVO this subset is obtained by finding “bad smells” within the files involved in couplings with increasing tendency of changes (just identified in the previous cycle). So the aim of this cycle is to refines the current list of couplings.
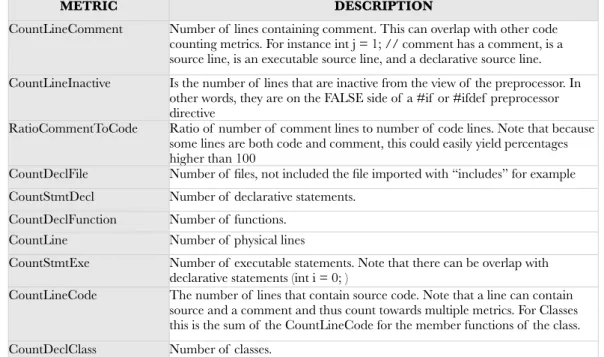
The principal software metrics that I have taken into account for SmartConnection are size and complexity. The reason is that by focusing on the size of the classes it is possible to spot possible god classes. Then by looking at the size and the complexity of the methods, it is possible to point to fragments of code that are hardly maintainable and that with high probability need to be refactored. The tool used in this project to estimate the basic software metrics is “Understand”, and thanks to its ease of usage, it took just few hours to have several useful measurements. Table 1 lists and explains some of those metrics taken into account related to the size.
METRIC DESCRIPTION
CountLineComment Number of lines containing comment. This can overlap with other code counting metrics. For instance int j = 1; // comment has a comment, is a source line, is an executable source line, and a declarative source line. CountLineInactive Is the number of lines that are inactive from the view of the preprocessor. In
other words, they are on the FALSE side of a #if or #ifdef preprocessor directive
RatioCommentToCode Ratio of number of comment lines to number of code lines. Note that because some lines are both code and comment, this could easily yield percentages higher than 100
CountDeclFile Number of files, not included the file imported with “includes” for example CountStmtDecl Number of declarative statements.
CountDeclFunction Number of functions. CountLine Number of physical lines
CountStmtExe Number of executable statements. Note that there can be overlap with declarative statements (int i = 0; )
CountLineCode The number of lines that contain source code. Note that a line can contain source and a comment and thus count towards multiple metrics. For Classes this is the sum of the CountLineCode for the member functions of the class. CountDeclClass Number of classes.