? 20* % a ., < s w k w v r C as a u r a -M A M E -.W e hes
Ir 232A - 1981
SN 0347-6030
232A
APP
Statens vag- och trafikinstitut (VTI) - 581 01 ljnkoping
National Road &Tra ic Research Institute ' 5-581 01 Linkoping - Sweden
Computer programs and simulation
models with associated field
experiments for the Indian road
user cost study
by Costa Gynnerstedt Rod Troutbeck
3.1 3.2 3.2.1 3.2.2 3.3 4.1 4.1.1 4.1.2 4.1.2.1 4.1.2.2 4.1.3 4.2 4.3 INDEX ABSTRACT SUMMARY
PHILOSOPHY OF SIMULATION MODELLING OUTLINE OF THE VTI RURAL ROAD
TRAFFIC SIMULATION PROGRAMS
GENERAL APPROACH FOR THE MODI-FICATION AND EXTENSION OF THE VTI SIMULATION MODEL FOR INDIAN PURPOSES Discussion
Recommendations Traffic behavior model
Traffic input model
Extension of the simulation model
FRAMEWORK FOR ACTIVITIES IN THE PROJECT Activities for the input models
Road description
Traffic stream generation model Cars, buses and trucks
Animal-drawn vehicles
Activities for the input models
Activities for the free flowing traffic
simulation program
Activities for the simulation model for traffic interaction
EQUIPMENT AND INSTRUMENTATION ACTIVITIES IN AN OVERALL WORK PRO-GRAM FOR THE SIMULATION STUDY TIME SCHEDULE FOR EXCHANGES OF VISITS IN 1981
RESPONSIBILITIES OF THE VARIOUS INSTITUTIONS COOPERATING IN THE SIMULATION STUDY FOR THE RUCS
4. O O V O \O \ 4 -10 10 10 11 12 12 12 13 15 18 21 22 23
Computer programs and simulation models with associated field experi-ments for the Indian road user cost study
by
Costa Gynnerstedt,
National Swedish Road and Traffic Research Institute (VTI), Linkoping, Sweden
and
Rod Troutbeck,
Australian Road Research Board (ARRB),
Melbourne, Australia
ABSTRACT
This paper outlines the complementary activities and tasks that need to be undertaken for the Indian Road User Cost Study with the introduction of traffic simulation technique and augments the discussion contained in
the Indian RUCS Technical Papers No. 54 and 61. The authors have
concentrated on different aspects in this paper. G Gynnerstedt has
focused on the system and simulation modelling aspects to outline the
responsibility of the VTI, CRRI and others in c00perative efforts for the
Indian Road User Cost Study. R Troutbeck has primarily addressed
aspects of the instrumentation, especially those for which ARRB is responsible and also field studies to be performed for the study.
The paper has been completed after discussions held between G Gynner-stedt, Mr Kadiyali and his staff and with Professor Marwah, ITT, Kanpur. In the meantime the agreement between CRRI and VTI has been signed and the c00peration is formalised by SIDA.
II
Computer programs and simulation models with associated field experi-ments for the Indian road user cost study
by
Gosta Gynnerstedt,
National Swedish Road and Traffic Research Institute (VTI)
Linkoping, Sweden
and
Rod Troutbeck,
Australian Road Research Board (ARRB) Melbourne, Australia
SUMMARY
The report gives the preliminary outlines for a modification and extension of a simulation model for motortraffic on two lane roads as well as its validation intended for adOption on mixed traffic condition in India on
two-lane roads, intermediate and single-lane roads, as well as traffic
performance studies for the validation of the model.
The simulation model is developed at the National Road and Traffic
Research Institute in Sweden (VTI) as well as the method for field studies
for its calibration and validation. The field study technique for
over-taking behaviour has been refined by the Australian Road Research Board
(ARRB) and videotechnique has been applied.
The project is adjoined to an Indian Road User Cost Study as a part of an road investment and maintenance model performed at the Central Road Research Institute (CRRI) in New Delhi on behalf of the Indian Govern-ment and the World Bank. VTI and ARRB are acting as consultants to
CRRI. VTI is sponsored by the Swedish International Development
Authority (SIDA)
PHILOSOPHY OF SIMULATION MODELLING
With the introduction of simulation technique the number of factors that can be taken into account in the evaluation model in principle increases
enormously. In simulation, however, the modeller has to adhere to a
strict discipline to obtain an applicable result. Thus, it is essential
1 that the simulation model be directed to a well-defined task
2 that models in general be simplified as far as circumstances allow,
i.e. the number of variables should be as small as possible
3 that the relevant variables contained in the model can be calibrated
4 that care be taken to ensure that the computer program of the
simulation model remains economical to run and easy to use
In this case the results of the simulation model are to be incorporated into a Highway Design Model (HDM). Accordingly the output of the simulation model should supply the HDM-model with the information requested and nothing more. The output from the simulation model need be no better than the requirements of the HDM-model.
As the simulation model applied here is a causal model on replicating the traffic procedure at the micro level, the calibration of the simulation demands high accuracy of the data collected in the field. The collection of data for calibrating all parameters incorporated in the simulation models can be extremely time-consuming and expensive. Accordingly the field experiments should concentrate on the important variables and should not place undue emphasis on a detailed calibration of the less important parameters.
Once the various parameters in the simulation model have been
calibrat-ed, the reliability of the output should be examined. This is usually
termed validation and involves the comparison of traffic Operations on a stretch of road with those predicted by the model. During the validation
stage only a sample of possible road types needs to be tested. This
demonstrates the importance of defining the simulation task with regard to the investment model's requirement.
2. OUTLINE OF THE VTI RURAL ROAD TRAFFIC SIMULATION PRO-GRAMS
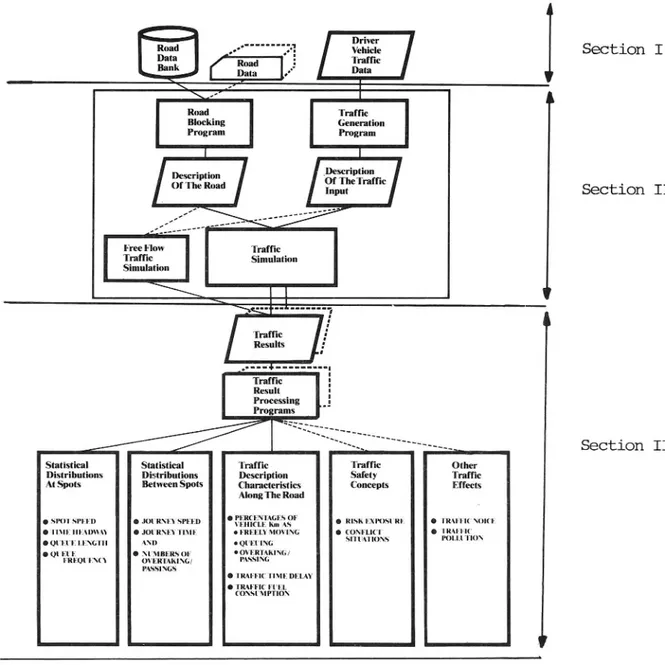
The VTI simulation program, as outlined in a VTI report by Brodin, Gynnerstedt and Levander (VTI Meddelande No. 143) is in fact a suite of programs consisting of three major sections as is shown in Diagram 1 in the following: Section I
Traf c Generation Program Road Blocking Program Description Of TheTraf c Description
Of The Road Section I I
Traf cSimulation Free Flow Traf c Simulation Traf c Results
Traf c Result Processing Programs --~s~~~.~. §N.~~ ~_-~n-~~ \~~ ~~~_~~ ~N ~~-- Section III
Statistical Statistical Traffic Traffic Other
Distributions Distributions Description Safety Traf c
At 590 s Between Spots Characteristics Concepts Effects
Along The Road
0 SPOT SPFFD o JOl'RNl-ZY SPEED . o RISK FXI OSl RF o 'I'RAI I K' V()l('li
o in : m:.u)\\.-\\ o JOl'RNl-IY mu: 0 mun MOVING o CONFLICT o 'I RM I K I
. Ql lll'lg l fZNG'I'II AND . lerlleG SITUATIONS I ()I.l.l I ION
0 0| NFI- Rlin I-i\( \ 0 Nl'MBERS orOVERMKING/ 0 OVER IAKING/PASSING
PASSINGS
O TRAFFIC I'IMF. DELAY O TRAFFIC Fl'EL ( ONSl'M PI ION
Diagram 1 The position of the simulation program in
the program system.
The first section constitutes the input. In a series of programs the given road parameters are processed in order to prepare the simulated road. Another set of programs generates the different types of driver-vehicle
units and puts them into a traffic stream by allotting each unit a
time-headway and an appr0priate entrance speed.
The second section consists of programs describing traffic behaviour along the stretch of road. The simulation is performed as traffic moving freely
(zero-flow) or as a traffic flow with vehicular interaction.
Finally, in the third section the results from the simulation program are
fed into a set of computer programs which reorganise the output of the
simulation run and present the output in a manner which is applicable for particular comparisons.
Similarly the field data for calibration and validation can also be reorganised with these programs which underlines the demand for accuracy in the field data mentioned above.
3.1
GENERAL APPROACH FOR THE MODIFICATION AND EXTENSION OF THE VTI SIMULATION MODEL FOR INDIAN PURPOSES
Discussion
With regard to the time frame for RUCS, it was decided to draw upon the
experience of the VTI-simulation model. A modification of an existing model and computer program would take a shorter time, especially if the model is well-structured and the computer program is reliable. Further-more the simulation program needs an extensive complement of input and output programs as well as programs for processing field data required for the calibration and validation of the traffic simulation model. Thus a whole system of programs has to be established. The question then is how to modify a traffic simulation model of motor vehicle traffic interactions
so that the model reflects the mixed traffic conditions prevailing in India.
A straightforward way is to identify all types of road users movement and to describe their movements individually, i.e. keep track of them
indi-vidually along the road.
Another way is to take only the relevant types of road users with regard to the information needed into account and ignore the rest. This way of procedure is possible if the road users ignored do not influence the
important traffic elements. If so the non relevant traffic might be
introduced as a disturbance factor.
The following recommendation for the modification and expansion of the traffic simulation model is based upon the prerequisites mentioned above, 8.8.
- the purpose of the model
- the time frame available for modification, expansion of the model,
its calibration and validation and its implementation
the resources available for field-studies
Thus, more soPhisticated and time-consuming expansion must be left for
further research within the RUCS. VTI RAPPORT 232 A
Bearing in mind the application of the simulation program, e.g. furnishing traffic data to the HDM-model, it is necessary to judge how to represent the different categories of road users in the model.
In this judgement, it also has to be taken into account that
a) The traffic model is complex involving many coefficients which have
to be calibrated. Care should be taken not to substantially increase the number of coefficients with unnecessary modifications.
b) The complexity of the computer program and the number of moving
elements simulated affect the computer time required. At present the computer program generates and keeps track of all moving elements along the stretch of road. Any large increase in the number of moving elements will increase computer run times.
c) The range of the field studies grows with the number of road user
categories taken into account.
d) The time available for modifying, calibrating the coefficients with
the aid of field studies and validating the model imposes restrictions on the efforts that can be spent.
As already stated the traffic simulation is intended to give journey times and fuel consumption as input to the HDM-model. Thus output for traffic elements, not taken into account in the Road User Cost calculations, will be of little value and would constitute irrelevant output in this sense. Some of the important aspects to be considered when deciding how to represent different types of vehicles have been discussed above. Further insight is gained when the following factors are considered:
the speed of the vehicle
the space occupied on the road by the vehicle. As shown below this enables further consideration of the impedance between different vehicle types.
S eedp Fast mOVing. Slow moving
Width traffic traffic
of vehicl elements elements
Broad
Intermediate Motor rickshaw Cycle rickshaw,
hand cart
Narrow Motorcycle Bicycle,
pedestrian
3.2
3.2.1
The inclusion of each category of elements in the simulation model should be evaluated from an assessment of their disturbance on other vehicles. Before each element is included in the model the comments raised above
should be borne in mind. It may be that particular elements are
generally used for local traffic and their origin and destinations cannot be accurately determined. In this case, the simulation of their effect will be difficult.
be considered as a random disturbance to overtaking and crossing ma-If a vehicle element is not simulated in detail, then it may
DOBUV res.
Recommendations
The principal recommendation is that the trajectory of only the more important elements should be determined in the simulation model. The less important elements may be considered to be a disturbance.
Traffic behaviour model
In particular it is recommended that particular vehicle types be modelled
as discussed below.
Truckg buses and cars are taken into account in the HDM and must be fully simulated by keeping track of their movements along the road and by giving them entrance and exit points. The remaining categories consti-tute a disturbance to overtaking and crossing trucks, buses and cars.
Animal drawn vehicles (ADV) are wide and thus they constitute a considerable disturbance to trucks, buses and cars. Therefore, they must
be simulated with given entrance and exit points. As they are slow
moving, their acceleration can be neglected and they should all be given
the same constant speed. Consequently, overtakings between animal
drawn vehicles are neglected.
ADV:s appear as single units or together in platoons. In forming platoons
their headways are small. An overtaking truck, bus or car thus has to
overtake the whole platoon without interruption. It is therefore suggested that a platoon of ADV:s be regarded as one moving unit, whose lenght is
3.2.2
determined by the number of elements in the platoon. The simulation of the behaviour of this category along the road can be performed by the
program as it stands. Some extension of the input model is necessary
according to 3.2.2.
The motor rickshaw is rare in rural traffic and may be neglected.
The motorcycle is fast moving and narrow. Therefore its disturbance on
trucks, buses and cars may be neglected or alternatively motorcycles may
be treated in the same way as the remaining groups below.
Intermediate and narrow slow moving traffic elements, e. cycle rick-shaws, hand carts, bicycles and pedestrians. It is proposed that these be regarded as
a) a general disturbance for trucks, buses and cars at those parts of the
stretch of road where these slow vehicles are frequently represented. It is pr0posed that this be performed by means of an existing mechanism in the simulation model
b) elements which obstruct or extend the time of overtaking and
crossing manoeuvres between trucks, buses and cars and when these fast vehicles overtake ADV units. This disturbance is regarded as random or distributed according to the occurrence of these elements along the road. Some modifications of the overtaking routines are then needed.
This treatment will simplify and economize the simulation runs and is
therefore strongly recommended. Traffic input model
An extension of the traffic input model is needed to generate the slow
animal drawn vehicles. It is proposed that this generation be performed independently of generation of the motor vehicles.
The entry and exit points along the road are determined in a similar
fashion as for trucks, buses and cars.
The simulation run starts by generating vehicles of this type until they are
distributed along the stretch of road, after which the generation of motor
3.3
vehicle traffic starts. This procedure should not prolong the simulation
run greatly and the number of vehicles to keep track of will not increase very much. As they are all given the same speed, they will never interact mutually, which makes them easy to handle. On the other hand they constitute the disturbance intended to the motor vehicle traffic.
As the rest of the vehicles appear only at interactions between motor-driven vehicles and animal-drawn vehicles there is no need to modify the input model.
Extension of the simulation model
The traffic simulation model as it stands covers two-lane paved rural
roads in flat and rolling terrain. According to the figure below the
following extension of the model is needed to meet all demands. Some of these may not be given priority within the framework of this project.
wpe type of road
Tegiain Traffic TWo-lane Intermediate Single-lane
roggr road road
Free flow Functionin Functionin Functionin
traffic 9 g 9
Flat r~
Traffic Need of modification for
with Functioning overtaking and passing
interactions manouvers
Sigifféow Functioning Functioning Functioning
Rolling
Traffic
with Functioning See above flat terrain
interactions
Free flow Need for See remarks above and
traffic scme to the left
Hilly modification
Traffic for vehicle See remarks above and
with behaviour to the left
interactions downhill
l. Two-lane road
An extension to hilly terrain requires a restriction of the downhill speed in
the model. This modification should not be too laborious but needs
emprirical data which have to be collected in India.
2. Intermediate road
The free-flow simulation model gives a good estimation of time and fuel consumption on paved roads where no traffic interaction occurs. If the frequency of ADV:s in particular, but also other types of disturbing road users, is high, then the interactions must be taken into account. The passing of oncoming trucks and buses also influences time and fuel consumption.
Furthermore, a modification of the model with regard to surface
condi-tions must be performed. Gravel and earth roads especially, increase
time and fuel consumption.
3. Single-lane roads
The conditions discussed for intermediate roads are also valid for
single-lane roads.
Priority decisions are left to the Indian authorities who have selected two-lane road traffic in a first step.
4.1
4.1.-10
FRAMEWORK FOR ACTIVITIES IN THE PROJECT
A framework for the various activities aimed at producing a workable simulation model and computer programs and undertaking the necessary field studies is outlined in the following tables. Further comments on some
of the activities follow the tables
Table 1 Activities for the input models
Table 2 Activities for the free-flowing traffic simulation model
Table 3 Activities for the simulation model for traffic interaction
The activities enumerated and commented on in this frame-work are not
complete and the assistance of others involved in the project is called for in creating the complete picture.
The activities in each area are further split up into activities concerning the simulation models and computer programs as well as into activities concerning associated "field studies", i.e."field study equipment", "field study performance" and "processing and refinement of field data".
Activities for the input models
As briefly described above the input models consist of programs preparing the road for simulation and traffic stream generation programs.
Road description
For Swedish purposes a technique has been develOped for collecting adequate road data for the whole primary national road network (about 10,000 km).
By using a special van equipped with inertia-navigation instrumentation the road alignment is measured and processed for storing in a road data bank (RDB). Simultaneously the road width and various other factors are measured manually and stored in the RDB.
l4.1.2
11
A set of computer programs transforms the RDB data for simulation. In order to carry out the simulation the change of the sight distance along
the road must be known especially in rolling and hilly terrain.
If this instrumentation is not available, the road factors required for simulation can be obtained in two ways
- a road design drawing is suitable for the purpose.
This also gives an indication of the necessary accuracy of the data for the second case
by manually collecting the road data required
In both cases the factors must be presented in a format defined by the input of the program.
The sight length is then given for each coordinate along the road
establishing a continuous curve a polygon - in each direction.
The sight length can be derived from the drawing or by measurement in the field.
VTI will prepare instructions for collecting the road factors necessary if CRRI so requests. The format must be specified adequately.
Traffic stream generation model
In the traffic stream generation model the driver vehicle unit is establish-ed. It is also allocated to one of the entry points of the stretch of road and given a time headway to the preceding unit as well as an entry Speed. As is recommended in Chapter 3.2.2 only cars, buses trucks and ADV:s
should be generated. The ADVs should be generated independently and
simulated in a simplified way - all at the same constant speed. Therefore the generation of ADV:s is also a very simple procedure.
4.1.2.1
4.1.2.2
4.1.3
12
Cars, buses and trucks
In the VTI model four different classes of vehicles are represented - cars, trucks and two classes of articulated trucks. For Indian conditions two
classes are recommended
-' cars
- trucks and buses
For each class the power/mass ratio distribution and the basic desired speed distributions must be calibrated. A method for the estimation of
the p values by field study has already been given. The basic desired
speed distribution is then approximated from observed speed distributions.
Animal-drawn vehicles
The generation of these units does not cause much additional work. All the ADV:s are given a high p-value and a low basic desired speed.
Activities for the input models
In Table 1 below some of the important activities are presented according
to the comments above.
Table I Act1v1ties for the input models (Z-lane road)
Road traffic simulation system Field studies
- simulation models Equipment
-simulation programs and data Field study performance
processing programs Field data processing ,
calibration/validation I
AInstructions BModifications CCalibration/ DField study EAdvice Ffdeid study GField data
for using . of simulation validation equipment for performance processing
existing model and of traffic field study programs
computer programs model
Programs
1. Manual for Instruction Measurement
generation Manual in the of horizontal
of road - - technique method used and vertical
(VTI) in Sweden is alignment
available (CRRI)
(VTI) Road width.Etc
- generation bbdify for Calibration According to Measurement of
of vehicle - vehicle types of p value VII-report entry speed
types - basic desired distribution No. 43 and journey
speed distri (see Table II) Manual Uphill time
bution Calibration technique studies for
(IIT) of basic de p value
sired speed estimation
distribution
(seeTable II
and III)
- generation (ADV) -genera- Calibration
of traffic tion model of
"vehicle length" time headway
(IIT) distribution 1
"time headway IIT {
distribution"
J
4.2
13
Activities for the free-flowing traffic simulation program
The free-flowing traffic model predicts free speeds on the road as a
function of road geometry, surface type and vehicle type. The various
activities which are needed to calibrate and validate appropriate
simula-tion models are described in Table 11. Again, comments relating to
various elements in this table are included in this section.
Comments on the free-flow traffic simulation program
The free-flow traffic model is currently usable for two-lane hard top
roads in plain and rolling terrain. The model should be expanded to
include the behaviour of motorists in steep downhill sections and sections in hilly terrain.
The model can also be used for intermediate roads and for single-lane
roads. Here an expansion to non hard top roads probably requires an
expansion of the model but in a first step a calibration of the coefficients in the force-equation would be sufficient.
The expansions mentioned above require validation. The validation
concerns:
1. journey time
2. fuel consumption
The validation of the model of fuel consumption requires some comple-mentary studies. The equipment for these field studies must be discussed separately.
The calibration of the behaviour of fast moving vehicles on bends is possible with the data already collected. Here, the calibration variable is the speed reduction or alternatively the time delay caused by the bend.
The calibration of the behaviour of vehicles on down-hill sections is
required. It is likely that on some downhill sections drivers may wish to travel at a low constant speed. The occurrence of low constant speeds
14
may be verified with journey time studies. This low speed may be
simulated by using a disturbance or an environmental factor in the
existing model.
The uphill behaviour of vehicles is determined by the maximum power to
weight values (p-values). In the simulation, equations similar to those
listed in paragraph 9.2 of RUCS Tech. Paper No. 54 are used to determine
the free speed of vehicles on a grade. The observed p-values can be
calculated using the equation in paragraph 8.2 of RUCS Tech. Paper No. 54. An improved estimate of p-distribution can be ascertained from speed measurements at many points along the uphill section.
If time does not allow for the p-value to be determined using field studies,
then estimated p values can be used. Results from the free-flowing
model calibration data could be used to adjust the p distribution later. The application of the fuel consumption model requires that:
l. VTl produces the report describing the model
2. VTI produces a method for calibrating and validating the model
3. Proposals for instrumentation will be reviewed before the April 1981
expert working group meeting (see Section 7).
Table II Activities for the simulation model for free-flow traffic
(2-lane road)
Road traffic simulation system Field studies
u simulation models Equipment
simulation programs and data Field study performance
processing programs Field data processing
~ calibration/validation
AInstructions BModifications CCalibration/ Field study ElAdvice FField study GField data
for using of simulation validation equipment for performance processing
exiiiting nodal and of traffic field study programs
computero gnrgrwm; model programs Mamr for MWJUDpn?-pmxzandinm fnxaflow I simulation PUXPEW VTI
Calibration Manual tech- According to
a) bends nique for technique
b) calibration journey time already
of uphill at low flow applied
h avnxm roaigamehy road surface hanltop Fuelcxmsmqr _ . . . tion equipmai ExtenSion to Calibration TRRL l
hilly terrain of downhill A number of Measurements Manually
downhill behaviour sections of of entry
behaviour different speed and
elevation journey time
angle
xmp e 1)
15
Activities for the simulation model for traffic interaction
The simulation model for evaluating traffic interaction is the most
important program in the series. The output from this program is the input to the investment model and to road user cost calculations. The
activities needed to calibrate and validate this model are given in Table 111. Some general comments about aspects of this model follow the table.
Table III Activities for the simulation model for traffic with interaction
Road traffic simulation system Field studies
simulation models Equipment
simulation programs and data Field study performance
processing programs Field data processing
calibration/validation
AInstructions BModifications CCalibration/ DField study EAdvice FField study
for using of simulation validation equipment for performance
existing model and of traffic field study
computer programs model
pnxnams
Cbnsi jng annuement Chonxeti
how tomodify cxnnussion vehicle
the VTI model of equipment. types as
and program. ARRB test vehicles
VTI Modifications Instructions CRRl/IIT/VTI Data
for for use of ChOice of rocessin
the ' nt. suitable p g
2-lmx2roai. . AQRBamupme road- andctma.
intermediate 3 ice con_ Stretches reduction.
Fianeixad. ARRBHHI VTI-IIT storing TrahUJg of theCEKa' field data cnam CRRI+ARRB Consulting of Calibration of
calibration journey time
validation on 2-lane
of simulation intermediate
model, 1-lane roads.
VTI IIT+VTI
16
General comments on the simulation program for traffic interaction
The free moving traffic model, as it stands, is applicable to two-lane as
well as intermediate and single-lane roads. The complete traffic
simula-tion model also includes interacsimula-tion between wide motor vehicles on two-lane roads. On each of these road types mentioned above the relative
importance of overtaking and crossing differs markedly.
On two-lane roads the possibilities of overtaking is the predominant interaction causing delays and increased fuel consumption, while a cross-ing between two traffic elements has an insignificant consequence in this
respect.
On intermediate roads the fast moving traffic flow is much lower. Here
fast moving vehicles catch up with other fast moving vehicles infrequent-ly. Fast moving vehicles on the other hand catch up slow moving wide vehicles frequently and overtaking manoeuvres increase journey time and fuel consumption. Crossing manoeuvres between wide motor vehicles and wide vehicles as a whole are predominating and should be taken into
account.
For single-lane roads overtaking between fast moving wide vehicles could be neglected and interest focused on fast moving vehicles overtaking slow
moving wide vehicles. Crossing manoeuvres are also most important and
it is expected that this type of manoeuvre will have a greater effect on
traffic flow on single-lane roads.
To determine the relative importance of the various types of vehicular interaction careful attention should be paid to the following:
1. The frequency of the interaction
2. The time delay and the increase of fuel consumption
3. The influence upon vehicle types of interest in the HDM
17
categories taken into account in the HDM.
The overtaking studies thus should primarily be focused on how cars overtake trucks, buses and other hindering categories, how trucks over-take slower trucks and buses and how animal drawn vehicles are overover-taken by fast moving broad vehicles.
The disturbances from crowds of pedestrians, groups of bicycles, etc.,
must be tackled by another technique (see Section 4).
The relatively low percentage of cars means that cars overtake cars
infrequently and interest should primarily be focused on how trucks are hindered by trucks and slow moving vehicles.
The choice of speed of the test vehicle is also of importance. The higher the speed of the experimental vehicle, the more infrequent is overtaking. For the study of overtaking on two-lane roads the technique and
equip-ment is discussed separately (Section 8).
For the study of crossing and overtaking in intermediate and single lane roads, a simpler technique may be applied.
18
EQUIPMENT AND INSTRUMENTATION
The equipment listed below would be used for the overtaking and crossing experiments designed to calibrate the simulation model. It may be also used as a basis for the equipment for the fuel consumption, rolling resistance and travel time experiments. The equipment logs the speed, position and time of day onto a video tape.
The following equipment will be purchased in Australia, assembled and tested in Australia and brought to India as a System.
Rate Cost Item A$ Quantity A$ National Video Cameras 406 3 1218 National Cassette recorder 1050 2 2100 Monitor 282 2 564 Effects Generator 158 1 158 Video clock 472 1 472 Cabling 120 120 Static Inverters 350 2 700 RotOpulsor 363 1 363 Cine lens 150 2 300 Video Tapes 20 100 2000 Video Spares 1000
Triplex Box (optional) 30 1 30
9025
Provision for price rises (10%) 902
$9927
Therefore, it is necessary to budget for an expenditure of $A 10,000
(Rsl lakh).
At this stage, it is recommended that only the video equipment for the crossing/overtaking experiments should be purchased. This will mean that additional equipment may have to be purchased at a later date.
19
A radar Speed meter was used in Australia and performed satisfactorily. It
was able to give the speed of the overtaking vehicle after the manoeuvre
was complete. It was also able to estimate the closing speed of the
oncoming vehicle when this vehicle is close to the instrumented vehicle.
In the Indian RUCS the precise overtaking behaviour is not as important as the understanding of the conditions for drivers to initiate an overtaking
manoeuvre. Therefore, the speed of the oncoming or overtaking vehicles
is not important and need not be measured. Radar speed meters respond to the strongest reflected signal. If the traffic behaviour and movements in front of the radar speed meter are confusing and fluctuating then the output from the meter will also be of little value. Consequently, it is considered that the purchase of a radar speed meter ($A 2000,00) may be unjustified for the overtaking and passing experiment.
The equipment listed in this section can also be used to log fuel usage if an additional interface is constructed. It would be possible to construct this interface in India or it may be constructed in Australia at a cost of about $100.00. Other alternatives for logging fuel consumption, speed and time will be evaluated by Gynnerstedt (VTI), Abaynayaka (TRRL) and Troutbeck (ARRB). A firm decision of the appropriate instrumentation technique will be made at the next EWG meetings.
As the speed of the vehicle and the time are recorded continuously, it is also possible to determine the rolling resistance of the vehicle on various
road surfaces.
For the journey time experiments, a labour intensive method is considered
to be an apprOpriate technique for low flows. For moderate and higher
flows it is envisaged that some form of recording system should be used. In this case, the use of either a cine-camera or a video camera system
should be investigated. Dr Palaniswami from IIT Kanpur has indicated
that he would be prepared to undertake some initial investigations in the
near future. It is pr0posed that a more detailed assessment of the
suitability of the video equipment for other uses will be undertaken when the prOposed video equipment is operating at CRRI.
20
If speed data is to be collected at three sites for the journey time experiments, then a radar speed meter should be purchased. This meter need not be of the type required for the Australian experiments and a hand gun type is recommended. The cost of this item is SA 1400.00.
The instrumentation to be purchased is SOphisticated and should be used
with care. Physical mishandling will result in poor service from the
equipment. On the other hand, if the wrong switch is activated or if the wrong plug is used then it is unlikely that any damage would result. It is recommended that one person be responsible for the care and main-tenance of the equipment. This person should ideally be an instrumenta-tion engineer. It would not be necessary for this person to accompany the
equipment on all field trips, only that all problems (both minor and major)
and any changes to the system be reported to this person. It is expected that this person would also be in the best position to correct minor faults. CRRI and in particular the instrumentation/electronics engineer should ascertain the feasibility of various government instrumentalities and commercial organisations servicing the video equipment should it mal-function. It would be beneficial if a servicing agent could inspect and understand the mode of operation of these instruments before a fault
occurred. Service guide and manuals will be supplied with the
instru-ments.
STUDY
21
ACTIVITIES IN AN OVERALL WORK PROGRAM FOR THE SIMULATION
In the activity schedule attached, some, but not all, important activities
have been scheduled.
The length of the line representing the activity does not imply the time required. INPUT MODELS AND PROGRAMS FREE FLOW TRAFFIC MODELS PROGRAMS FUEL CONSUMPTION MODEL PROGRAMS TRAFFIC WITH INTERACTION MODEL PROGRAMS FIELD STUDIES CALIBRATION OF MODELS FIELD STUDY EQUIPMENT VALIDATION OF MODELS ROAD DESCRIPTION VEHICLE DESCRIPTION AL A Motor vehicles ADU-units MODIFY MODEL
WITH REGARD TO SURFACE
EXTEND AND MODIFY MODEL WITH REGARD TO SURFACE
two lane road
._ . _ _ . _ _ . _ _ _ _ _ _ _ intermediate road
45
_ _ a _ _ _ .. _ _ . _ _ _ ...
overtaking and passing single lane road overtaking and passing THREE-SPOT MEASUREMENTS
LOW FLOW
FLAT AND ROLLING TERRAIN Road geometry, surface
(TWO or)THREE SPOT MEASUREMEN 5 T4 LOW FLOW FUEL DOWNHILL/UPHILL HILLY TERRAIN VERTAKING STUDY -ODIFY OVERTAKING J EHAVIOUR A -lane road
a
~ - "wt?
_)5_ __ __ _ _ _ _ _ _ _ _ _ _ ._li:QHREE-SPOT MEASUREME les FLOW wo laneCar/car, Truck, Bus; T1 T _ '_'T T I l l l
~45
CONSUMP-TION EQUIPMENT OVER TAKING STUDY VTI RAPPORT 232 A \ KTruck/car, Truck, Bus ADV/Truck, Bus, Car COMPLETE
REE FLOW MODEL 2 Iane road
9&5
COMPLETE TRAFFIC MODEL \ Journey time Fuel consumption with regard to road geometry road surface At Journey time Number of overtakings Headway distributions With regard to road geometry road surface22
TIME SCHEDULE FOR EXCHANGES OF VISITS IN 1981 January February March April May-June October
Contract will be signed by CRRI and VTI.
(The agreement was signed 14 February).
Determine apprOpriate sites for field studies (overtaking study and journey time study).
Mr Troutbeck to bring the video equipment to CRRI from
ARRB.
Steering committee meeting. VTI brings the simulation
pro-gram to India and also takes part in the preparations for
overtaking studies. Discussion and preparation of further
instrumentation requirements and procurement methods.
Further details of the collaboration are discussed.
Indian experts to visit Sweden for some weeks for further
discussions of modifications to the simulation model for Indian conditions and calibration of the model.
Steering committee meeting. VTI visits CRRI.
8.
23
RESPONSIBILITIES OF THE VARIOUS INSTITUTIONS COOPERATING IN THE SIMULATION STUDY FOR THE RUCS
Responsibilities of the National Swedish Road and Traffic Research Institute (VTI), Linkoping, to the Indian Central Road Research Institute (CRRI), Delhi:
According to the agreement for INDO-SWEDISH collaboration in traffic research under the Indo Swedish Program of COOperation in Science and
Technology financed by the Swedish International DevelOpment Authority, SIDA, the cooperation between CRRI and VTI is intended to be comple-mentary to the c00peration already existing between CRRI and the other institutions participating in RUCS; CRRI will be responsible for execution
and progress while VTI will act as adviser.
The CRRI is responsible for the execution of the project and has full responsibility for the time schedule of the project. The VTI, as adviser, will be responsible for providing expert guidance on and information about
the VTI models and programs.
Responsibility of the Australian Road Research Board to the Indian RUCS: ARRB's responsibility in this project will be to purchase video compo-nents, build a speedo-odometer and fabricate these components into a recording system. The costs of the components in the system are to be met by the SIDA grant. This system will be thoroughly tested in Australia
and shipped to India. The shipping costs (or air freight) and any Indian
import duties or taxes are not included in the cost given in this paper and
should be budgeted for by other institutions.
When the equipment is in India, ARRB will continue to offer advice on the
equipment and data collection technique. ARRB will repair, or have
repaired, any component although equipment should only be sent to ARRB if all other avenues for repair have been employed. It is envisaged that most (90 per cent) of all required repairs could be undertaken in India. Other repairs could be done in India with the advice of Australian companies and ARRB.